. 2017 Jul 19;37(29):6837-6850.
doi: 10.1523/JNEUROSCI.3532-16.2017. Epub 2017 Jun 12.

Tweety-Homolog 1 Drives Brain Colonization of Gliomas

Affiliations

Tweety-Homolog 1 Drives Brain Colonization of Gliomas

Erik Jung et al. J Neurosci. .

Abstract

Early and progressive colonization of the healthy brain is one hallmark of diffuse gliomas, including glioblastomas. We recently discovered ultralong (>10 to hundreds of microns) membrane protrusions [tumor microtubes (TMs)] extended by glioma cells. TMs have been associated with the capacity of glioma cells to effectively invade the brain and proliferate. Moreover, TMs are also used by some tumor cells to interconnect to one large, resistant multicellular network. Here, we performed a correlative gene-expression microarray and in vivo imaging analysis, and identified novel molecular candidates for TM formation and function. Interestingly, these genes were previously linked to normal CNS development. One of the genes scoring highest in tests related to the outgrowth of TMs was tweety-homolog 1 (TTYH1), which was highly expressed in a fraction of TMs in mice and patients. Ttyh1 was confirmed to be a potent regulator of normal TM morphology and of TM-mediated tumor-cell invasion and proliferation. Glioma cells with one or two TMs were mainly responsible for effective brain colonization, and Ttyh1 downregulation particularly affected this cellular subtype, resulting in reduced tumor progression and prolonged survival of mice. The remaining Ttyh1-deficient tumor cells, however, had more interconnecting TMs, which were associated with increased radioresistance in those small tumors. These findings imply a cellular and molecular heterogeneity in gliomas regarding formation and function of distinct TM subtypes, with multiple parallels to neuronal development, and suggest that Ttyh1 might be a promising target to specifically reduce TM-associated brain colonization by glioma cells in patients.SIGNIFICANCE STATEMENT In this report, we identify tweety-homolog 1 (Ttyh1), a membrane protein linked to neuronal development, as a potent driver of tumor microtube (TM)-mediated brain colonization by glioma cells. Targeting of Ttyh1 effectively inhibited the formation of invasive TMs and glioma growth, but increased network formation by intercellular TMs, suggesting a functional and molecular heterogeneity of the recently discovered TMs with potential implications for future TM-targeting strategies.

Keywords: Ttyh1; glioblastoma; glioma; invasion; migration; tumor microtubes.


Figures

Figure 1.
Figure 1.
TM formation is restricted to glioblastoma cells cultured under stem-like conditions, but can be rescued by the brain microenvironment. a, b, Glioma growing in the live mouse brain after implantation of S24 GBMSCs cultured under stem-like spheroid conditions (a; arrowheads indicate TMs of invasive cells) and under serum-containing, adherent conditions (b) (z = 180 μm; representative images 12 d after implantation). c, Distance of invaded tumor cells from the surface of the main tumor 14 d after implantation of S24 cells cultured under serum-containing (adherent) versus serum-free (GBMSC) conditions (20–115 cells in n = 3 mice per group; Mann–Whitney test). d, Quantification of TM length of S24 tumor cells cultured under adherent versus GBMSC conditions 14 d after implantation (20–52 TMs in n = 3 mice per group; Mann–Whitney test). e, Representative image of S24 glioma on day 65 (left) and 104 (right), after GBMSCs had been cultured under stem-like conditions (day 65: z = 105 μm; day 104: z = 165 μm). Arrowheads mark typical TMs. f, Representative image of S24 glioma on day 68 (left) and 101 (right), after GBMSCs were cultured under serum-containing conditions (day 68: z = 105 μm; day 101: z = 165 μm). This demonstrates that the cells progressively regain their ability to form morphologically intact TMs (arrowheads) resembling the TMs observed after cultivation under stem-like conditions. g, Heat map of biological functions from ingenuity pathway analysis (IPA) comparing the expression in GBMSCs cultured under stem-like versus serum-containing adherent conditions (RNA microarray data). h, IPA of microarray data from the comparison of GBMSCs cultivated under stem-like spheroid conditions versus serum-containing, adherent conditions showing the 10 most-activated categories. A high positive activation z score indicates an upregulation under stem-like conditions. a–f, Data obtained by in vivo MPLSM; a, b, e, f, 3D images. ***p < 0.001.
Figure 2.
Figure 2.
VGF protein is associated with TMs, without an obvious impact on function. a, Western blot analysis of VGF and Ttyh1 protein expression levels of S24 and T1 GBMSCs cultured under serum-free, nonadherent conditions and serum-containing, adherent conditions for 7 d, demonstrating a downregulation on the protein level under adherent conditions (cropped gels). b, Maximum intensity projection images of immunohistochemical stainings of human nestin (green) and VGF (red) acquired by confocal microscopy (S24 GBMSC tumors). Arrowheads indicate VGF-positive TMs. c, Verification of shRNA knockdown of VGF in S24 GBMSC by Western blot analysis (95% reduction in protein level). d, In vivo 3D MPLSM images of S24 shControl and shVGF GBMSCs on day 40 (z = 45 μm), demonstrating no obvious phenotypical aberration and no apparent difference in tumor invasion and growth. Green, GBMSCs; blue, blood vessels.
Figure 3.
Figure 3.
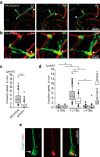
Ttyh1 protein is heterogeneously found in TMs. a, Maximum intensity projection images of immunocytochemical stainings of Ttyh1 (red) in S24 GFP cells (green) revealing Ttyh1 positivity in the cell body and a preferential concentration of Ttyh1 protein along the protrusion membrane (inset: scale bars, 5 μm) and at the growth cone-like tip of these TM-like structures (arrowheads; right, higher magnification of a tip). b, Maximum intensity projection images of an immunohistochemical double-staining of human nestin (green), which specifically labels patient-derived GBMSCs, including their TMs, and Ttyh1 (red) in a S24 GBMSC tumor, demonstrating a unipolar tumor cell (asterisk, cell body) and its Ttyh1-positive TM (arrowheads) within many Ttyh1-negative TMs (arrows) of other tumor cells. c, Immunohistochemical double-staining of the IDH1–R132H mutation (green) and Ttyh1 (red) in a human astrocytoma specimen. A Ttyh1-positive unipolar glioma cell and its TM (arrowhead) is shown. Blue, DAPI. d, Quantification of immunohistochemical stainings of S24 GBMSC tumors showing the fraction of cells with solely Ttyh1-positive TMs (n = 4 mice; Mann–Whitney test). e, Immunohistochemical staining of a S24 GBMSC tumor showing a multipolar tumor cell (asterisk, cell body) with both Ttyh1-positive (arrowheads) and Ttyh1-negative (arrows) TMs. f, Immunohistochemical staining (green, IDH1 R132H mutation; red, Ttyh1; blue, DAPI) demonstrating a multipolar (>4 TMs) tumor cell (asterisk) with Ttyh1-negative TMs in a human astrocytoma specimen. g, Fraction of multipolar cells with 0, 1–4, or >4 Ttyh1-positive TMs in S24 GBMSC tumors determined by immunohistochemistry (n = 4 mice; ANOVA on ranks). h, Representative in vivo 3D MPLSM images of cellular subtypes with zero, one, two, and >4 TMs (S24, T269, T1 GBMSCs). i, Demonstration of cellular subtypes in human astrocytomas (IDH1 R132H mutation-specific antibody). a–g, i, Confocal microscopy. **p < 0.01; ***p < 0.001.
Figure 4.
Figure 4.
Ttyh1 expression correlates with invasiveness in gliomas. a, Invasion distance of cellular subtypes with 1–2 and >4 TMs (S24 GBMSCs) in 24 h measured by repetitive MPLSM in vivo (n = 3 mice, Mann–Whitney test). b, Western blot analysis of Ttyh1 protein levels in different GBMSCs (cropped gel). c, Left, Linear regression revealed a correlation between mean Ttyh1 protein level assessed with Western blot analysis and diffuse infiltration capacity of three different glioma-cell lines in vivo. The dissemination coefficient (mean cell number >1500 μm from the center of tumor bulk in relation to the tumor-bulk area) describes the degree of diffuse infiltration capacity of each GBMSC line (n = 3 mice per cell line). Right, Representative in vivo 3D MPLSM images of S24, T269, and T325 tumors demonstrating the different degrees of diffuse infiltration on day 39 (±5 d). a, c, Data obtained by in vivo MPLSM. ***p < 0.001.
Figure 5.
Figure 5.
Ttyh1 knockdown alters TM phenotypes in vivo. a, Verification of shRNA knockdown of Ttyh1 in S24 (left) and T269 (right) GBMSCs by Western blot analysis (30% reduction in protein level in S24; 96% reduction in T269). b, AlamarBlue viability and proliferation assay of S24 shControl and shTtyh1 cells demonstrates that the metabolic activity/viability [as measured on day 0 (D0)], as well as the proliferation (exponential growth phase shown), is not significantly altered by the shRNA-mediated knockdown (n = 12 replicates for each shControl and shTtyh1; ANOVA on the ranks; mean ± SEM). c, d, Exemplary flow cytometry analyses of S24 shControl and shTtyh1 revealed no significant differences in the Ki67+ growth fraction (c; n = 3 replicates for shControl and shTtyh1 respectively; 2-sided t test; p = 0.066) or apoptosis rate (d; n = 3 replicates for shControl and shTtyh1 respectively; 2-tailed t test; p = 0.289). Red numbers indicate populations in percentage. e, f, Exemplary in vivo 3D MPLSM images of S24 shControl and shTtyh1 GBMSC TMs (e) as well as T269 shControl and shTtyh1 GBMSC TMs (f). Note that shTtyh1 cells show morphologically altered TMs with filament beading (arrowheads). g, Observations of filament beading by MPLSM in vivo itemized regarding cellular subpopulations (n = 6 mice, S24, day 20; n = 5 mice, T269, day 21 ± 2; Mann–Whitney tests). h, Exemplary in vivo MPLSM images of TM-rich multipolar tumor cells in S24 shControl and S24 shTtyh1 tumors showing no phenotypic changes in this cellular subtype. i, Relative fractions of GBMSCs with zero, one or two, and >4 TMs in S24 shControl versus shTtyh1 tumors (20–25 d after implantation; n = 3 mice per group; 2-tailed t tests). j, Absolute number of tumor cells per mm3 categorized regarding these cellular subtypes (n = 3 mice per group; ANOVA on ranks). k, Quantification of the fractions of TM-connected GBMSCs in the cellular subgroups with 1–2 TMs versus >4 TMs, demonstrating that most cells with >4 TMs are connected, whereas the cells with 1–2 TMs are mainly unconnected to other tumor cells in this glioma via their TMs (S24 shControl: day 20 ± 5; S24 shTtyh1: day 20; n = 4 mice per group; 1-way ANOVA). e–k: data obtained by in vivo MPLSM. *p < 0.05; ***p < 0.001.
Figure 6.
Figure 6.
Ttyh1 deficiency slows glioma-cell invasion. a, b, Time series of 3D images of S24 shControl GBMSCs (a; z = 36 μm) and S24 shTtyh1 GBMSCs (b; z = 69 μm) reveal the impaired invasion capacity induced by Ttyh1 knockdown. Left, Arrows indicate the subsequent invasion route; arrowheads label the cell bodies of the invading GBMSCs (green). Red, blood vessels. c, Measurements of the invasion speed of single S24 shControl versus shTtyh1 GBMSCs in vivo measured by repetitive MPLSM over 24 h (128–150 cells from n = 3 mice per group; day 21 ± 1; Mann–Whitney test). d, Measurements of the invasion speed of S24 shControl versus shTtyh1 GBMSCs in vivo subcategorized regarding their number of TMs (13–126 cells from n = 3 mice per group; day 21 ± 1; ANOVA on ranks). e, 3D confocal microscopy image of an immunocytochemical staining of integrin-α5 (ITGA5; green) and Ttyh1 (red) in S24 cells (arrow, ITGA5 enrichment at the growth cone-like tip; arrowhead, colocalization of ITGA5 and Ttyh1 at the tip of the TM). a–d, Data obtained by in vivo MPLSM. *p < 0.05; ***p < 0.001.
Figure 7.
Figure 7.
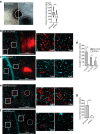
Brain colonization is strongly reduced by Ttyh1 deficiency. a, Spheroid invasion assay from S24 shControl versus shTtyh1 cells in a collagen matrix 48 h after seeding. The surface borders of the spheroids directly after seeding are marked as white lines (n = 3 spheroids per group; Mann–Whitney test). b, c, Representative single-plane images of S24 shControl (b) and shTtyh1 (c) tumors 20 d after implantation demonstrating the reduced brain colonization caused by the Ttyh1 knockdown; middle and right images show higher magnifications of the corresponding regions in the overview (left). Red, GBMSCs; turquoise, blood vessels; circle, tumor injection site. d, Corresponding quantification of invaded S24 tumor cells per range from the main tumor, which was defined as the area with a radius of 500 μm (n = 3 mice per group; Mann–Whitney tests). e, f, Equivalent representative single-plane images of T269 shControl (e) and shTtyh1 (f) tumors. Note that tumorigenicity is massively reduced in the highly diffuse infiltrating T269 cell line. g, Absolute number of tumor cells in T269 shControl versus shTtyh1 measured on a single-plane image of the whole hemisphere on day 20 (n = 3 mice per group; 2-tailed t test). b–g, Data obtained by in vivo MPLSM. **p < 0.01; ***p < 0.001.
Figure 8.
Figure 8.
Ttyh1 deficiency reduces tumor growth and prolongs survival. a, Measurements of overall tumor-cell area in single-plane tile scan images of the whole tumor-bearing hemisphere on day 20 after tumor-cell implantation demonstrating a reduced tumor burden in Ttyh1-knockdown animals (n = 3 mice per group; Mann–Whitney tests, in vivo MPLSM). b, Quantification of immunohistochemical stainings of Ki67 and active caspase-3 in S24 shControl and shTtyh1 tumors (day 45; n = 3 mice per group; Mann–Whitney tests). c, 9.4 tesla T2 MRI images of S24 shControl (day 72) versus shTtyh1 tumors (day 75 after implantation), and corresponding quantification of tumor area/brain area ratio (n = 6 animals per group; 2-tailed t test). Green line, Tumor area. d, Kaplan–Meier survival plot of S24 shControl versus shTtyh1 tumor-bearing mice (n = 6 animals per group; log-rank test). **p < 0.01; ***p < 0.001.
Figure 9.
Figure 9.
TM-mediated tumor-cell interconnections and radioresistance. a, Ratio of TM-connected/non-TM-connected S24 shControl and shTtyh1 GBMSCs 20 and 40 d after implantation (n = 3 mice per group; Mann–Whitney tests). b, Left, Representative 3D MPLSM images of S24 shControl and shTtyh1 tumors before (Pre Rad) and 7 d after (Post Rad) irradiation (z = 51 μm). Right, Corresponding quantification shows absolute cell numbers in a volume of 276 * 103 μm3 before and 7 d after irradiation (n = 3 animals per group; ANOVA on ranks). c, Ratio of cell number 7 d after/before irradiation with respect to TM connectivity (n = 3 mice per group; ANOVA). a–c, Data obtained by in vivo MPLSM. *p < 0.05; **p < 0.01; ***p < 0.001.
Figure 10.
Figure 10.
Schematic illustration of the role of Ttyh1 for TM functions and brain tumor progression. a, In the presence of functional Ttyh1, the subtype of glioma cells extending 1–2 TMs is highly invasive (blue), while another one with multiple TMs interconnecting tumor cells to one multicellular network (red) is more stationary. TMs show a normal phenotype, and the tumor is highly proliferative. b, In the absence of Tthy1, tumors become invasion-deficient and growth-deficient, resulting in greatly reduced brain colonization. The proportion of invasive glioma cells (unipolar/bipolar cells) is dramatically reduced, and the remaining cells of this cell type show pathological TMs (blue cells, box). Multiconnected cells (red cells) are unaltered. Arrows indicate the invasion speed of TMs and tumor cells.

Similar articles

Cited by

References

    1. Abounit S, Zurzolo C (2012) Wiring through tunneling nanotubes—from electrical signals to organelle transfer. J Cell Sci 125:1089–1098. 10.1242/jcs.083279 - DOI - PubMed
    1. Abramova N, Charniga C, Goderie SK, Temple S (2005) Stage-specific changes in gene expression in acutely isolated mouse CNS progenitor cells. Dev Biol 283:269–281. 10.1016/j.ydbio.2005.03.040 - DOI - PubMed
    1. Benjamini Y, Hochberg Y (1995) Controlling the false discovery rate—a practical and powerful approach to multiple testing. J Roy Stat Soc B Met 57:289–300.
    1. Bolstad BM, Irizarry RA, Astrand M, Speed TP (2003) A comparison of normalization methods for high density oligonucleotide array data based on variance and bias. Bioinformatics 19:185–193. 10.1093/bioinformatics/19.2.185 - DOI - PubMed
    1. Cairncross JG, Wang M, Jenkins RB, Shaw EG, Giannini C, Brachman DG, Buckner JC, Fink KL, Souhami L, Laperriere NJ, Huse JT, Mehta MP, Curran WJ Jr (2014) Benefit from procarbazine, lomustine, and vincristine in oligodendroglial tumors is associated with mutation of IDH. J Clin Oncol 32:783–790. 10.1200/JCO.2013.49.3726 - DOI - PMC - PubMed

Publication types