

Consistent effects of nitrogen fertilization on soil bacterial communities in black soils for two crop seasons in China
- PMID: 28607352
- PMCID: PMC5468298
- DOI: 10.1038/s41598-017-03539-6
Consistent effects of nitrogen fertilization on soil bacterial communities in black soils for two crop seasons in China
Abstract
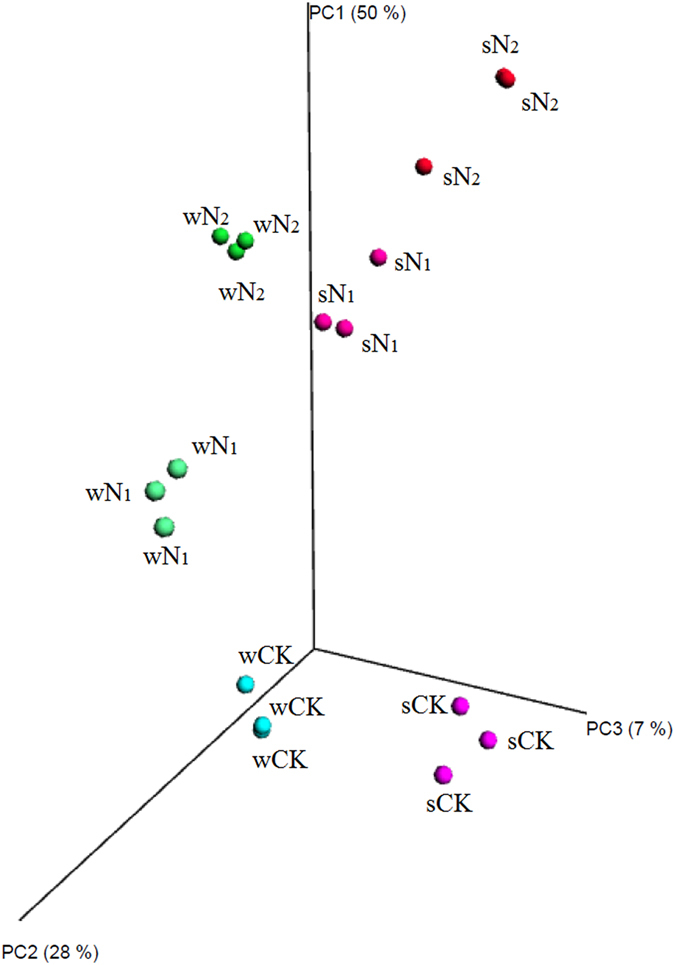
Long-term use of inorganic nitrogen (N) fertilization has greatly influenced the bacterial community in black soil of northeast China. It is unclear how N affects the bacterial community in two successive crop seasons in the same field for this soil type. We sampled soils from a long-term fertilizer experimental field in Harbin city with three N gradients. We applied sequencing and quantitative PCR targeting at the 16S rRNA gene to examine shifts in bacterial communities and test consistent shifts and driving-factors bacterial responses to elevated N additions. N addition decreased soil pH and bacterial 16S rDNA copy numbers, and increased soil N and crop yield. N addition consistently decreased bacterial diversity and altered bacterial community composition, by increasing the relative abundance of Proteobacteria, and decreasing that of Acidobacteria and Nitrospirae in both seasons. Consistent changes in the abundant classes and genera, and the structure of the bacterial communities across both seasons were observed. Our results suggest that increases in N inputs had consistent effects on the richness, diversity and composition of soil bacterial communities across the crop seasons in two continuous years, and the N addition and the subsequent edaphic changes were important factors in shaping bacterial community structures.
Conflict of interest statement
The authors declare that they have no competing interests.
Figures


References
-
- Zhou J, et al. Thirty four years of nitrogen fertilization decreases fungal diversity and alters fungal community composition in black soil in northeast China. Soil Biology & Biochemistry. 2016;95:135–143. doi: 10.1016/j.soilbio.2015.12.012. - DOI
-
- Lamarque JF, et al. Assessing future nitrogen deposition and carbon cycle feedback using a multimodel approach. Analysis of nitrogen deposition. 2005;110:2657–2677.
-
- Wang, N. et al. Variability in responses of bacterial communities and nitrogen oxide emission to urea fertilization among various flooded paddy soils. Fems Microbiology Ecology91 (2015). - PubMed
Publication types
MeSH terms
Substances
LinkOut - more resources
Full Text Sources
Other Literature Sources
