. 2017 Jun 12;7(1):3236.
doi: 10.1038/s41598-017-03361-0.

RIM1/2 in retinal ganglion cells are required for the refinement of ipsilateral axons and eye-specific segregation

Affiliations

RIM1/2 in retinal ganglion cells are required for the refinement of ipsilateral axons and eye-specific segregation

Ahlem Assali et al. Sci Rep. .

Abstract

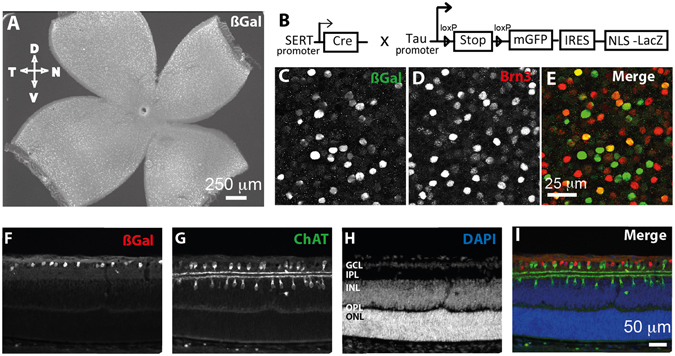
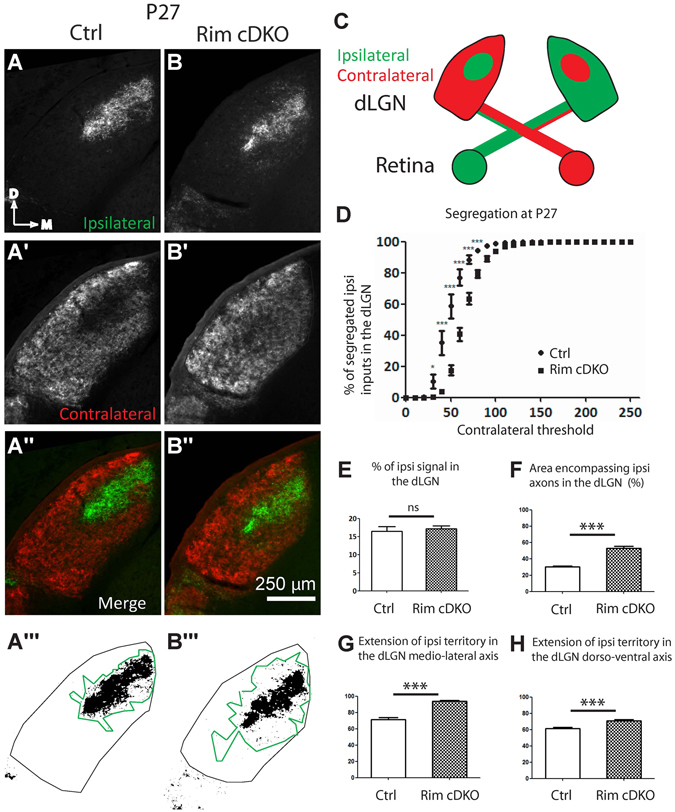
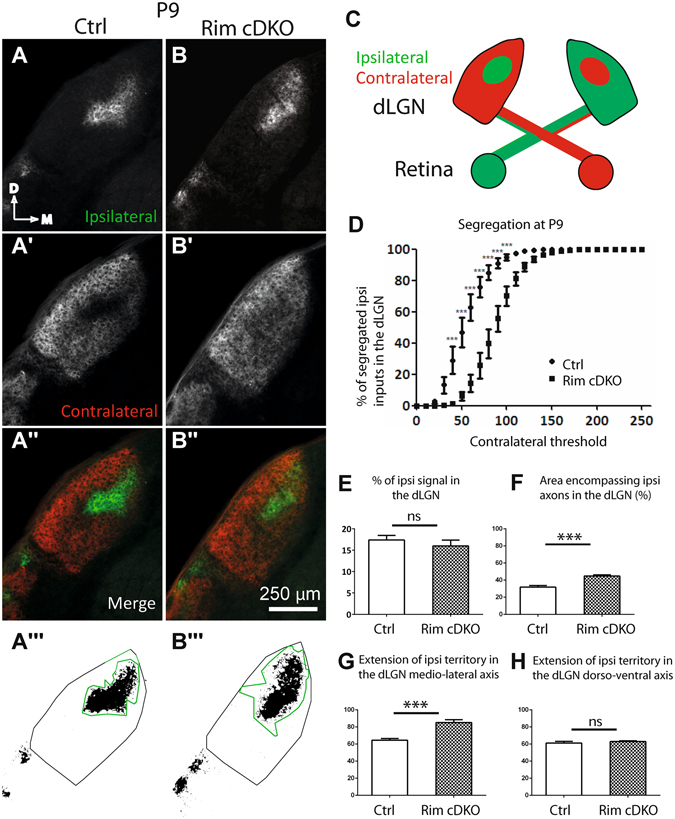
Neural activity is crucial for the refinement of neuronal connections during development, but the contribution of synaptic release mechanisms is not known. In the mammalian retina, spontaneous neural activity controls the refinement of retinal projections to the dorsal lateral geniculate nucleus (dLGN) and the superior colliculus (SC) to form appropriate topographic and eye-specific maps. To evaluate the role of synaptic release, the rab-interacting molecules (RIMs), a family of active zone proteins that play a central role in calcium-triggered release, were conditionally ablated in a subset of retinal ganglion cells (RGCs). We found that this deletion is sufficient to reduce presynaptic release probability onto dLGN neurons. Furthermore, eye-specific segregation in the dLGN and topographic refinement of ipsilateral axons in the SC and the dLGN, are impaired in RIM1/2 conditional knock-out (Rim-cDKO) mice. These defects are similar to those found when retinal activity is globally disturbed. However, reduction in synaptic release had no effect on eye-specific lamination in the SC nor on the retinotopic refinement of contralateral axons in the SC. This study highlights a potential distinction between synaptic and non-synaptic roles of neuronal activity for different mapping rules operating in visual system development.


Conflict of interest statement

The authors declare that they have no competing interests.

Figures

Figure 1
Figure 1
Cre recombination in the retina of P7 Sert-Cre mice. (B) Description of the reporter mouse line Sert Cre/+ TaumGFP-NLS-LacZ/+ used to identify the cells expressing Cre recombinase. (A) Whole-mount retina at P7 after βGal immunostaining and inset with βGal (C) and Brn3 (D) co-immunostaining (E). βGal (F), ChAT (G) and DAPI (H) stainings on retinal sections in SertCre/+ TaumGFP-NLS-LacZ/+ mice at P7. Merged image (I) shows that most recombined retinal cells are located in the ganglion cell layer (GCL) and excluded from displaced starburst amacrine cells (ChAT+) located in this layer.
Figure 2
Figure 2
Decreased probability of glutamate release at the retinogeniculate synapse in Rim-cDKO mice. (A) Sample evoked excitatory postsynaptic currents recorded in dLGN neurons in response to paired stimulations of the optic tract (interstimulation interval 100 ms). Neurons were held at a holding potential of −65mV. Each trace is the average of 16 consecutive recordings at 0.1 Hz. The first EPSC of each trace was scaled for comparison. Scale bars: 50 pA and 50 ms. (B) Summary histogram showing the paired-pulse ratio (mean ± SEM; control 0.79 ± 0.04 versus Rim-cDKO 0.91 ± 0.03), defined as the mean amplitude of the second EPSC divided by the mean amplitude of the first EPSC for 10–16 consecutive traces recorded at 0.1 Hz. Each open circle represents the calculated PPR value for one individual cell. Control: n = 22 cells from 3 mice. Rim-cDKO: n = 28 cells from 4 mice. **p = 0.009, 2-tailed T-test
Figure 3
Figure 3
Eye-specific segregation in the dLGN at P27 requires RIM1/2. Anterogradely traced retinogeniculate projections (A-B″) in control (A-A″) and Rim-cDKO (B-B″) mice at P27. Ipsilateral (A,B) and contralateral (A′,B′) projections. Region encompassing ipsilateral axons within the dLGN on a binary image of ipsilateral signal in control (A″′) and Rim-cDKO (B″′) mice and quantified in F. (C) Schema representing the CTB-AlexaFluorDye injection in the eyes and the contralateral and ipsilateral projection in the dLGN in a coronal plane (D) Segregation plot: Percentage of segregated ipsilateral inputs as a function of contralateral threshold. Two-way ANOVA test revealed a significant eye-specific segregation defect in Rim-cDKO mice. *p < 0.05, ***p < 0.001. Errors bars: SEM. (E) Ratio of ipsilateral pixels to the total number of pixels in the dLGN. Mann-Whitney test revealed no difference between control and Rim-cDKO in terms of proportion of ipsilateral projections within the dLGN. (F) Quantification of the region encompassing all ipsilateral axons within the dLGN. Mann-Whitney test revealed that the ipsilateral territory is more extended in Rim-cDKO mice than in control mice. Error bars: SEM values. ***p = 0.0003. Extension of the ipsilateral territory along the medio-lateral axis (G) and along the dorso-ventral axis (H) of the dLGN. Mann-Whitney test revealed that the ipsilateral territory is more extended in both axis. Errors bars: SEM values. ***p = 0.0003. ns: non significant.
Figure 4
Figure 4
Eye-specific segregation in the dLGN at P9 requires RIM1/2. Anterogradely traced retinogeniculate projections (A-B″) in control (A-A″) and Rim-cDKO (B-B″) mice at P9. Ipsilateral (A,B) and contralateral (A′,B′) projections. Region encompassing ipsilateral axons within the dLGN on a binary image of ipsilateral signal in control (A″′) and Rim-cDKO (B″′) mice and quantified in F. (C) Schema representing the CTB-AlexaFluorDye injection in the eyes and the contralateral and ipsilateral projection in the dLGN in a coronal plane (D) Segregation plot: Percentage of ipsilateral segregated inputs as a function of contralateral threshold. Two-way ANOVA test revealed a significant eye-specific segregation defect in Rim-cDKO mice. ***p < 0.001. Errors bars: SEM. (E) Ratio of ipsilateral pixels to the total number of pixels in the dLGN. Mann-Whitney test revealed no difference between control and Rim-cDKO in terms of proportion of ipsilateral projections within the dLGN. (F) Quantification of the region encompassing all ipsilateral axons within the dLGN. Mann-Whitney test revealed that the ipsilateral territory is more extended in Rim-cDKO mice than in control mice. Error bars: SEM values. ***p = 0.0008. Extension of the ipsilateral territory along the medio-lateral axis (G) and along the dorso-ventral axis (H) of the dLGN. Mann-Whitney test revealed that the ipsilateral territory is more extended in the medio-lateral but not in the dorso-ventral axis. Errors bars: SEM values. ***p = 0.0008. ns: non significant.
Figure 5
Figure 5
Ipsilateral retinocollicular projection requires RIM/2 for their topographic refinement. Anterogradely traced retinocollicular projections in control (A-A″, C-C″) and in Rim-cDKO (B-B″, D-D″) mice at P27. Ipsilateral (A,B,C,D) and contralateral (A′,B′,C′,D′) projections. (E) Schema representing the CTB-AlexaFluorDye injection in the eyes and the contralateral and ipsilateral projection in the SC at different rostro-caudal level. Ratio of ipsilateral pixels to the total number of pixels in the rostral (F) and caudal (H) SC. Mann-Whitney test revealed no difference in the proportion of ipsilateral projections between control and Rim-cDKO mice both in the rostral and caudal SC. Area occupied by the ipsilateral projection within the rostral (G) and caudal SC (I). Mann-Whitney test revealed that the ipsilateral territory is more extended in Rim-cDKO mice than in control mice both in the rostral and caudal SC. Error bars: SEM values. **p = 0.0012, ***p = 0.0003. ns: non significant.
Figure 6
Figure 6
Normal retinotopic refinement of contralateral projections in the medio-caudal SC. (A) Schema representing the focal DiI injection in ventro-nasal (VN) retina and the retinotopic location of the retinocollicular projection in whole-mount view (B,C) Dorsal view of whole SC at P15. Focal target spot in the medio-caudal part of the contralateral SC after a focal DiI injection into VN retina in control (B) and in Rim-cDKO (C). Mann Whitney test revealed no difference in the size of the DiI patch in Rim-cDKO compared to control mice. Error bars: SEM values. ns: non significant. Scale Bar: 500 μm
Figure 7
Figure 7
Effects of activity perturbation on eye-specific and topographic maps. (AD) Schematic representations of whole retinal projections coming from the left eye (green) and the right eye (red) in the dLGN and in the rostral SC. Hatched regions correspond to regions where ipsilateral and contralateral axons overlap. (EH) Topographic organization of ipsilateral (left) and contralateral (right) projections on a dorsal view of the SC. The entire ipsilateral projection was represented in green while the contralateral projections corresponding to focal injections into the ventro-nasal retina are represented in red. (H) Topographic organization of ipsilateral projections from both eyes after monocular intraocular injection of TTX. cKO: conditional knockout; KO: knockout; DKO: double knockout; dLGN: dorsal lateral geniculate nucleus; nAChR β2: beta2 subunit of the nicotinic acetylcholine receptor; RGCs: retinal ganglion cells; SC: superior colliculus; VGLUT2: vesicular glutamate transporter 2; TTX: Tetrodotoxin; C: caudal; L: lateral; R: rostral; M: medial; D: dorsal; T: temporal; V: ventral; N: nasal.

Similar articles

Cited by

References

    1. Assali A, Gaspar P, Rebsam A. Activity dependent mechanisms of visual map formation–from retinal waves to molecular regulators. Semin Cell Dev Biol. 2014;35:136–146. doi: 10.1016/j.semcdb.2014.08.008. - DOI - PubMed
    1. Rossi FM, et al. Requirement of the nicotinic acetylcholine receptor beta 2 subunit for the anatomical and functional development of the visual system. Proc Natl Acad Sci U S A. 2001;98:6453–6458. doi: 10.1073/pnas.101120998. - DOI - PMC - PubMed
    1. Rebsam A, Petros TJ, Mason CA. Switching retinogeniculate axon laterality leads to normal targeting but abnormal eye-specific segregation that is activity dependent. J Neurosci. 2009;29:14855–14863. doi: 10.1523/JNEUROSCI.3462-09.2009. - DOI - PMC - PubMed
    1. Pfeiffenberger C, et al. Ephrin-As and neural activity are required for eye-specific patterning during retinogeniculate mapping. Nat Neurosci. 2005;8:1022–1027. doi: 10.1038/nn1508. - DOI - PMC - PubMed
    1. Pfeiffenberger C, Yamada J, Feldheim DA. Ephrin-As and patterned retinal activity act together in the development of topographic maps in the primary visual system. J Neurosci. 2006;26:12873–12884. doi: 10.1523/JNEUROSCI.3595-06.2006. - DOI - PMC - PubMed

Publication types

MeSH terms

Substances

LinkOut - more resources