. 2017 Jun 12;7(1):3225.
doi: 10.1038/s41598-017-03336-1.

A translational approach to capture gait signatures of neurological disorders in mice and humans

Affiliations

A translational approach to capture gait signatures of neurological disorders in mice and humans

Lauren Broom et al. Sci Rep. .

Abstract

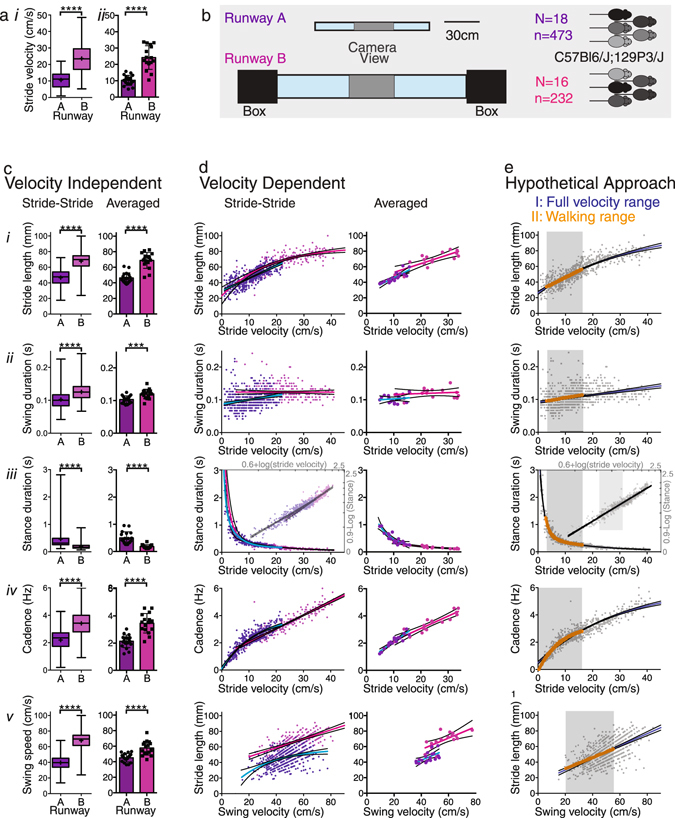
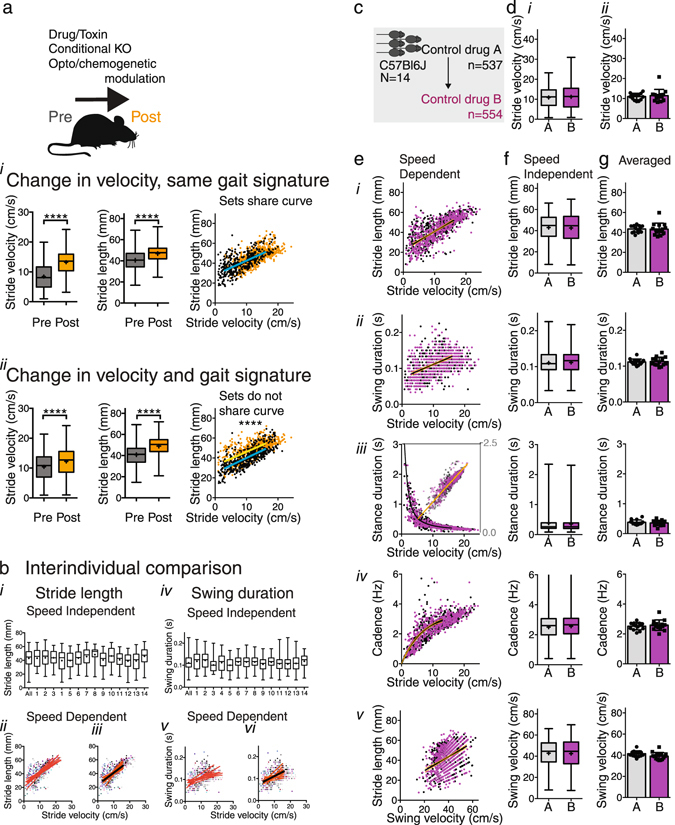
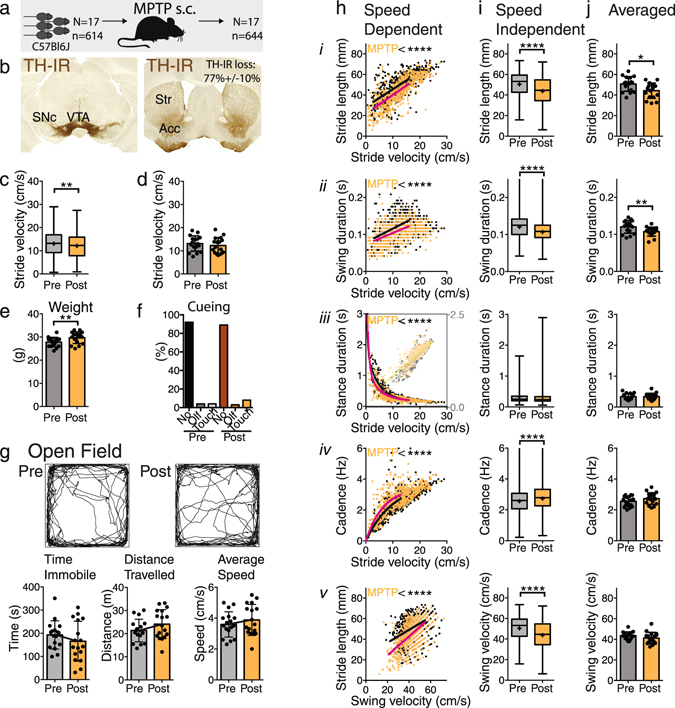
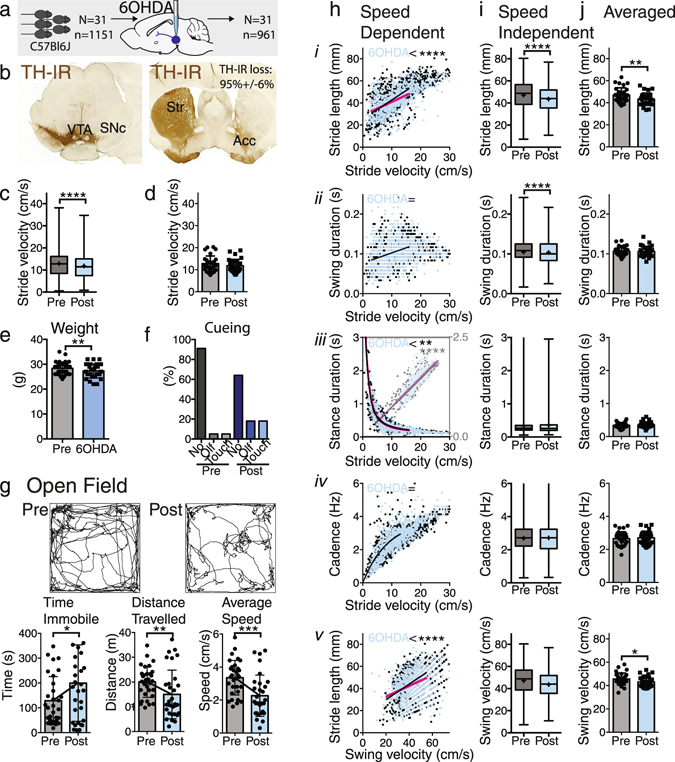
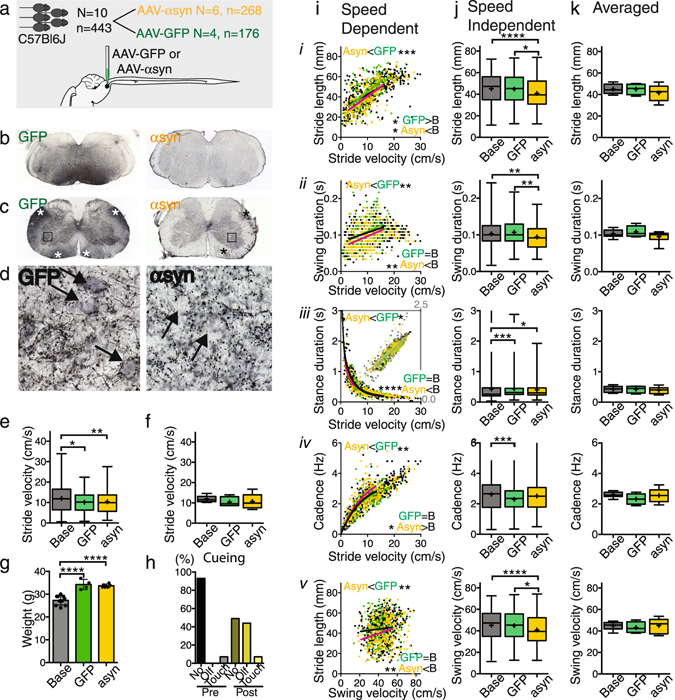
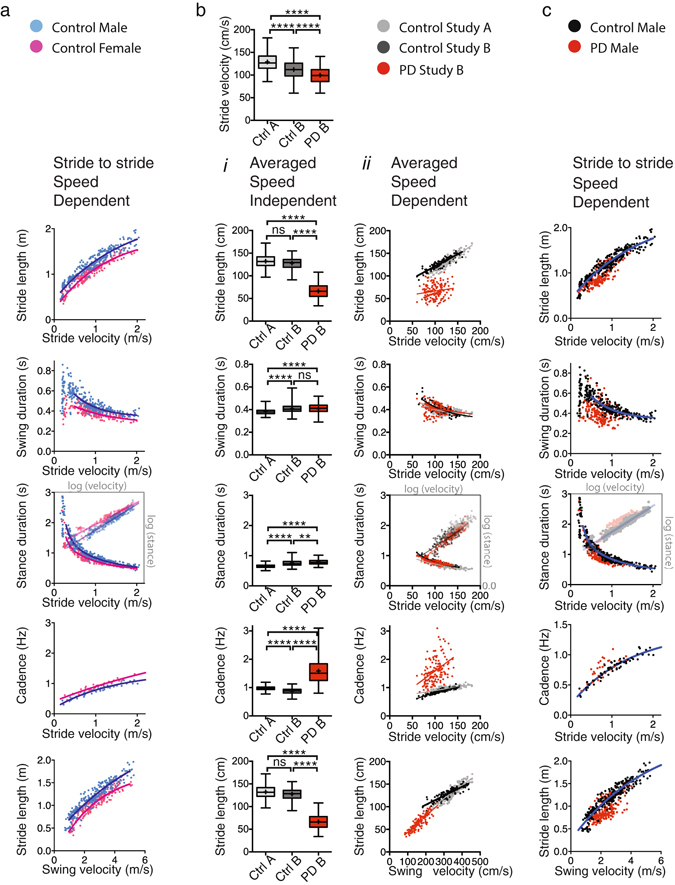
A method for capturing gait signatures in neurological conditions that allows comparison of human gait with animal models would be of great value in translational research. However, the velocity dependence of gait parameters and differences between quadruped and biped gait have made this comparison challenging. Here we present an approach that accounts for changes in velocity during walking and allows for translation across species. In mice, we represented spatial and temporal gait parameters as a function of velocity and established regression models that reproducibly capture the signatures of these relationships during walking. In experimental parkinsonism models, regression curves representing these relationships shifted from baseline, implicating changes in gait signatures, but with marked differences between models. Gait parameters in healthy human subjects followed similar strict velocity dependent relationships which were altered in Parkinson's patients in ways that resemble some but not all mouse models. This novel approach is suitable to quantify qualitative walking abnormalities related to CNS circuit dysfunction across species, identify appropriate animal models, and it provides important translational opportunities.


Conflict of interest statement

The authors declare that they have no competing interests.

Figures

Figure 1
Figure 1
Visualization of spatial and temporal gait parameters. (a) Box and whisker plots (i) showing the distribution and comparisons of stride-to-stride velocity data collected on Runways A and B (Mann Whitney Rank test; center representing median, center cross representing mean, bars representing minimum and maximum), and (ii) bar graphs with scatter plots of average stride velocity (2-tailed t-test; error bars indicate standard deviation). (b) Schematic representation of the dimensions of runways A and B. Video recordings covered the middle portion (gray shaded area). (c) Stride length (i), swing duration (ii), stance duration (iii), cadence (iv) and swing speed (iv) represented as stride-to-stride data in box and whisker plots and as averaged data in bar graphs with scatter plots. See Supplementary Table S3 for statistical test results. (d) Visualization of gait parameters plotted as a function of stride velocity. Each of the parameters behaves differently as a function of velocity, as illustrated by best fit non-linear regression curves (colored lines) and 95% confidence bands (black lines). Panel iii contains a log transformation of the stance data (opaque). (e) Example of how regression models capture stride-to-stride data of the full velocity range versus walking range (gray panels).
Figure 2
Figure 2
Regression analysis to compare gait datasets during walking. (a) Hypothetical datasets showing that regression analysis of stride-to-stride gait data in a velocity dependent manner enables assessment of whether one curve fits both baseline and post-interventional datasets. Changes in gait parameters due to velocity-related changes only do not lead to a shift in regression curve (i) whereas changes in gait quality with or without changes in velocity result in a change in slope or Y intercept of the regression curves (ii) representing a change in gait signature. Of note, this approach assumes that mice act as their own control or are compared to litter mates. (b) Comparison of gait parameters among individual animals within a cohort of C57Bl6/J adult males. i and iv: Whisker plots showing little variation between animals(i and iv). Ii-iii and v-vi: Data points (each animal depicted by a different color) and regression curves (orange) represent individual animals for the full velocity range (ii and v) and restricted range (iii and vi) as in Supplementary Table S2. Black curves represent the shared regression line. Note that regression lines overlap especially for the restricted range. (c) Gait parameters were measured in one cohort under 2 control conditions to validate reproducibility. (d) (i): Box and whisker plots show the distribution of stride-to-stride velocity (center representing median, center cross representing mean, bars representing minimum and maximum; Mann Whitney Rank test, Supplementary Table S3). (ii) bar graphs with scatter plots represent average stride velocity (2-tailed t-test), with error bars indicating standard deviation. (e) Relationships of stride length (i), swing duration (ii), stance duration (iii), and cadence (iv) as a function of stride velocity, and of stride length as a function of swing velocity (v) were captured with non-linear regression models (Supplementary Table S2). The fit of one curve to both data sets was compared with the fit of individual curves fit to each dataset (Supplementary Table S3). Orange lines represent 95% confidence intervals. (f) (i-v) and g (i-v): Stride-to-stride data represented as whisker plots (Mann Whitney Rank test, Supplementary Table S3; bars indicate maximum and minimum) and bar graphs with scatter plots represent averaged data (paired 2-tailed t-test, Supplementary Table S3; error bars indicate standard deviation).
Figure 3
Figure 3
Effects of MPTP treatment on gait. (a) In 17 C57Bl6 mice gait and locomotor activity was studied before and after s.c. MPTP treatment. (b) MPTP induced bilateral loss of tyrosine-hydroxylase immunoreactivity in the striatum. (c and d) Velocity was significantly lower post MPTP as determined by stride to stride data (Mann Whitney Rank test; Supplementary Table S3), but this was not detected in the averaged data sets (2-tailed paired t-test; Supplementary Table S3). (e) Post MPTP animals gained weight (paired, 2-tailed t-test). (f) Cueing was not necessary to obtain sufficient trials or data points. (g) Open field performance was not different pre and post MPTP treatment. (h) Relationships of stride length (i), swing duration (ii), stance duration (iii), cadence (iv) as a function of stride velocity and stride length as a function of swing speed (v). The fit of one curve to both data sets was compared with the fit of individual curves fit to each dataset. All gait parameters showed highly significant differences with shortened stride length, decreased swing and stance duration, and increased cadence (F test, Supplementary Table S3). (i) (i-v): The distribution of the stride-to-stride data showed significant differences in the same gait parameters as the speed dependent analysis, except for stance duration. However, these are difficult to interpret due to changes in velocity in the stride-to-stride data sets (Mann Whitney Rank test, Supplementary Table S3). (j) (i-v): Averaged data sets revealed decreased stride length and swing durations, but no changes in other gait parameters (paired 2 tailed t-test; Supplementary Table S3). Asterisks indicate level of significance.
Figure 4
Figure 4
Effects of 6-OHDA treatment on gait. (a) In 31 C57Bl6 mice gait and locomotor activity was studied before and after unilateral 6-OHDA injections into the substantia nigra. (b) Intranigral 6-OHDA induced unilateral loss of tyrosine-hydroxylase immunoreactivity in the ipsilateral striatum. (c and d) Velocity was significantly lower post 6-OHDA as determined by stride-to-stride data (Mann Whitney Rank test; Supplementary Table S3), but this was not detected in the averaged data sets (2-tailed paired t-test). (e) Three weeks following 6-OHDA, mice had lost weight (paired, 2-tailed t-test). (f) When collecting gait data, cueing was used in 40% of the trials. (g) Overall locomotor activity in the open field test was significantly reduced and animals spent more time immobile (paired, 2-tailed t-test; Supplementary Table S3). (h) Relationships of stride length (i), swing duration (ii), stance duration (iii), cadence (iv) as a function of stride velocity and stride length as a function of swing speed (v). The fit of one curve to both data sets was compared with the fit of individual curves fit to each dataset. Stride length and stride length as a function of swing speed showed highly significant differences (F test; Supplementary Table S3). (i) The distribution of stride-to-stride data showed significant differences for stride length (i) and swing duration (ii). However, these are difficult to interpret due to changes in velocity in stride-to-stride data sets (Mann Whitney Rank test; Supplementary Table S3). (j) Averaged data sets revealed decreased stride length (i) as a function of velocity or swing duration (ii), but no changes in other gait parameters (iii-v; paired 2 tailed t-test; Supplementary Table S3). Asterisks indicate level of significance.
Figure 5
Figure 5
Effects of brainstem alpha-synuclein overexpression on gait. (a) In C57Bl6 mice gait was studied before and after AAV-alpha-synuclein or AAV-GFP injections into the mPMRF. (b) Immunostaining for GFP (black) shows the injection site, whereas alpha-synuclein immunostaining was not present in cell bodies in the injected region. (c) GFP and alpha-synuclein labeled axons in the spinal cord. (d) Higher power photomicrographs showing abundant GFP and alpha-synuclein labeled bouton-like profiles in the ventral horn in close apposition to presumed motoneurons (arrows). (e) Velocity was significantly lower 18 weeks following GFP and alpha-synuclein injections, as determined by stride-to-stride data, but (f) this was not detected in the averaged data sets (Kruskal-Wallis rank test, followed by Dunn’s multiple comparison test; Supplementary Table S3). (g) Both in the GFP and alpha-synuclein group mice gained weight (Kruskal-Wallis rank test, followed by Dunn’s multiple comparison test; Supplementary Table S3). (h) When collecting gait data, cueing was used in 50% of the trials. (i) Relationships of stride length (i), swing duration (ii), stance duration (iii), cadence (iv) as a function of stride velocity and stride length as a function of swing speed (v). The fit of one curve to each pair of data sets was compared with the fit of individual curves (Supplementary Table S3). (j) The distribution of the stride-to-stride data showed similar patterns for stride length (i), swing duration (ii), and stride length as a function of swing speed (v; Kruskal-Wallis rank test, followed by Dunn’s multiple comparison test; Supplementary Table S3). (k) Averaged data sets revealed no differences (i-v; Mann Whitney Rank test; Supplementary Table S3). Asterisks indicate level of significance.
Figure 6
Figure 6
Gait parameters in human control subjects and subjects with Parkinson’s Disease. Spatial and temporal gait parameters depicted as a function of speed in human subjects can be represented by regression curves similar to mice, with regression curves shifting in the setting of CNS disease. (a) (i-v): Gait parameters visualized as a function of velocity in 14 control subjects without parkinsonism or cognitive decline follow non-linear relationships. Subjects were instructed to walk at velocities ranging from very slow to very fast. Except for cadence which was based upon trial average (iv), data points represent stride data of the left foot. Blue represents male and pink represent female data points. Data sets were not adjusted for other biometric or demographic factors. (b) (i-x): i-v, Velocity independent stride-to-stride analysis (whisker plots; Kruskal-Wallis, followed by Dunn’s multiple comparisons test; Supplementary Table S3) shows differences among most gait parameters, which are difficult to interpret given variations in velocity among cohorts. vi-x: Data points representing trial averages (from a baseline and a slower trial) in two different cohorts of control subjects (black and gray) and in PD subjects (red) from 2 previously published studies. (c) (i-v): Data points representing stride-to-stride data (from 6 trials capturing very slow to very fast speeds) in gender and age matched control subjects (black) and PD subjects (red). Asterisks indicate level of significance.

References

    1. Giladi N, Horak FB, Hausdorff JM. Classification of gait disturbances: distinguishing between continuous and episodic changes. Mov Disord. 2013;28:1469–1473. doi: 10.1002/mds.25672. - DOI - PMC - PubMed
    1. Nutt JG, et al. Freezing of gait: moving forward on a mysterious clinical phenomenon. Lancet Neurol. 2011;10:734–744. doi: 10.1016/S1474-4422(11)70143-0. - DOI - PMC - PubMed
    1. Frenkel-Toledo S, et al. Effect of gait speed on gait rhythmicity in Parkinson’s disease: variability of stride time and swing time respond differently. J Neuroeng Rehabil. 2005;2:23. doi: 10.1186/1743-0003-2-23. - DOI - PMC - PubMed
    1. Yogev G, et al. Dual tasking, gait rhythmicity, and Parkinson’s disease: which aspects of gait are attention demanding? Eur J Neurosci. 2005;22:1248–1256. doi: 10.1111/j.1460-9568.2005.04298.x. - DOI - PubMed
    1. Snijders AH, et al. Gait-related cerebral alterations in patients with Parkinson’s disease with freezing of gait. Brain. 2011;134:59–72. doi: 10.1093/brain/awq324. - DOI - PubMed

Publication types

MeSH terms