. 2017 Jun 13:8:15803.
doi: 10.1038/ncomms15803.

Precocious centriole disengagement and centrosome fragmentation induced by mitotic delay

Affiliations

Precocious centriole disengagement and centrosome fragmentation induced by mitotic delay

Menuka Karki et al. Nat Commun. .

Abstract

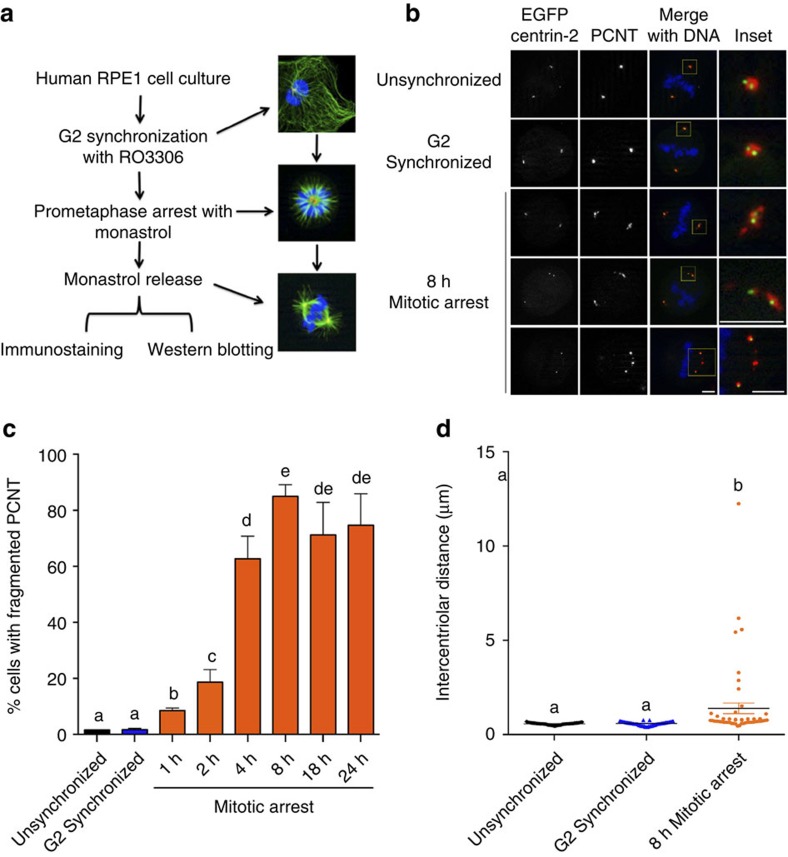
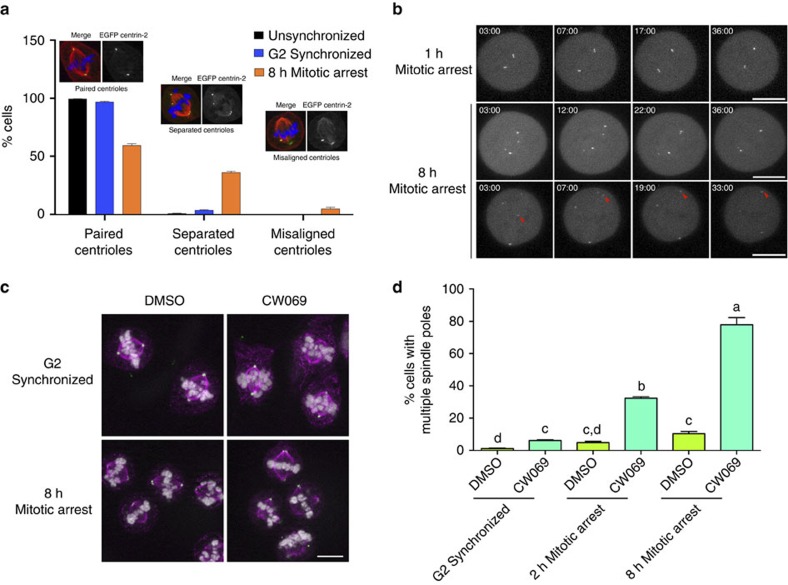
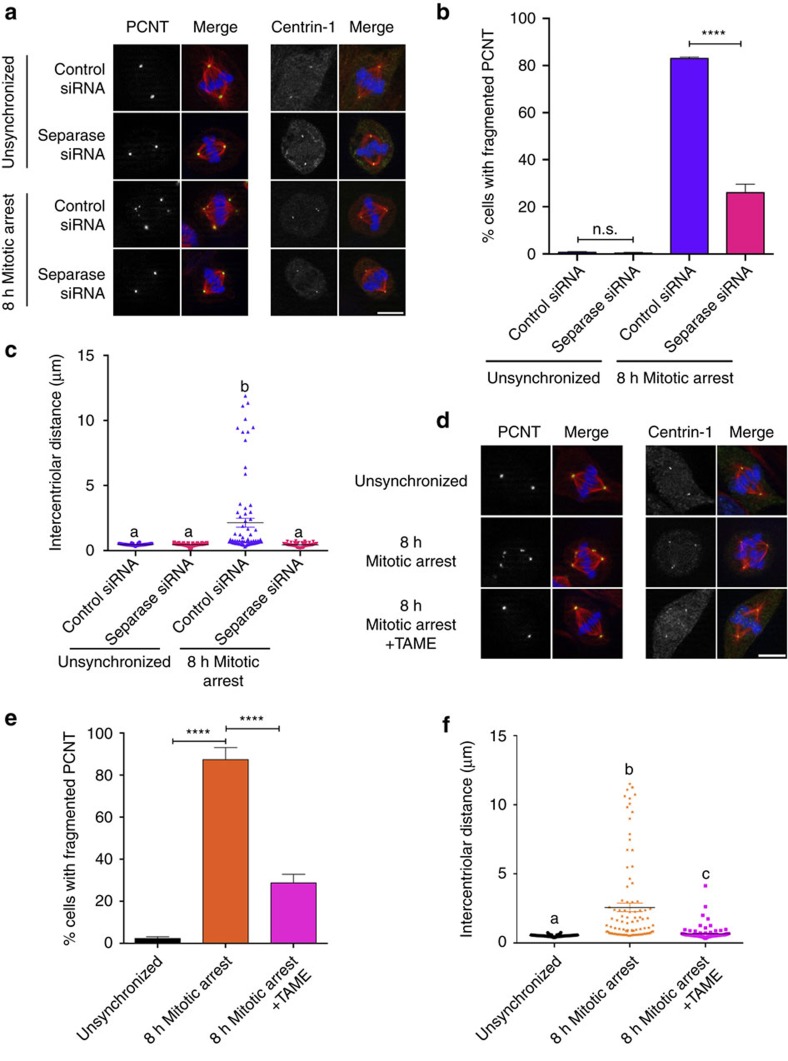
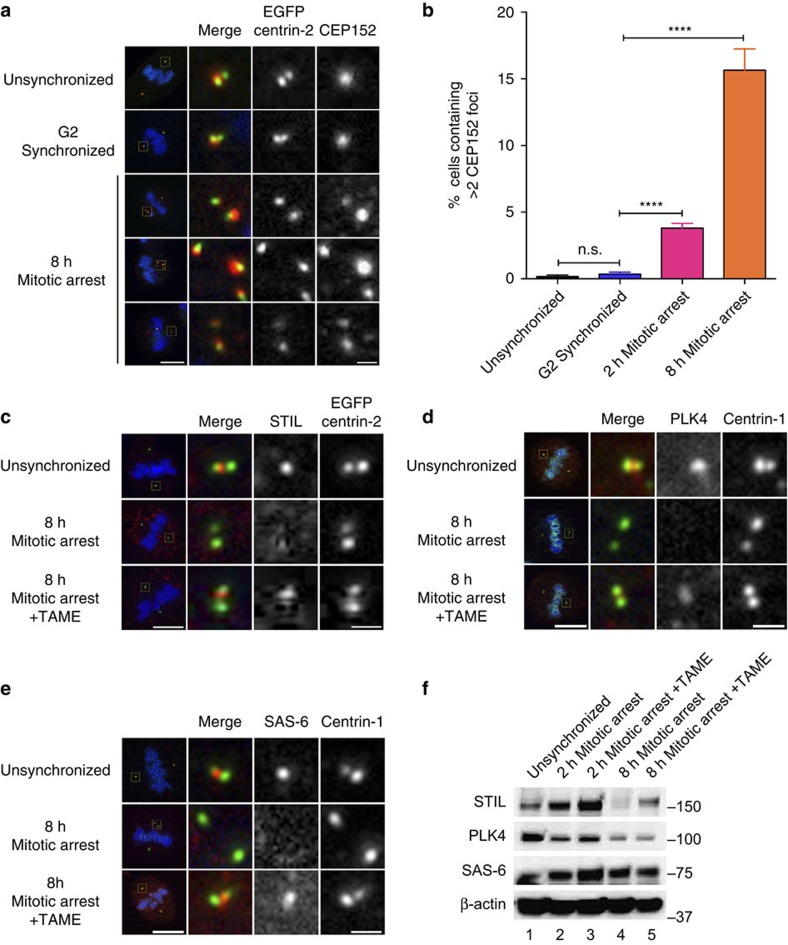
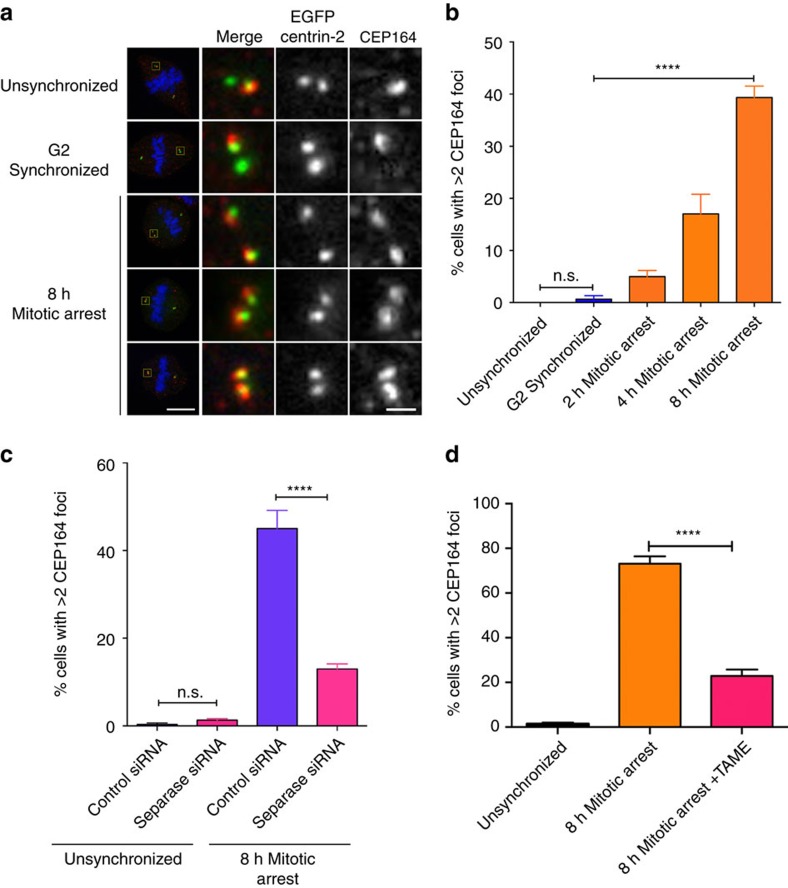
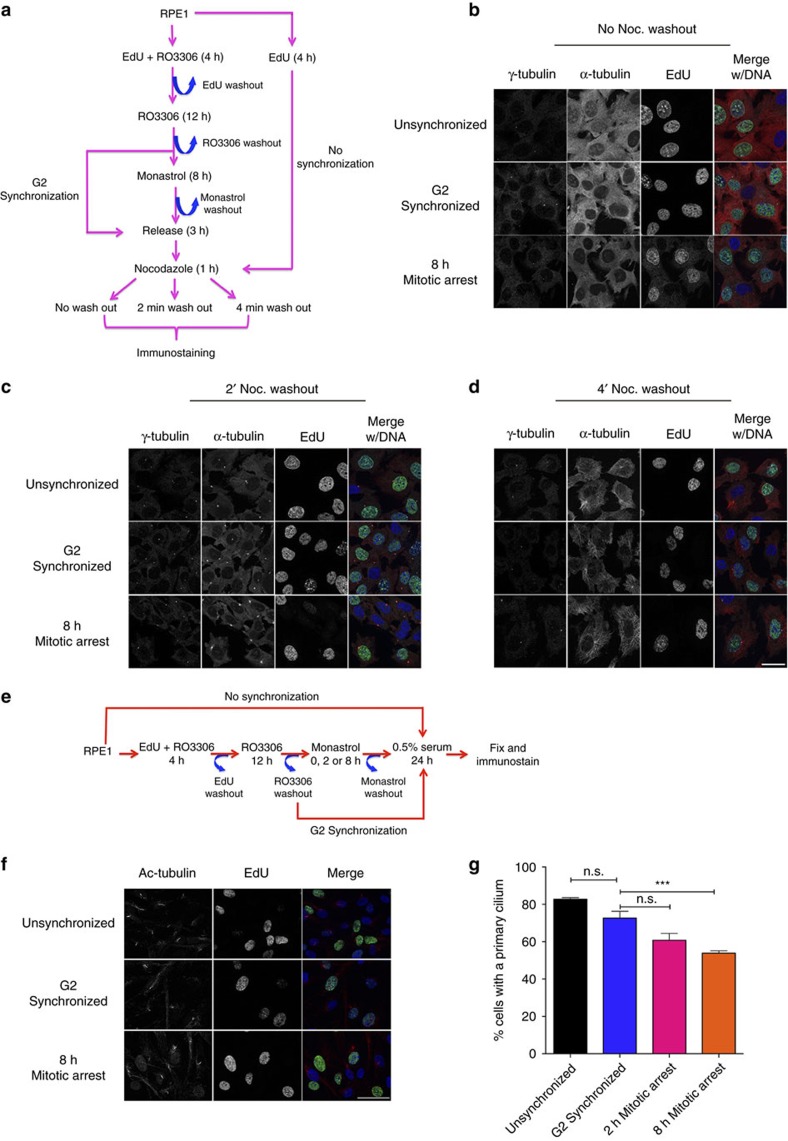
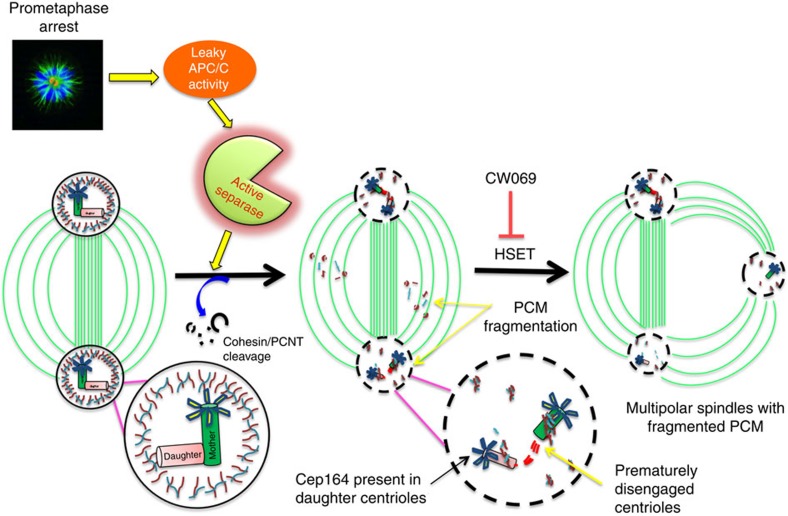
The spindle assembly checkpoint (SAC) delays mitotic progression until all sister chromatid pairs achieve bi-orientation, and while the SAC can maintain mitotic arrest for extended periods, moderate delays in mitotic progression have significant effects on the resulting daughter cells. Here we show that when retinal-pigmented epithelial (RPE1) cells experience mitotic delay, there is a time-dependent increase in centrosome fragmentation and centriole disengagement. While most cells with disengaged centrioles maintain spindle bipolarity, clustering of disengaged centrioles requires the kinesin-14, HSET. Centrosome fragmentation and precocious centriole disengagement depend on separase and anaphase-promoting complex/cyclosome (APC/C) activity, which also triggers the acquisition of distal appendage markers on daughter centrioles and the loss of procentriolar markers. Together, these results suggest that moderate delays in mitotic progression trigger the initiation of centriole licensing through centriole disengagement, at which point the ability to maintain spindle bipolarity becomes a function of HSET-mediated spindle pole clustering.


Conflict of interest statement

The authors declare no competing financial interests.

Figures

Figure 1
Figure 1. Moderate mitotic delay induces centriole disengagement and centrosome fragmentation.
(a) Experimental design. G2-arrested RPE1 cells were either allowed to directly progress into M phase or were treated with monastrol for varying times before being released from prometaphase arrest for 30 min to permit spindle assembly. (b) Cells transiently transfected with eGFP centrin-2 (green), and probed for PCNT (red) and DNA (blue). PCM fragmentation could be observed in both widely separated as well as closely associated centriole pairs (bottom three rows). Scale bar, 5 μm. (c) Quantification of PCM fragmentation, with error bars representing s.e.m. from four replicate experiments, 300 mitotic cells scored per condition per experiment. Significant differences were calculated for each comparison using a non-parametric Kruskal–Wallis test (P<0.05), and significant differences between samples were indicated with different lower-case letters. (d) Quantification of intercentriolar distances of a representative experiment with error bars representing s.e.m., 51 centriole pairs measured per condition. Results for all three experimental replicates are shown in Supplementary Fig. 1g. Statistical differences were calculated as described for c.
Figure 2
Figure 2. Spindle pole integrity and spindle bipolarity following mitotic delay is maintained by HSET-mediated centriole clustering.
(a) Representative phenotypes observed for centriole pairs in unsychronized, G2-synchronized and prometaphase-arrested cells. Error bars represent s.e.m. for three replicate experiments, with 300 cells scored per condition per experiment. (b) 4D time-lapse microscopy of eGFP centrin-2-expressing cells following monastrol washout to allow bipolar spindle assembly. Image stacks were acquired every minute, beginning ∼3 min following monastrol washout. Red arrow denotes the long-distance clustering of an individual centriole. Scale bar, 10 μm. Also see Supplementary Movies 1–3. (c) G2-synchronized or 8 h mitotically arrested RPE1 cells were allowed to progress into metaphase for 30 min in the presence of 0.1% DMSO or 350 μM CW069 (HSET inhibitor), and then fixed and probed for α-tubulin (magenta), PCNT (green) and DNA (white). Scale bar, 10 μm. (d) Quantification of the frequency of multipolar spindles. Error bars represent s.e.m. from three experimental replicates, with 300 cells scored per condition per experiment. Data were arcsin-square root transformed to achieve a normal distribution. A two-factor ANOVA was performed with a Tukey–Kramer post hoc test to discern differences among individual means, with significant differences indicated with different lower-case letters.
Figure 3
Figure 3. Leaky APC/C and separase activity drives centrosome fragmentation and premature centriole disengagement during mitotic delay.
(ac) RPE1 cells were transfected with indicated siRNA for 48 h before synchronization and prometaphase arrest. Cells were then fixed and probed for centrin-1 (green), PCNT (green), tubulin (red) and DNA (blue) localization (a). Scale bar, 10 μm. (b) Quantification of PCM fragmentation, error bars represent s.e.m. from three replicate experiments, 250 cells scored per condition per experiment. (c) Quantification of intercentriolar distances of a representative experiment with error bars representing s.e.m., 80 centriole pairs measured per condition. Results for all three experimental replicates are shown in Supplementary Fig. 2d. (df) RPE1 cells were either left unsynchronized or G2-synchronized and released into monastrol for 8 h in the absence or presence of 3 mM TAME. Cells were then fixed, processed for PCNT and centrin-1 localization, and phenotypes were quantified as shown in b,c. Panel f depicts a representative experiment of 98 centriole pairs scored per condition, with results for all three experimental replicates shown in Supplementary Fig. 2e. For b,e, significance was determined by one-way ANOVA with Tukey–Kramer post hoc test, ****P≤0.0001. For c,f, significant differences were calculated for each comparison using a non-parametric Kruskal–Wallis test (P<0.05), and significant differences between samples were indicated with different lower-case letters.
Figure 4
Figure 4. Loss of procentriolar markers during mitotic delay.
(a) CEP152/Asl localization in unsynchronized, G2-synchronized and cells subjected to mitotic delay. Lower left bar, 10 μm; Lower right bar, 1 μm. (b) Quantification of CEP152/Asl foci. Error bars represent s.e.m. for three replicate experiments, 300 cells scored per condition per experiment, with significance determined by one-way ANOVA with Tukey–Kramer post hoc test, ****P≤0.0001. (ce) Mitotic cells from unsynchronized cultures, or 8 h of mitotic arrest in the absence or presence of TAME. Cells were then fixed and probed for the presence of STIL (c), PLK4 (d) or SAS-6 (e). Lower left bars, 10 μm; Lower right bars, 1 μm. (f) Total protein levels of procentriole markers in cells treated in the conditions shown in ce. See Supplementary Fig. 4 for quantification.
Figure 5
Figure 5. Effects of mitotic delay on daughter centriole maturation.
(a,b) RPE1 cells expressing eGFP centrin-2 and probed for CEP164 in unsynchronized, G2-synchronized and mitotically arrested cells. Lower left bar, 10 μm. Lower right bar, 1 μm. (b) Quantification of multiple CEP164 foci from experiments illustrated in a. Error bars represent s.e.m. for three replicate experiments, 300 cells scored per condition. (c) Quantification of CEP164 foci in cells transfected with control or separase siRNA followed by prometaphase arrest. Error bars represent s.e.m. for three replicate experiments, 300 cells scored per condition per experiment. (d) Quantification of CEP164 foci in cells subjected to APC/C inhibition during prometaphase arrest. Error bars represent s.e.m. for six replicate experiments, 300 cells scored per condition per experiment. For bd, significance was determined by one-way ANOVA with Tukey–Kramer post hoc test, ****P≤0.0001.
Figure 6
Figure 6. Centrosome function following mitotic arrest.
(a) Experimental design for microtubule regrowth assay. Unsynchronized cultures were treated with 10 μM EdU for 4 h and cultured for an additional 20 h. Alternatively, cells were treated with R03306 for 16 h to achieve G2 synchronization, and during the first 4 h of R03306 treatment, cells were pulsed with EdU. G2-synchronized or mitotically delayed cells were allowed 3 h to complete cell division. For all conditions, cultures were treated with 5 μM nocodazole for 1 h. Cells were then either fixed or washed free of nocodazole for 2–4 min before fixation to allow microtubule nucleation. Cells were then processed for EdU detection (green) and probed for γ-tubulin (cyan), α-tubulin (red) and DNA (blue). (bd) Representative images of cells fixed either before nocodazole washout (b) or following washout for 2 min (c) or 4 min (d). Scale bar, 25 μm. (e) Experimental design. Cells were treated with 10 μM EdU for 4 h and then fixed 24 h later. Alternatively, cells were treated with R03306 for 16 h to achieve G2 synchronization, and were pulsed with EdU during the first 4 h of treatment. G2-synchronized cells were then either permitted to progress through cell division or delayed in mitosis for 8 h. For all conditions, cells were then serum starved following mitosis to induce primary cilia formation. (f) Presence of primary cilium (red) in cells that incorporated EdU (green). Scale bar, 50 μm. (g) Quantification of primary cilium in EdU-labelled cells. Error bars represent s.e.m. from three replicate experiments, 500 cells scored per condition per experiment. Significance was determined by one-way ANOVA with Tukey–Kramer post hoc test, ***P≤0.001.
Figure 7
Figure 7. Proposed model for centriole disengagement during mitotic delay.
RPE1 cells delayed in mitosis experience leaky activation of the anaphase-promoting complex. Low-level APC/C activity mediates separase activation, thus allowing for cleavage of PCNT and cohesin. Although centriole pairs are prematurely disengaged, the centrosome integrity and spindle bipolarity is maintained by HSET.

Similar articles

Cited by

References

    1. Musacchio A. & Hardwick K. G. The spindle checkpoint: structural insights into dynamic signalling. Nat. Rev. Mol. Cell Biol. 3, 731–741 (2002). - PubMed
    1. Gascoigne K. E. & Taylor S. S. Cancer cells display profound intra- and interline variation following prolonged exposure to antimitotic drugs. Cancer Cell 14, 111–122 (2008). - PubMed
    1. Orth J. D. et al.. Analysis of mitosis and antimitotic drug responses in tumors by in vivo microscopy and single-cell pharmacodynamics. Cancer Res. 71, 4608–4616 (2011). - PMC - PubMed
    1. Brito D. A. & Rieder C. L. Mitotic checkpoint slippage in humans occurs via cyclin B destruction in the presence of an active checkpoint. Curr. Biol. 16, 1194–1200 (2006). - PMC - PubMed
    1. Daum J. R. et al.. Cohesion fatigue induces chromatid separation in cells delayed at metaphase. Curr. Biol. 21, 1018–1024 (2011). - PMC - PubMed

Publication types