. 2017 Jun 15;546(7658):416-420.
doi: 10.1038/nature22812. Epub 2017 Jun 7.

Principles of early human development and germ cell program from conserved model systems

Affiliations

Principles of early human development and germ cell program from conserved model systems

Toshihiro Kobayashi et al. Nature. .

Abstract

Human primordial germ cells (hPGCs), the precursors of sperm and eggs, originate during weeks 2-3 of early post-implantation development. Using in vitro models of hPGC induction, recent studies have suggested that there are marked mechanistic differences in the specification of human and mouse PGCs. This may be due in part to the divergence in their pluripotency networks and early post-implantation development. As early human embryos are not accessible for direct study, we considered alternatives including porcine embryos that, as in humans, develop as bilaminar embryonic discs. Here we show that porcine PGCs originate from the posterior pre-primitive-streak competent epiblast by sequential upregulation of SOX17 and BLIMP1 in response to WNT and BMP signalling. We use this model together with human and monkey in vitro models simulating peri-gastrulation development to show the conserved principles of epiblast development for competency for primordial germ cell fate. This process is followed by initiation of the epigenetic program and regulated by a balanced SOX17-BLIMP1 gene dosage. Our combinatorial approach using human, porcine and monkey in vivo and in vitro models provides synthetic insights into early human development.


Figures
Extended Data Fig.1
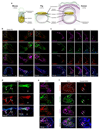
Extended Data Fig.1. Expression of key germ cell genes in early pPGCs.
a. Representation of a mouse, pig and human embryos before gastrulation b. Sections of Early-PS and PS stage embryo showing SOX17, BLIMP1, NANOG and OCT4. Yellow dashed insets show cells at high magnification and white dashed lines mark SOX17 +ve and/or BLIMP1 -ve cells. Scale bar: 20 µm. c. PS (~E12) stage embryo with a cluster of pPGCs (arrow) with multiple combinations of PGC gene expression (SOX17, BLIMP1, NANOG, TFAP2C, OCT-4, Sda/GM2 and mesoderm gene, T). Arrowheads at the anterior streak point to primitive endoderm (SOX17/BLIMP1+ve and NANOG negative cells. Scale bar: 20 μm. d. Late-PS; (~E12.5-E13.5) embryo with a pPGC cluster (arrow) showing NANOG, SOX17 (split color image of Fig.1e), BLIMP1, and T expression. Arrowheads mark early migratory PGCs in the primitive endoderm. Scale bar: 25 µm. e. E14 embryo stained for SOX17, BLIMP1, and TFAP2C. Yellow dashed insets show cells at high magnification and white dashed lines mark SOX17/BLIMP1 +ve and TFAP2C -ve cells. Scale bar: 20 µm. f. Immunostaining for PRDM14 co stained with Sda/GM2 and SOX17 in E14 (pPGC cluster) embryos and E26 gonads. Arrows point to pPGCs in the gonad. Scale bar: Scale bar: 20 µm.
Extended Data Fig.2
Extended Data Fig.2. Proliferation and development of early pPGCs.
a. OCT4 RNA in situ hybridization identifies the pPGC cluster (arrow) in the posterior end of ~E13.5-E15.5 embryos. Insets show whole embryos. b. Wholemount OCT4 IHC of a porcine embryo. Dashed square marks the area shown at higher magnification on the top right. Arrow points to the pPGC cluster. Bottom right: Cross section of the embryo (line in the wholemount image) shows migratory pPGCs (red cells). c. Number of pPGCs at different stages as indicated. d. Immunostaining of EdU labelled embryos at the indicated stages with different antibody combinations identifying the PGCs. The pPGC cluster is highlighted with dashed white line. Arrows show SOX17/EdU +ve and SOX17/BLIMP1/EdU +ve cells. Scale Bar: 20 μm. e. Immunostained migratory pPGCs (arrows); inset show cells at higher magnification. f. Immunostained gonadal pPGCs.
Extended Data Fig.3
Extended Data Fig.3. Epigenetic reprogramming in pre- and early migratory pPGCs, and key germ cell markers in migratory pPGC and cultured porcine epiblast.
a. A cluster of pPGCs (dashed line) at ~E13 stained for TET1 and OCT4. Scale bar: 20 µm. b. Serial sections of E14 embryos immunostained for different epigenetic markers combined with BLIMP1, NANOG and SOX17. Dashed lines highlight pPGC clusters. Scale bar: 20 µm. c. Quantification of 5mC and H3M9me2 in embryos of different stages. Numbers of cells analyzed are indicated. (* p<0.01; Mann-Whitney test) ). d. Serial sections of ~E16 embryos showing migratory pPGCs immunostained for the indicated epigenetic marks. Scale bar: 20 µm. e. Triple immunostaining of epiblasts cultured under different conditions. Scale bar: 10 μm.
Extended Data Fig.4
Extended Data Fig.4. Characterization of NANOS3-tdTomato (NT) reporter hPSC
a. Targeting strategy for making NANOS3-tdTomato reporter. b. Representative genotyping of targeted clones using genomic DNA. c. Conventional (Conv) and PGC-competent (Comp) hPSCs states are reversible; the latter is equivalent to Pre-ME (12h at ME induction). Conv-hPSCs are cultured in Essential 8 medium on vitronectin coated dishes (see Methods). Comp-hPSCs are cultured in the hPSC medium containing inhibitor(i)s (GSK3i, ERKi, p38i, JNKi) on MEF (see Methods). d. NT reporter Conv- and Comp-hPSC, and day 1-4 embryoids induced with or without Cytokines. e. FACS pattern and % NT/AP +ve cells shown in Extended Data Fig. 4d. f. FACS pattern and % NT/AP +ve cells in multiple clones derived from Wis2 or H9 hESC lines. g. Immunostaining of day 4 embryoids induced from Pre-ME(12h) or Comp-hPSC by BMP containing cytokines. Scale bar: 50 µm. h. Comparison of sensitivity of 2 NANOS3 reporter cell lines. FACS patterns of day 4 embryoids induced from Comp-hPSC (harboring NANOS3-mCherry reporter or NANOS3-tdTomato reporter) with or without Cytokines. i. Comparison of hPGC induction efficiency derived from Pre-ME(12h) or Comp-hPSC. Representative images and FACS patterns are shown. j. Scatter plot shows % NT/AP +ve cells in indicated condition (n=6). Paired T-test was used to test for statistical significance (* p<0.05)
Extended Data Fig.5
Extended Data Fig.5. Characterization of Pre-ME and ME induced from Conv-hPSC
a. Immunostaining of Conv-hPSCs during 12–24h ME induction. Scale bar: 50 μm. b. Gene expression (RT-qPCR) change during ME induction. c. FACS patterns of day 4 embryoids induced from Pre-ME(12h) with cytokines. Pre-ME was induced with or without GSK3i or Activin A. d. FACS patterns of day 4 embryoids induced from Pre-ME(12h) with cytokines. Pre-ME was induced with or without BMP2 or the inhibitor. e. Schematics of DE or lateral mesoderm (LM) differentiation from ME f. FACS patterns of day 2 DE (% CXCR4 +ve) and day 1 LM (% PDGFRa +ve) induced from 24h of ME induction. g. Relative induction efficiency of DE or LM from ME induced with or without BMP2 (DE: n=5, LM: n=6). Paired T-test was used to test for statistical significance (* p<0.05) h. Immunostaining of DE and LM in Extended Data Fig.5f. Scale bar: 50 µm. i. Schematic of spatial-temporal progression from Conv-hPSC to ME and the signaling.
Extended Data Fig.6
Extended Data Fig.6. Robust induction of cynomolgus monkey PGC (cmPGC) from cells during ME differentiation
a. Schematics of in vitro differentiation of cmPSC. The same system was adopted as shown for Conv-hPSC differentiation in Fig.3. b. Bright field Image of undifferentiated cmPSC. c. Immunostaining of day 2 embryoids induced with Cytokines from cells at 0h (=cmPSC), 12h and 24h during ME differentiation. Dashed lines highlight SOX17/BLIMP1/TFAP2C +ve cmPGCs. Scale bar: 50 µm. d. Immunostaining of day 2 Pre-ME(12h)-derived embryoids in Extended Data Fig. 6c for pluripotency markers. Notably, cmPGCs express SOX17 but not SOX2. In contrast, cmPSC colonies express SOX2 but not SOX17. e. Immunostaining of day 2 cmDE induced from Pre-ME(12h) and ME(24h). Scale bar: 50 µm. f. Immunostaining of day1 cmLM induced from ME(24h). ME were induced with or without BMP. Notably, adding BMP during ME differentiation increased the efficiency for FOXF1/HAND1 +ve LM cells, as shown in Conv-hPSC (Extended Data Fig. 5e-i) Scale bar: 50 µm.
Extended Data Fig.7
Extended Data Fig.7. Chronology of transcription factors expression during hPGC induction
a. Schematic of hPGC induction from Pre-ME(12h). b. Images of day 2 and 4 embryoids in response to BMP2 alone or BMP2 with LIF, SCF and EGF(=Cytokines). Notably, BMP2 alone can induce hPGC at almost the same efficiency as the full cytokines, but do not survive during extended culture, as shown previously. c. Immunostaining of embryoids induced with BMP2 alone or BMP2 with LIF, SCF and EGF showing expression of SOX17, BLIMP1 and TFAP2C. Scale bar: 50 µm. d. Proportion of SOX17 +ve cells indicated in Extended Data Fig.7c. e. Immunostaining of embryoids induced with BMP2 alone or BMP2 with LIF, SCF and EGF showing expression of SOX17, BLIMP1 and NANOG. Scale bar: 50 µm. f. Proportion of SOX17+ve cells in Extended Data Fig.7e.
Extended Data Fig.8
Extended Data Fig.8. Effect of NANOG on hPGC induction, characterization of NANOS3-tdTomato reporter hPSC containing inducible SOX17, BLIMP1 with or without TFAP2C, and similarity between Cytokine- and SOX17/BLIMP1-induced hPGC
a. Represents overexpression of Dex-inducible NANOG transgenes in NT reporter Comp-hPSC. b. Day4 embryoids following induction of NANOG (by Dex), with or without cytokines as indicated. c. FACS patterns after induction of hPGCs; NT/AP +ve cells (%) shown in Extended Data Fig. 8b. d. Represents overexpression of Dex-inducible SOX17, Dox-inducible BLIMP1, Shield1(S1)-inducible TFAP2C transgenes in NT reporter Comp-hPSC. e. Immunostaining of NT reporter Comp-hPSC +iSBT 1 day after induction of SOX17, BLIMP1 and TFAP2C by addition of Dex, Dox or S1. Scale bar: 50 µm. f. Immunostaining of NT reporter Comp-hPSC +iSB 1 day after induction of SOX17 or BLIMP1 by addition of Dex or Dox. Scale bar: 50 µm. g. Immunostaining of day 2 embyroid induced with or without Dex to induce nuclear localization of SOX17. Notably, accumulation of SOX17 signal is observed in +Dex condition. h. Changes in gene expression (RT-qPCR) during hPGC induction: Comp-hPSCs control (AP +ve cells); NT +ve hPGCs induced by SOX17/BLIMP1 or Cytokines; NT -ve cells in cells exposed to Cytokines. i. Unsupervised hierarchical clustering (UHC) of gene expression. j. Gene set enrichment analysis (GSEA) of 123 hPGC-specific genes (Supplementary Table 1) on the transcriptome of cytokine- and SOX17/BLIMP1-induced hPGCs. k. Heat map showing expression of epigenetic modifiers related to global DNA demethylation. Same datasets as shown in Fig. 4e were used for analysis.
Extended Data Fig.9
Extended Data Fig.9. Response of SOX17 KO Comp-hPSC to SOX17
a. Overexpression of Dex-inducible SOX17 (iS) in SOX17 KO Comp-hPSC. b. Gene expression (RT-qPCR) on day 4 of FACS-sorted NANOS3-mCherry (NC)/Alkaline phosphatase (AP) +ve hPGCs by RT-qPCR. c. FACS analysis of d2 embryoids induced from WT Comp-hPSC, SOX17 KO Comp-hPSC and SOX17KO Comp-hPSC rescued with SOX17GR transgene (iS) (% CXCR4/AP+ cells). d. FACS pattern of day 2 embyoid induced from NT reporter Comp-hPSC showing AP/CXCR4 +ve cells expressing NT. e. Represents SOX17 inducible system (iSdd). Expression of SOX17 fused with destabilized domain (DD) can be induced by Doxycycline (Dox); addition of Shield1 (S1) can stabilize SOX17-DD protein. f. Western blots showing SOX17 expression level in day 5 embryoids from SOX17KO+iSdd Comp-hPSC. Embryoids were induced with Cytokines. To induce SOX17, different concentration of Dox and S1 were added. As controls, NC/AP +ve hPGCs and NC/AP -ve cells from WT Comp-hPSC-derived embryoids induced with Cytokines were used. Histone H3 (H3) was used for internal control. g. Immunostaining of day 4 embryoids from SOX17KO+iSdd Comp-hPSC. Embryoids from SOX17 KO and WT Comp-hPSC induced with Cytokines were used as controls. Scale bar: 50 μm. h. Quantification of immunostaining data in Extended Data Fig. 9g. The numbers of OCT4/BLIMP1 +ve hPGCs, FOXA2 +ve endodermal cells and OCT4/BLIMP1 +ve hPGCs expressing FOXA2 were counted from 3 different embryoids. The proportions of the 3 populations are shown. i. Expression of SOX17 and BLIMP1 (RT-qPCR) in d4 embyoids in response to different SOX17 dosage.
Extended Data Fig.10
Extended Data Fig.10. Response of SOX17 KO Comp-hPSC to SOX17 and BLIMP1, and changes in epigenetic modifier expression after overexpression of SOX17/BLIMP1
a. Overexpression of Dex-inducible SOX17 (iS) and Dox-inducible BLIMP1 (iB) in SOX17 KO Comp-hPSC. b. Immunostaining of Comp-hPSC 1 day after induction of SOX17 (Dex) or BLIMP1 (Dox), or both, and d2 embryoids following Dex-induced SOX17 with endogenous or Dox-induced BLIMP1. Scale bar: 50 μm. c. Gene expression (RT-qPCR) in day 4 embryoids following induction by Dex (+SOX17), Dox (+BLIMP1), or Dex+Dox (+SOX17/BLIMP1). Bulk cells of embryoids induced from SOX17 KO and WT Comp-hPSC with Cytokines were used as controls. d. Upon specification, hPGCs become refractory to Activin or Wnt signaling. Left schematic shows the experimental design. The embryoids were transferred to the medium with or without GSK3i (3μM) or ActivinA (100ng/ml) at day 0, 1 or 2 to see the effect on PGC induction. FACS patterns (right) show the induction efficiency of hPGC (%; NT/AP +ve) at day 4. e. Day4 embryoids induced by cytokines with or without ActivinA or GSK3i.
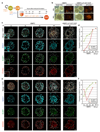
Fig.1
Fig.1. Specification of PGCs in gastrulating porcine embryos
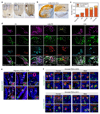
Serial sections with immunostainings: a. Bilaminar disc embryo (~E9.5-E10); Arrowhead marks the epiblast/trophectoderm boundary. Scale bar: 20 µm. b. Pre-primitive streak embryo (Pre-PS; ~E11). Scale bar: 10 µm. c. Early primitive streak embryo (Early-PS; ~E11.5-E12) with SOX17 and BLIMP1 expression. Close-up (dashed lines) shows four SOX17 +ve and BLIMP1 -ve cells (arrows). Dashed lines highlight SOX17/BLIMP +ve cells. The hypoblast is SOX17/BLIMP1 +ve. Scale bar: 10 µm. d. Primitive streak embryo (PS; ~E12) with a pPGC cluster showing SOX17 and NANOG expression. Four SOX17 +ve cells without NANOG in the most anterior pPGC cluster (arrows in middle image). The right most image (arrows) point to five SOX17 +ve and BLIMP1 -ve cells. Arrowheads show anterior PS with SOX17 +ve definitive endoderm cells. Dashed lines highlight SOX17/BLIMP +ve cells. Scale bar: 10 µm. Inset shows the whole embryo. e. Late primitive streak embryo (Late-PS; ~E12.5-E13.5) with a pPGC cluster (arrow) showing NANOG, SOX17, TFAP2C, BLIMP1, T and Sda/GM2 expression. Arrowheads: early migratory pPGCs. Scale bar: 25 µm. A<–>P; anterior-posterior axis f. Quantification of EdU incorporation in pPGCs and somatic cells. Numbers denote analyzed cells. g. Sagittal section of E14.5 embryo immunostained for OCT4 and 5hmC, and the pPGC cluster (white square). Arrows: migratory PGCs. Scale bar: 20 μm. h. Quantification of 5hmC.in analyzed cells. (Mann-Whitney: * p<0.01). i. Immunostaining for UHRF1 in E14 embryos. Dashed line delimits the pPGC cluster. Scale bar: 20 μm.
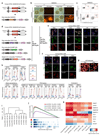
Fig.2
Fig.2. Competence for pPGC specification
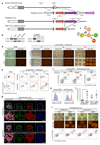
a. Representation of porcine epiblasts and signaling for pPGC induction. b. Dissected epiblasts. Scale bar: 0.25 mm. c. Serial sections of a Pre-PS embryo showing pSMAD1/5/8 and T. Close-up (dashed lines) of posterior epiblast cells (arrows) with nuclear pSMAD but no T. Scale bar: 20 μm. d. Epiblasts culture for 64 h. e. Epiblasts prior to culture. Scale bar: 0.5mm. f. Epiblasts after 64 h culture. g. Scatter plot for the triple positive pPGCs staining. h. Triple immunostaining of epiblasts. Scale bar: 20 μm. WNTi (WNT inhibitor); BMPi (BMP inhibitor)
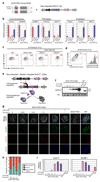
Fig.3
Fig.3. Simulating of human peri-gastrulation and hPGC competency
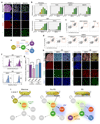
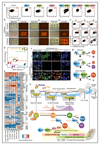
a. Schematics showing progressive gain and loss of competency for hPGCs. b. Induction of hPGCs (% NT/AP +ve cells) in day 4-5 embryoids. c. Induction of of definitive endoderm (DE: (% CXCR4 +ve cells)) at 12h–24h of during ME differentiation. d. Immunostaining of hPGCs induced from Pre-ME(12h) and of DE from ME(24h). Dashed lines: SOX17/OCT4 +ve hPGCs. Scale bar: 50 μm. e. Gene expression (RT-qPCR) changes during ME induction. f. Induction of hPGCs (%NANOS3-tdTomato/AP +ve cells) from Pre-ME(12h) or ME(24h). Pre-ME are competent for hPGCs in response cytokines or SOX17, but ME are not. g. Immunostaining of day4 embryoids from Pre-ME(12h) or ME(24h). SOX17 in Pre-ME induced OCT4/BLIMP1 +ve hPGCs (dashed line), but in ME, it induced DE (BLIMP1/FOXA2 +ve) cells. Scale bar: 50 μm.
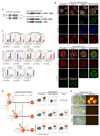
Fig.4
Fig.4. Induction of hPGCs by SOX17-BLIMP1 and combined representation of hPGCs and pPGCs specification
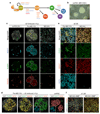
a. Induction of hPGCs by transcription factors in Comp-hPSCs: SOX17-BLIMP1 induce hPGCs b. Day1–4 embryoids with NANOS3-tdTomato (NT) reporter respond to ectopic SOX17 and BLIMP1 with or without cytokines. c. Induction of hPGCs (% NT/AP +ve cells) shown in Fig.4b. d. t-SNE analysis of RNA-seq data. e. Heat map of representative gene expression includes previous data. f. Day 4 embryoids induced by cytokines. Dashed line indicates positive signals. Arrowheads: OCT4/BLIMP1 +ve hPGC expressing FOXA2. Scale bar: 50 μm. g. SOX17 and BLIMP1 gene dosage is critical during hPGC specification: BLIMP1 represses SOX17-induced endodermal genes. h. Representation of human germ cell origin and program based on in vitro simulations from hPSCs and in vivo origin of pPGCs in porcine embryos.

References

    1. Tang WW, Kobayashi T, Irie N, Dietmann S, Surani MA. Specification and epigenetic programming of the human germ line. Nat Rev Genet. 2016;17:585–600. doi: 10.1038/nrg.2016.88. - DOI - PubMed
    1. Sugawa F, et al. Human primordial germ cell commitment in vitro associates with a unique PRDM14 expression profile. EMBO J. 2015;34:1009–1024. doi: 10.15252/embj.201488049. - DOI - PMC - PubMed
    1. Sasaki K, et al. Robust In Vitro Induction of Human Germ Cell Fate from Pluripotent Stem Cells. Cell Stem Cell. 2015;17:178–194. doi: 10.1016/j.stem.2015.06.014. - DOI - PubMed
    1. Irie N, et al. SOX17 Is a Critical Specifier of Human Primordial Germ Cell Fate. Cell. 2015;160:253–268. doi: 10.1016/j.cell.2014.12.013. - DOI - PMC - PubMed
    1. Hayashi K, Ohta H, Kurimoto K, Aramaki S, Saitou M. Reconstitution of the mouse germ cell specification pathway in culture by pluripotent stem cells. Cell. 2011;146:519–532. doi: 10.1016/j.cell.2011.06.052. - DOI - PubMed

Publication types

MeSH terms

Substances