. 2017 Jun 15;546(7658):431-435.
doi: 10.1038/nature22794. Epub 2017 Jun 7.

Rare cell variability and drug-induced reprogramming as a mode of cancer drug resistance

Affiliations

Rare cell variability and drug-induced reprogramming as a mode of cancer drug resistance

Sydney M Shaffer et al. Nature. .

Erratum in

Abstract

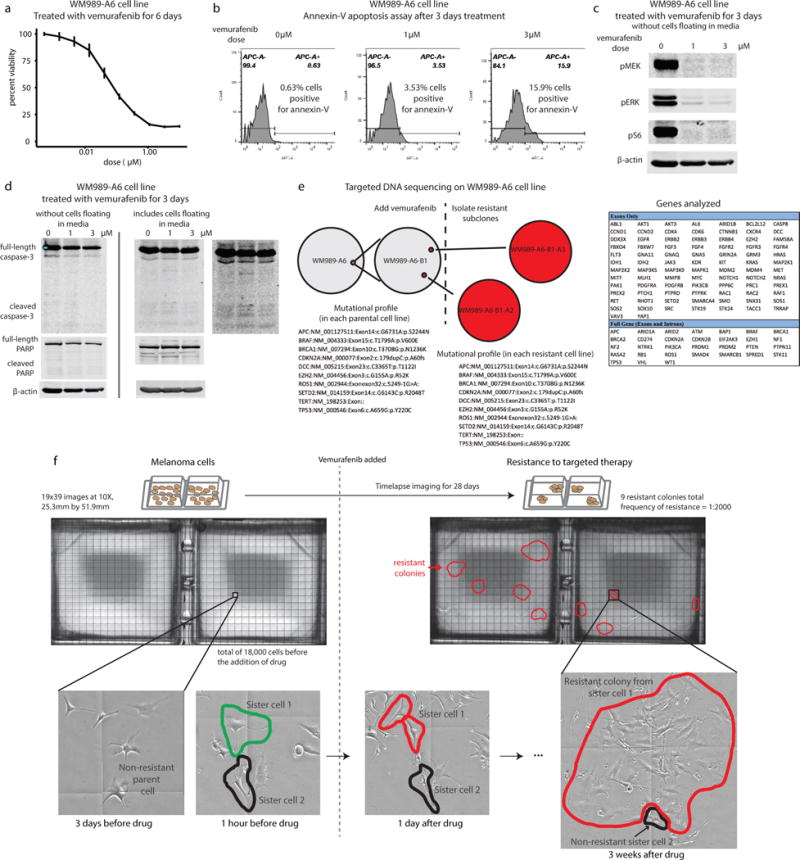
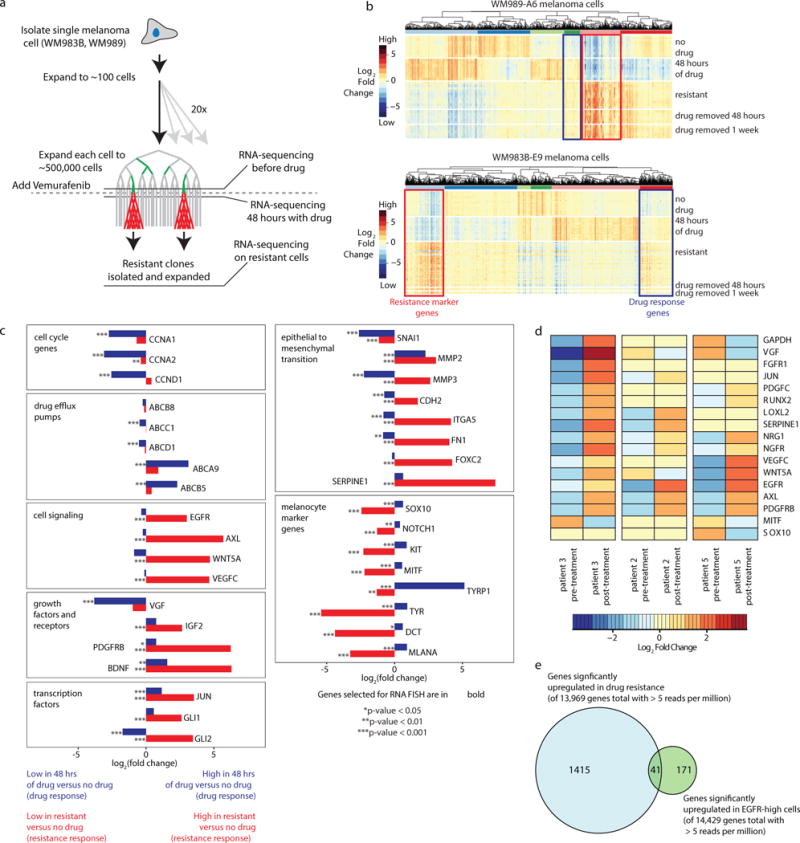
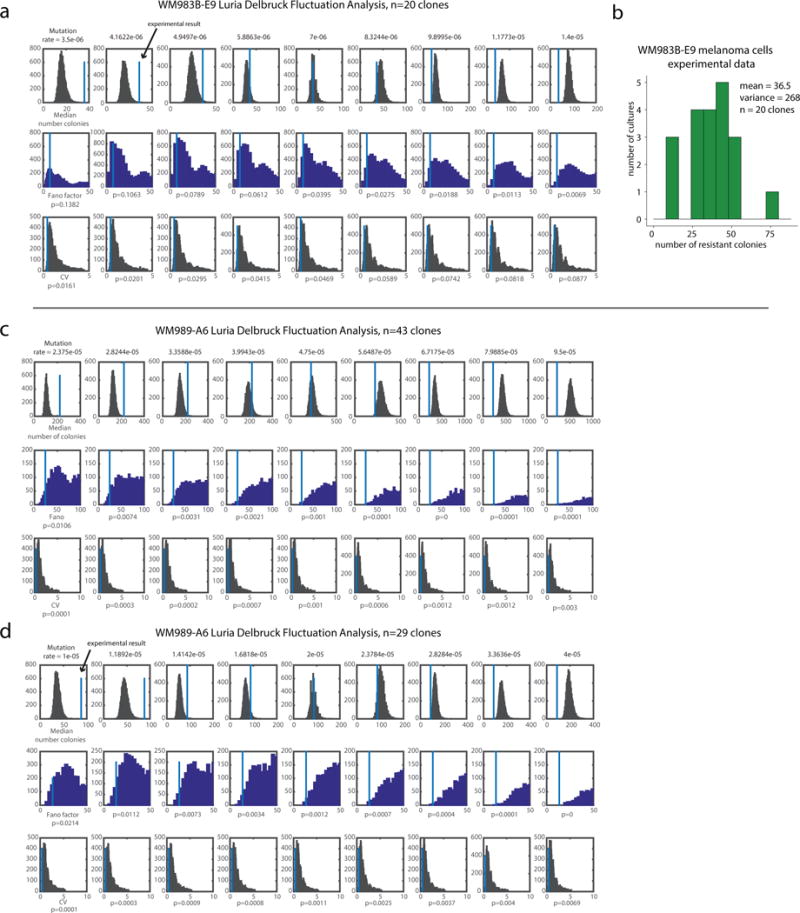
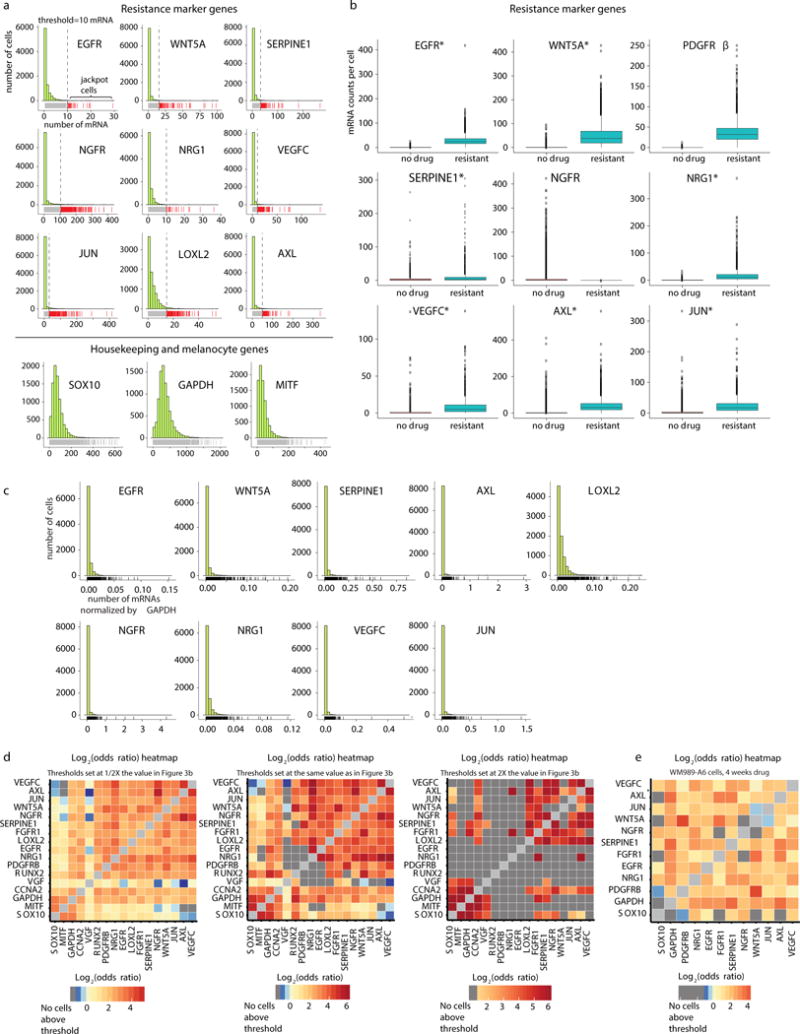
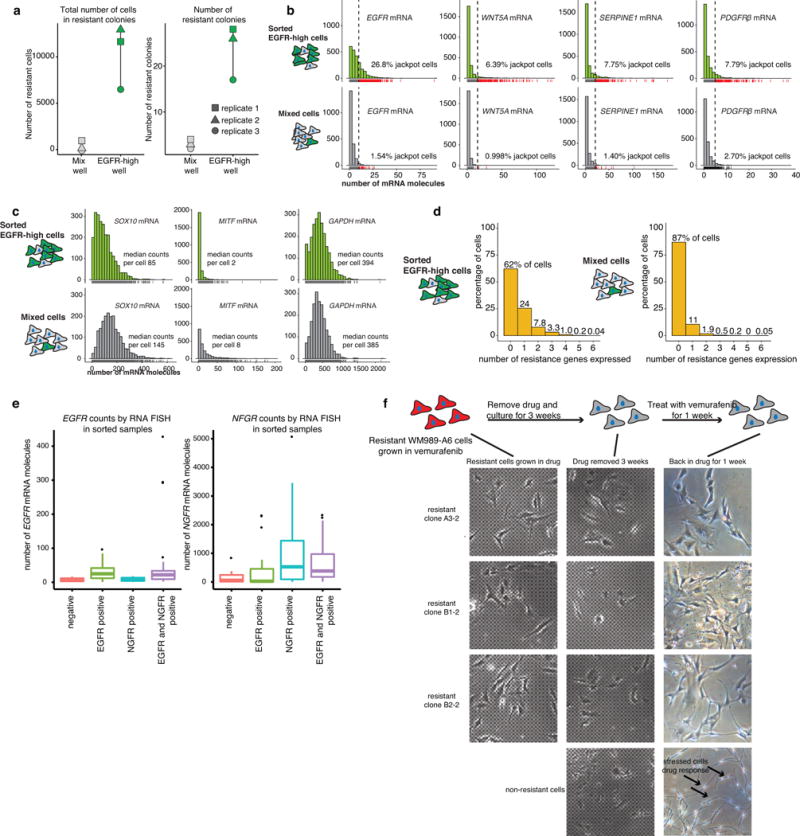
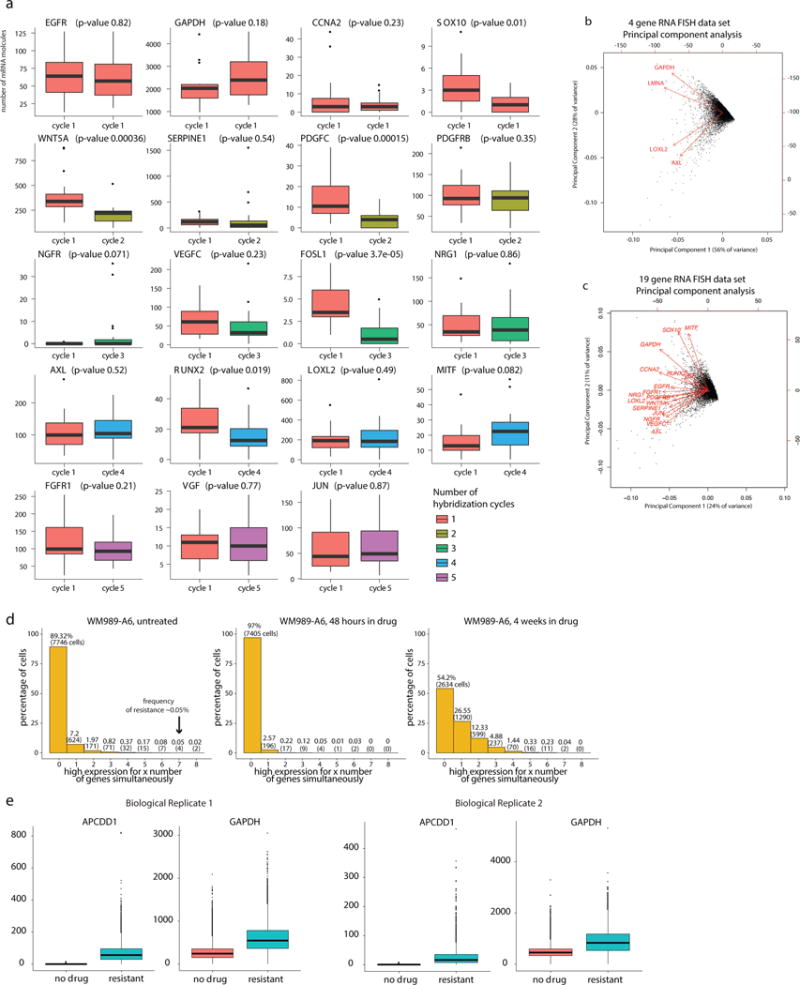
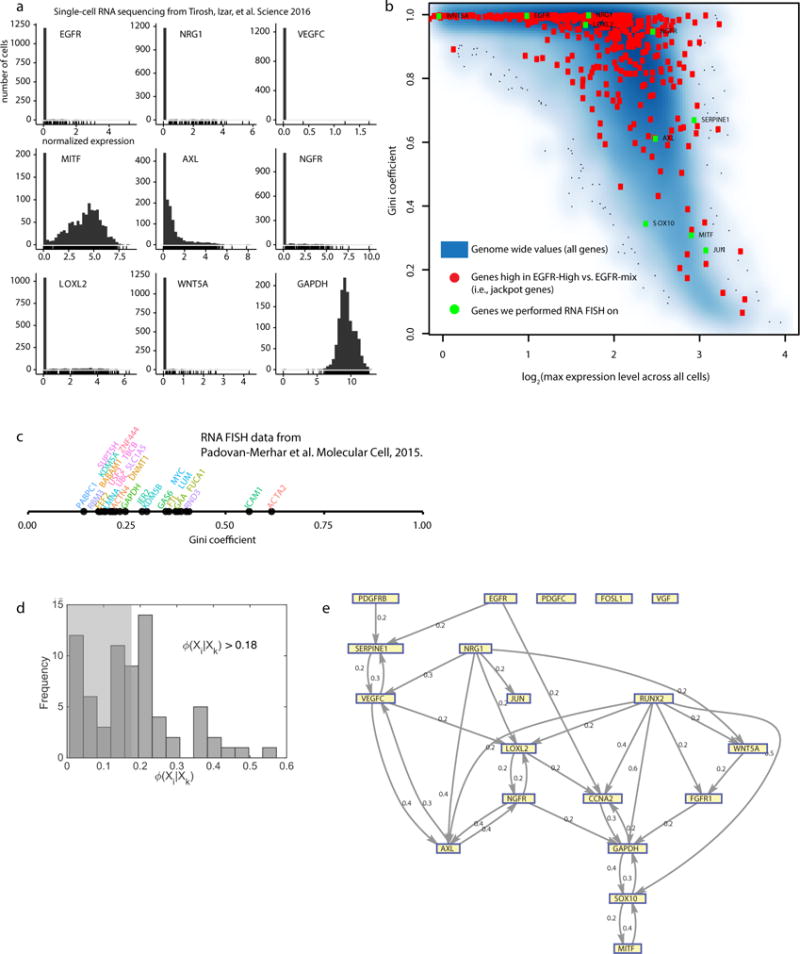
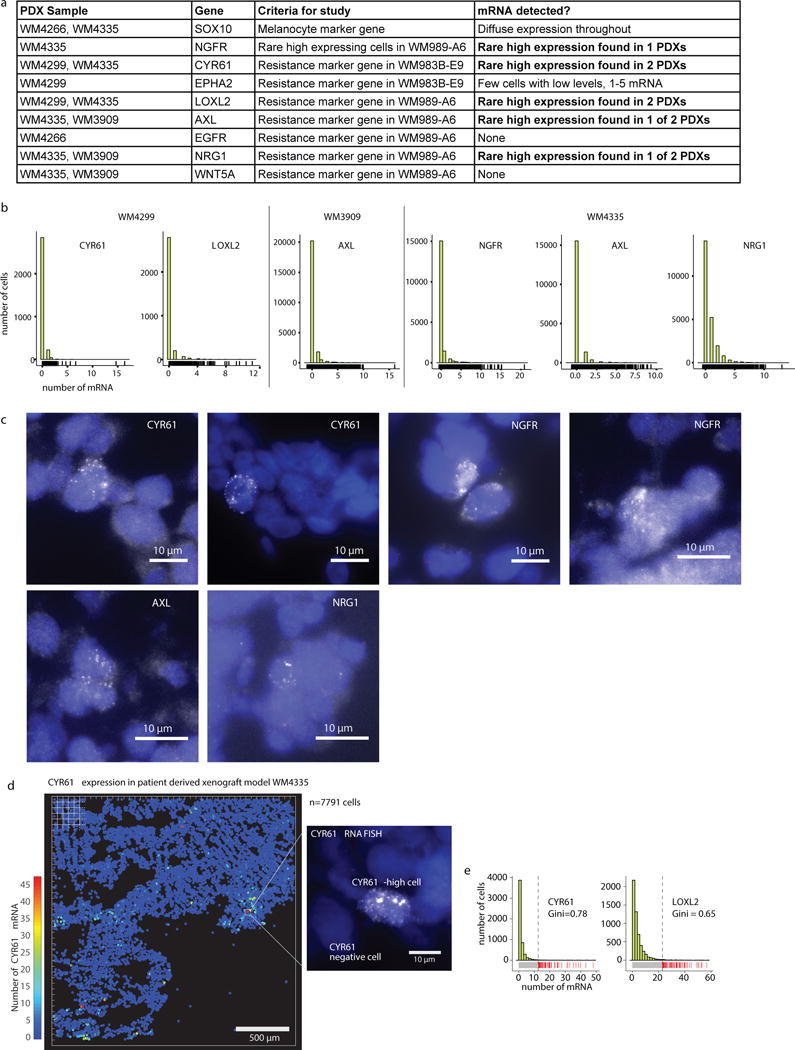
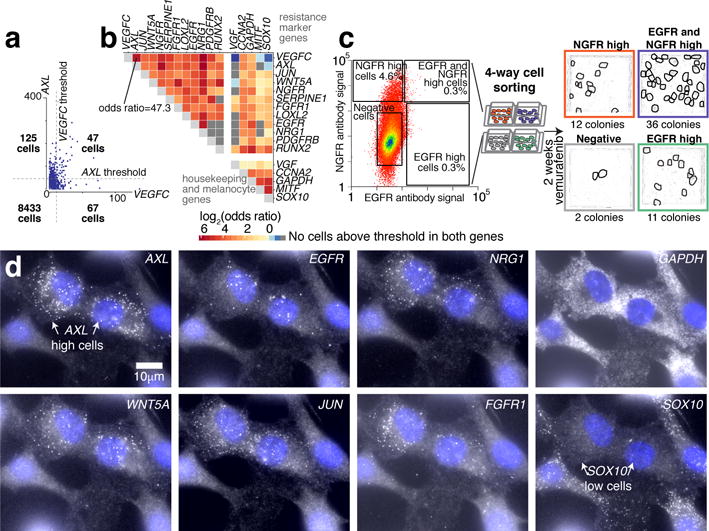
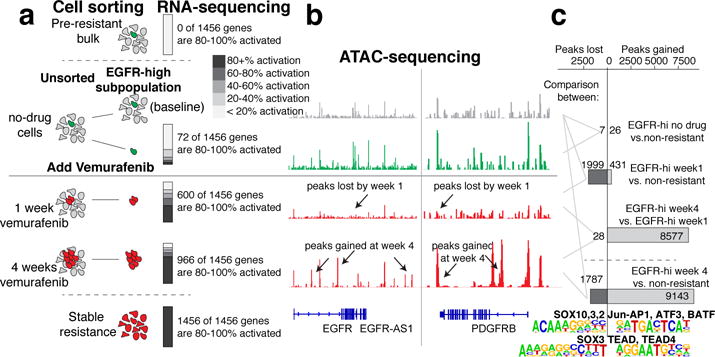
Therapies that target signalling molecules that are mutated in cancers can often have substantial short-term effects, but the emergence of resistant cancer cells is a major barrier to full cures. Resistance can result from secondary mutations, but in other cases there is no clear genetic cause, raising the possibility of non-genetic rare cell variability. Here we show that human melanoma cells can display profound transcriptional variability at the single-cell level that predicts which cells will ultimately resist drug treatment. This variability involves infrequent, semi-coordinated transcription of a number of resistance markers at high levels in a very small percentage of cells. The addition of drug then induces epigenetic reprogramming in these cells, converting the transient transcriptional state to a stably resistant state. This reprogramming begins with a loss of SOX10-mediated differentiation followed by activation of new signalling pathways, partially mediated by the activity of the transcription factors JUN and/or AP-1 and TEAD. Our work reveals the multistage nature of the acquisition of drug resistance and provides a framework for understanding resistance dynamics in single cells. We find that other cell types also exhibit sporadic expression of many of these same marker genes, suggesting the existence of a general program in which expression is displayed in rare subpopulations of cells.


Figures

Extended Data Fig. 1
Extended Data Fig. 1. Treatment of WM989 cells with vemurafenib induces cell death initially, but after weeks of treatment, colonies of resistant cells develop
a. Percent viability of WM989-A6 cells treated with vemurafenib for 6 days (MTS assay). b. Annexin-V staining in WM989-A6 cells after 3 days of treatment with vemurafenib measured by flow cytometry. The percentage of cells that are positive for annexin-v is labeled on the plots. c. Western blot for pMEK, pERK, and pS6 after 3 days of treatment with vemurafenib. d. Western blot for caspase-3 and PARP after 3 days treatment with vemurafenib. This demonstrates that WM989-A6 cells are highly responsive to BRAF inhibitor treatment with inhibition of signaling downstream of BRAF and apoptosis of sensitive cells. e. We performed targeted DNA-sequencing on a panel of 119 cancer and melanoma-related genes. We performed sequencing on the parental WM989-A6 subclone used throughout this work, along with WM989-A6-B1 subclone. From the WM989-A6-B1 subclone, we isolated two resistant subclones, WM989-A6-B1-A2 and WM989-A6-B1-A3. All of these cell lines had the same mutational profile. Thus, we can say that none of the clinically documented mutational profiles (such as in KRAS) appeared as genetic resistance mechanisms in our experiments. This does not in and of itself preclude, however, mutations to other genes or non-coding mutations to regulatory regions. f. Twenty-eight day time-lapse images of WM989-A6 cells before and then after application of cytostatic dose of vemurafenib. Sister cells are labeled in the images. There were approximately 18,000 cells at the time that we applied drug, and a total of 9 resistant colonies formed on the culture dish. We observed instances in which two sister cells exhibited divergent phenotypes, for instance, one would respond to drug while the other would continue growing, eventually forming a resistant colony. These results suggested the possibility of a non-genetic resistance mechanism, although do not constitute proof.
Extended Data Fig. 2
Extended Data Fig. 2. RNA-sequencing identifies genes whose expression is specific to resistance
a. Schematic of transcriptional profiling experiments. We harvested cells for analysis before drug, 48 hours after drug application and then on stably resistant cultures. b. Heatmaps depicting expression changes across all differentially expressed genes. Each row represents a separate RNA-sequencing experiment taken from a different Luria-Delbruck subclone. Resistant cultures obtained from subculturing resistant colonies. All genes shown have a greater than 1.4 fold change and adjusted p-value less than 10−5 in at least one experimental condition. Color represents log2 of fold change across the conditions. c. Fold changes in expression in drug response (blue; fold change of 48 hours in drug vs. no drug) and resistance (red; fold change of resistant cells vs. no drug) for WM989-A6 cell line. Bolded gene names are the genes that were selected for analysis by RNA FISH in WM989-A6 cells (Fig. 2a). P-values for differential expression of the drug response or resistance are indicated by asterisks next to each bar and cutoffs are labeled below the plots. d. RNA sequencing of patient tumors pre-treatment and post-treatment from Sun et al. Nature 2014 shows changes in gene expression for many of the same resistance marker genes found in WM989-A6 cells. Heatmap depicts the log2 fold change for each gene. Samples are normalized by patient. The genes displayed here are the same panel of genes used for RNA FISH in WM989-A6 cells in Fig. 2a. This analysis demonstrates that there is significant overlap between the transcriptional signature of resistance in WM989-A6 cells and resistant patient samples. e. We wondered whether the set of pre-resistance associated markers was a privileged subset of the genes upregulated upon the cell becoming drug-resistant. We performed our analysis on WM989-A6 cells, comparing untreated cells, cells treated with vemurafenib for 48 hours, and resistant cells to identify marker genes that are upregulated uniquely during drug-resistance (n=1,456) and EGFR-high to EGFR-mix for pre-resistance markers (n=212) (significance defined as log2 fold change of 0.5, p=0.00001). We found that there was a strong overlap of 41 genes, but there were also clearly genes specific to both drug-resistance and pre-resistance, suggesting that they are not the same biological process per se.
Extended Data Fig. 3
Extended Data Fig. 3. Luria-Delbrück fluctuation analysis demonstrates that WM989-A6 and WM983B-E9 cells develop drug resistance through a non-heritable mechanism
a. We simulated the strongly heritable hypothesis for a range of different mutation rates. At each mutation rate, we ran the simulation 10,000 times. We used the parameters specific to this experiment for the WM983B-E9 cell line, including the total number of divisions and subsampling of the cultures prior to drug treatment. Each column of plots assumes a different mutation rate which is labeled above. The first row contains histograms of the median number of colonies from each simulation, the second row contains histograms of the Fano factor from each simulation, and the third row contains histograms of the coefficient of variation (CV) from each simulation. In each plot, the value corresponding to our experimental findings are labeled by the vertical line. The p-value to reject the strongly heritable hypothesis based upon the Fano factor or CV at each mutation rate is below the plot. b. Histogram of the number of resistant colonies from the Luria Delbruck fluctuation analysis in WM983B-E9 with a total of 20 clones. c,d. We performed the Luria-Delbrück fluctuation analysis twice with the WM989-A6 cell line. As described for a, we simulated the strongly heritable hypothesis for a range of different mutation rates. The plots in panels c and d are from separate biological replicates with a total of 43 and 29 clones. The super-Poisson distribution we observed may potentially be due to variation in plating efficiency or proliferation rates between clones; the pre-resistant state may also be heritable over small numbers of divisions.
Extended Data Fig. 4
Extended Data Fig. 4. RNA FISH on thousands of melanoma cells reveals rare cells that express high levels of resistance marker genes
a. Histograms of transcript abundance for resistance marker genes (top) and nonresistance markers (bottom). The vertical lines represent the threshold for designating cells as either “high” or “low” expressing for a particular gene. The cells labeled by the red carpet below the histogram are high expressing, and the cells labeled by the gray carpet are low expressing. The data set shown contains a total of 8672 cells and is one of two biological replicates. b. In an untreated population of cells, rare cells express resistance marker genes at much higher levels than the population average, sometimes at levels similar to the drug resistant state. Boxplots showing the distribution of mRNA counts per cell for untreated WM989-A6 cells and resistant WM989-A6 cells. The untreated data set is the same data as shown in a. For the resistant WM989-A6 cells, we performed iterative RNA FISH with the same panel of genes. The untreated data set contains a total of 8672 cells and the resistant data set contains a total of 4082 cells (1 of n=2 biological replicates are shown for each dataset). Asterisks next to the gene names indicates that the max expression of the untreated sample is greater than or equal to the median of the resistant sample, demonstrating that for these 7 of 9 genes, the “high” cells have expression levels potentially equivalent to resistant cells. However, we also point out that given that the sampling of high expressing cells in the untreated samples is low, it is difficult to explicitly compare the distributions to say that the expression in the rare high-expressing cells is equivalent to that in stably resistant cells. c. Rare cells expressing sporadic but high levels of resistance markers are still present when each gene is normalized by GAPDH mRNA counts. Each histogram shows the distribution of GAPDH normalized counts for a particular jackpot gene. The counts for each gene in each cells has been divided by the GAPDH counts in that same cell. This accounts for any volume-dependent differences between cells. Cells that had GAPDH counts less than 50 were dropped from this analysis (these cells were infrequent and gave abnormally high numbers after normalization, thus were dropped). With these cells removed, the data set contains a total of 8477 cells. d. Heatmap shows the odds ratio for co-expression between all pairs of genes in WM989-A6 cells (1 of n=2 biological replicates shown). Dark gray boxes label pairs where there were zero cells with counts high expression threshold for both genes. The heatmap in the middle has the same thresholds for designating cells as “high” or “low” as used in Fig. 3b. Meanwhile, the heatmap on the left shows the same analysis with the thresholds set to 1⁄2 of the their value in 3b and the heatmap on the right shows this analysis with thresholds set to twice their value in Fig. 3b. When the thresholds are at 1⁄2, the result is very similar to that in Fig. 3b. However, increasing the threshold by 2X leads to many gene pairs that do not have any cells that are “high” for both genes (indicated by the dark gray boxes). e. Heatmap showing odds ratios for WM989-A6 data after 4 weeks in drug (1 of n=2 biological replicates shown).
Extended Data Fig. 5
Extended Data Fig. 5. Sorting for EGFR-high cells enriches for pre-resistant cells and removing drug from resistant cells does not appear to reverse the resistant phenotype
a. Quantification of 3 biological replicates of the experiment depicted in Fig. 1f. b,c. Histograms showing the transcript abundance measured by RNA FISH in untreated and FACS sorted EGFR-high and mixed cell populations (n=1). The green histograms are from the EGFR-high population and the gray histograms are the mixed population. The percentage of high-expressing cells are labeled on each plot. Panel b shows resistance marker genes EGFR, WNT5A, SERPINE1, and PDGFRβ, and panel c shows melanocyte development genes, SOX10 and MITF, and a housekeeping gene, GAPDH. d. Histograms of percentage of cells that have high expression of a particular number of genes simultaneously. The left histogram is from the FACS sorted EGFR-high cells, and the right histogram is from the mixed population. e. Boxplots summarize the single-cell RNA FISH counts for EGFR and NGFR in flow sorted populations shown in Fig. 3c. These results show that sorting the high populations indeed enriched for EGFR and NGFR mRNA, thus validating the sort procedure (n=1). Furthermore, it shows that the double sorting does not further enrich for either EGFR or NGFR mRNA alone, showing that the effects of the double sort do not arise from a further enrichment of either EGFR or NGFR-high cells per se, but rather the combination of both in the same cell. f. Isolated resistant subclones are stably resistant to vemurafenib. We established stably resistant subclones of WM989-A6 cells grown in vemurafenib by culturing genetically homogeneous WM989-A6 subclones, adding drug, then isolating small resistant colonies and expanding them in the presence of drug into large populations. For three such resistant subclones, we removed drug for a period of three weeks (drug “holiday”), then added drug back for a week and looked for response. Generally, the cells looked fairly similar to the pre-holiday state and continued to proliferate, indicating that they remained insensitive to drug despite the prolonged holiday from drug exposure. The bottom panel is a control experiment consisting of a non-resistant parental line exposed to drug, showing the morphological changes associated with drug response.
Extended Data Fig. 6
Extended Data Fig. 6. Iterative RNA FISH enables quantification of genes that are expressed in rare cells and control genes that are expressed throughout a population
a. RNA counts are consistent whether a gene is probed on the first cycle of iterative RNA FISH or subsequent cycles. Boxplots summarizing RNA FISH mRNA counts for each gene in the 19 gene panel (shown in Fig. 2a). We probed each gene from the panel in resistant WM989-A6 cells without performing iterative hybridizations (n=1 with further validation performed on a 5 gene panel; note that we used resistant cells because the generally higher expression levels allowed for more robust comparisons). We then performed iterative RNA FISH with all the probes and compared the total mRNA counts. We took image z-stacks of each sample and captured a total 15–25 cells per sample. Expression levels were similar between the first round of hybridization and all subsequent hybridization cycles. The color of the boxplot indicates the hybridization cycle during which we used each probe. The p-value for differences in RNA counts between the cycles are labeled above each plot. Some variability may be due to sampling with genes that have low and/or highly variable expression, and in these instances, we expect some differences in the two count distributions. There is some loss for some genes in later cycles, but we do not believe that affects our qualitative findings of rare, high-expressing cells. b. Housekeeping genes correlate more with each other than with resistance markers and vice-versa. We performed RNA FISH on 8672 non-drugged cells with probes targeting LOXL2 and AXL (both of which exhibit rare-cell expression) and LMNA and GAPDH, both of which are control genes not associated with resistance (1 of n=2 biological replicates shown). We then performed principal component analysis to determine which genes covary with which other genes. We transformed the vector representing the expression levels of each cell into the space spanned by the first two principal components. Arrows represent transformations of unit vectors of the specified gene into this same space. We observed two rough axes of variability, one corresponding to the GAPDH and LMNA and the other to AXL and LOXL2. Thus, these results show that there is substantial covariation in housekeeping genes and in resistance markers, but that these two axes of variation separate. c. Same plot as in panel b, but with the RNA FISH data shown for WM989-A6 in Figure 2b. d. There are subpopulations of cells that have high expression of multiple resistance marker genes. Histogram of number/fraction of cells that have high expression for a particular number of genes simultaneously, both before, immediately after and then 4 weeks after application of drug (1 of n=2 biological replicates shown). We found that immediately after adding drug, there was a large general decrease in the amount of high-expressing cells, but a few cells remained that expressed several marker genes at once. This suggests, but certainly does not prove, that these multi-expressing cells may be the pre-resistant cells. At best, it establishes that such a correspondence is plausible. e. We used RNA FISH analysis to look (in WM989-A6 cells) at the expression of APCDD1 cells, which was identified as a potential marker of drug-induced reprogramming (as opposed to pre-re- sistance). We measured APCDD1 expression in a total of 61,770 (20,030 in replicate 1 and 41,740 in replicate 2) cells before adding drug and 11,452 (7,138 in replicate 1 and 4,314 cells in replicate 2) cells after cells became stably resistant (n=2 biological replicates shown). Given the number of cells analyzed, we expected that roughly 30 cells in the untreated population would be pre-resistant (assuming conservatively that the frequency of pre-resistance is 1:2000), but despite that, we found essentially no cells with APCDD1 expression levels approaching those of even the median resistant cell. Thus, expression of this gene must have changed upon the pre-resistant cell becoming stably resistant in the presence of drug, as opposed to a selection effect in which high levels of expression in pre-resistance cells become prevalent due to those cells surviving rather than reprogramming.
Extended Data Fig. 7
Extended Data Fig. 7. Gini analysis on other single cell expression data sets and network structure for rare high expressing cells
a. Rare cells expressing high levels of resistance genes are suggested by single cell sequencing data from Tirosh, Izar, et al. Science 2016. Histograms of normalized single-cell expression data for 9 marker genes, including all malignant cells from this data set. b. Study of Gini coefficients based on single cell RNA-sequencing data (looking at patient 79 with 469 cells; results similar for other patients). As per GiniClust (Jiang et al. Genome Biology 2016), we first plotted the Gini coefficient vs. the maximum expression level out of all cells examined (results similar if one uses the mean instead of max). As they did, we found a strong anti-correlation, which presumably results from the large number of artifactual zeros in the datasets that inflate Gini coefficients in general for lowly expressed genes. As a positive control, we examined 405 genes that we know to be jackpot genes (high fold change in EGFR-High vs. EGFR-mix), and we found that they were essentially randomly scattered throughout the distribution. We then plotted genes we performed RNA FISH on. We found again that they were squarely in the middle of the distribution and not towards the top right of the region, which is where one would expect to find abnormally high Gini coefficient genes. There are two possible interpretations of our data. One is that the Gini coefficients of the genes we selected are not especially different from those of similarly expression matched cells, and so the genes we selected do not comprise a deviant subset of all genes. Another is that single cell RNA-sequencing data has a number of known and unknown artifacts that make Gini analysis difficult. We favor the latter based on our experience with RNA FISH and the results of Battich and Stoeger et al. Cell 2015, but our current analysis leaves us unable to resolve this for now. We do, however, note that Tirosh et al. do report low frequency AXL positive cells via immunofluorescence, which is directly comparable and consistent with our RNA FISH results. c. Gini analysis of 26 references genes from Padovan-Merhar et al. Molecular Cell 2015. Padovan-Merhar et al. performed RNA FISH to obtain single cell RNA FISH counts for a panel of 26 genes across a range of expression values and degrees of variability. We calculated the Gini coefficient for each gene. We found that 24 out of the 26 genes had low Gini coefficients (less than 0.5), while two had Gini coefficients slightly higher than 0.5. None were as high as the highest amongst our panel of pre-resistance markers. These results suggest that our panel of resistance markers have higher degrees of rare-cell expression behavior than average, although a more unbiased RNA FISH analysis with a more complete set of genes would make such a conclusion more definitive. d. Phixer analysis reveals the network structure of rare-cell expression (see Supplementary Discussion 1). Histogram of the φ-mixing coefficient (edge strength) for all edges in the inferred network for melanoma undrugged cancer cells. To illustrate the network we select the 34 most strongest edges (non-shaded portion), and this corresponds to selecting edges with φ ≥ 0.18. e. Gene interactions obtained using the phixer algorithm applied to the single-cell RNA FISH data from cancer cells. Each directed edge and its corresponding strength (φ-mixing coefficient) quantifies the effect of an upstream gene on the probability of rare-cell expression of a downstream gene.
Extended Data Fig. 8
Extended Data Fig. 8. Analysis of multiple patient-derived xenografts reveals cells that sporadically express high levels of some resistance markers
a. Table summarizing results of our patient-derived xenograft experiments, including the 4 different models and all the genes tested with each. b. Histograms show full distribution of mRNA expression for genes for which we saw convincing signal. Note that for some expressing genes, there were sporadic noise spots in the analysis, leading to some cells with, say, transcript counts of 1–2 that are probably spurious. c. Image panel of marker gene expression in the patient-derived xenografts. d. Computational representation of CYR61 mRNA expression in patient-derived xenografts. Each cell is represented by a dot on this plot and the color of the dot represents the number of RNA in that particular cell as indicated by the color scale bar. e. Histograms show full distribution of mRNA expression for CYR61 and LOXL2 in WM4335.
Extended Data Fig. 9
Extended Data Fig. 9. Analysis of resistance after sorting by NGFR or AXL
a. We sorted three cell lines (WM989-A6, WM983B-E9, and SK-MEL-28) by NGFR antibody staining and applied vemurafenib for three weeks to look for differences in resistance. In WM989 cells and SK-MEL-28 cells, we observed an increased amount of resistant cells after NGFR sorting (2 biological replicates shown). In WM983B cells, we did not observe an enrichment in resistant cells, suggesting that NGFR is not resistance marker in this cell line (2 biological replicates shown). b. We performed analysis of RNA-sequencing transcript abundance levels in a number of independent subclones of WM983B-E9 both before drug addition, after 48 hours of drug addition, and after isolating stably resistant subclones. We found that NGFR was strongly associated with resistance in 3 of 10 clones, whereas in WM983B-E9, just 2 of 37 showed upregulation of NGFR. c. We sorted WM989-A6 cells by AXL antibody staining and applied vemurafenib to look for differences in resistance. Three biological replicates shown here. For each replicate, we recovered a different number of cells from the sort causing each experiment to have a different number of cells at the start of drug treatment. These numbers are shown in parenthesis above each image. After sorting, biological replicates 1 and 2 were in drug for 28 days before imaging and biological replicate 3 was in drug for 17 days before imaging. d. Example of plots from fluorescence assisted cell sorting plots showing the existence of a population of dead cells that we excluded. e. Validation of the AXL sorting by RNA FISH analysis post-sort. f. EGFR signaling affects the burn-in phase of resistance. Pre-treatment with lapatinib and vemurafenib and corresponding quantification of number of resistant colonies. g. Co-treatment of lapatinib and vemurafenib (also vemurafenib, lapatinib and vehicle only). No growth inhibition for lapatinib and vehicle only. (1 of n=2 biological replicates). h. Schematic of resistance model.
Extended Data Fig. 10
Extended Data Fig. 10. RNA-sequencing on FACS sorted EGFR high cells shows that sporadically expressing genes are more highly expressed in EGFR-high cells than the mixed population
a. We sorted EGFR-high cells at different time points in vemurafenib treatment (untreated n=3, 1 week n=2, and 4 weeks n=2) and performed RNA sequencing and ATAC sequencing on the sorted populations. Bar plots showing percentage of the resistance transcriptome that has become activated at different levels in each of the samples. Activation index is defined as log2 of the fold change divided by the total log2 fold change for the gene between the bulk non-resistant and bulk stably resistant populations. We then performed ATAC-seq analysis to identify differentially accessible sites between the sorted cell populations; example tracks shown displaying accessible site loss and gain from one of two replicates. b. Dot plot comparing the gene expression differences between EGFR-high and the mixed cell population. The y-axis shows the log2 fold change between the EGFR-high and mix cells, and the x-axis shows the different time points in drug (untreated, 1 week, and 4 weeks). Dots that fall above the zero line represent samples that have higher expression in the EGFR-high cells and dots that fall below the zero line represent samples that have lower expression in the EGFR-high cells. The genes summarized here are the same panel of genes used for multiplex RNA FISH in Fig. 2a. Each dot represents a separate biological replicate. There are 3 biological replicates for the untreated condition, 2 biological replicates for week 1, and 2 biological replicates for week 4. We found that 8 of the 10 genes that exhibited rare expression behavior also exhibited increased expression in the EGFR-high cells (EGFR, AXL, NGFR, WNT5A, SERPINE1, JUN, LOXL2 and PDGFRB). c. Control genes do not show as much enrichment in the EGFR-high subpopulation as the pre-resistance marker genes. We sorted by EGFR antibody to isolate the EGFR-high subpopulation of cells and then performed RNA sequencing on these populations as well as an EGFR-mixed population. Dot plots show the log2 fold change in gene expression for a set of control genes and a set of resistance marker genes. Each dot represents a separate biological replicate (paired EGFR-high/EGFR-mixed). The horizontal line at y=0 represents no change in the EGFR-high samples relative to the EGFR-mix. For the resistance marker genes (EGFR, AXL, and NGFR), there is significantly more expression in the EGFR-high sample, while the control genes do not show large differences, showing that they do not correlate with the expression of the resistance markers. d. EGFR-high cells are proliferating based upon expression of cell cycle markers. Barplot showing the fraction of max expression for cell cycle genes (CCNA2 and CCND1) across EGFR-high, EGFR-mixed, and EGFR-negative populations at each time point. e. EGFR-high cells do not express markers of slow-cycling subpopulations. Barplot showing the fraction of max expression for KDM5A and KDM5B, which are both markers of slow-cycling subpopulations in melanoma (Roesch et al. 2010; Sharma et al. 2010), across EGFR-high, EGFR-mixed, and EGFR-negative populations at each time point. Note that we only collected an EGFR-negative sample at 4 weeks because this was the only time point where the EGFR-high cells represented a significant portion of the total mixed population (>1%).
Figure 1
Figure 1. Resistance to vemurafenib is not heritable, and pre-existing pre-resistant cells are marked by very high expression of resistance genes
a. Alternative models for heritability of the resistant phenotype and simulated outcomes of each model. b. Distributions of resistant colonies in WM989-A6 (n=2 biological replicates of 43 and 29 clones; WM983B-E9 in Extended Data Fig. 3). c. Transcriptome analysis before drug, 48 hours after drug and stably resistant cultures (see Extended Data Fig. 2). Heatmap depicts “marker genes” whose expression increased in resistant cells relative to untreated. d. Computational representation of single-cell RNA FISH (8672 untreated cells) for AXL, NGFR, and EGFR mRNA; each dot is a cell colored by number of mRNA (1 of n=2 biological replicates). e. Single-cell AXL RNA FISH (1966 cells) after 4 weeks treatment with 1μM vemurafenib (1 of n=2 biological replicates). f. FACS of cells with an EGFR antibody; isolated an EGFR-high and mixed cell population, then applied vemurafenib. Two-well chamber of populations after 3 weeks vemurafenib(1 of n=3 biological replicates, Extended Data Fig. 5a). g. Ratio of number of colonies in EGFR-high vs. mixed wells after cells grew without drug for varying periods before vemurafenib application. Error bars represent standard error of the mean (3 biological replicates).
Figure 2
Figure 2. Multiplex single cell RNA FISH reveals rare cells with high, sporadic expression of resistance markers across multiple cell lines
a. High-throughput imaging and reiterative hybridization scheme. b. Gini coefficients of single-cell RNA FISH data for 4 melanoma cell lines, primary melanocytes, and 4 other cancer cell lines (1 of n=2 biological replicates shown).
Figure 3
Figure 3. Rare cell expression of resistance marker genes is coordinated between genes, leading to cells expressing multiple markers
a. AXL vs. VEGFC mRNA in individual WM989-A6 melanoma cells. Dotted lines represent thresholds for high/low. Inset tabulates cells. b. Odds ratio for co-expression. Dark gray boxes indicate zero double-positive cells (1 of n=2 biological replicates). c. Co-stain and sort for EGFR and NGFR into 4 populations: double negative and positive, and EGFR/NGFR positive only, followed by 1μM vemurafenib (2 weeks). Resistant colonies circled in the images (1 of n=2 biological replicates). d. Two cells across multiple rounds of hybridization. RNA FISH signal in white; cell nuclei in blue.
Figure 4
Figure 4. Vemurafenib induces stepwise reprogramming of pre-resistant cells into a stably-resistant state
a. EGFR-high cells isolated at different time points in vemurafenib treatment (untreated, 1 week, 4 weeks); RNA sequencing on sorted populations (3 biological replicates for untreated; 2 biological replicates at 1 week, 4 weeks, Extended Data Fig. 10). Percentage activation for resistance genes; activation index is log2(fold change) compared to EGFR-mix baseline divided by total log2 fold change between bulk non-resistant and bulk stably resistant populations. Bars show percentage of resistance genes at varying degrees of activation. b. ATAC-seq identified differentially accessible sites; tracks from one of two replicates. c. Peaks called as lost or gained if we could identify the peak in one of the conditions and saw a change in read count in the peak of 4 fold or higher across both replicates. Motifs and transcription factors identified using HOMER differential peak calling and de novo motif tools.

Comment in

References

    1. Trunzer K, et al. Pharmacodynamic effects and mechanisms of resistance to vemurafenib in patients with metastatic melanoma. J Clin Oncol. 2013;31:1767–1774. - PubMed
    1. Garraway LA, Jänne PA. Circumventing cancer drug resistance in the era of personalized medicine. Cancer Discov. 2012;2:214–226. - PubMed
    1. Nazarian R, et al. Melanomas acquire resistance to B-RAF(V600E) inhibition by RTK or N-RAS upregulation. Nature. 2010;468:973–977. - PMC - PubMed
    1. Krepler C, et al. Personalized pre-clinical trials in BRAF inhibitor resistant patient derived xenograft models identify second line combination therapies. Clin Cancer Res. 2015 doi: 10.1158/1078-0432.CCR-15-1762. - DOI - PMC - PubMed
    1. Spencer SL, Gaudet S, Albeck JG, Burke JM, Sorger PK. Non-genetic origins of cell-to-cell variability in TRAIL-induced apoptosis. Nature. 2009;459:428–432. - PMC - PubMed

Publication types

MeSH terms