. 2017 Jun 22;546(7659):498-503.
doi: 10.1038/nature22341. Epub 2017 Jun 7.

Exosomes facilitate therapeutic targeting of oncogenic KRAS in pancreatic cancer

Affiliations

Exosomes facilitate therapeutic targeting of oncogenic KRAS in pancreatic cancer

Sushrut Kamerkar et al. Nature. .

Abstract

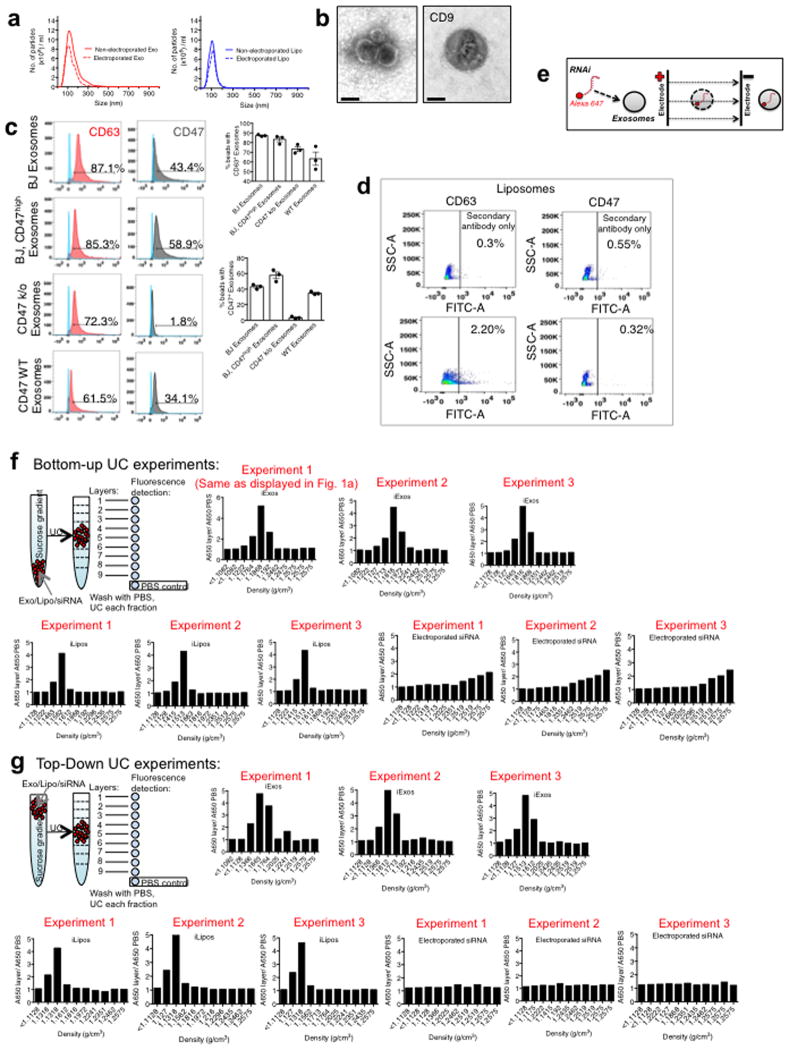
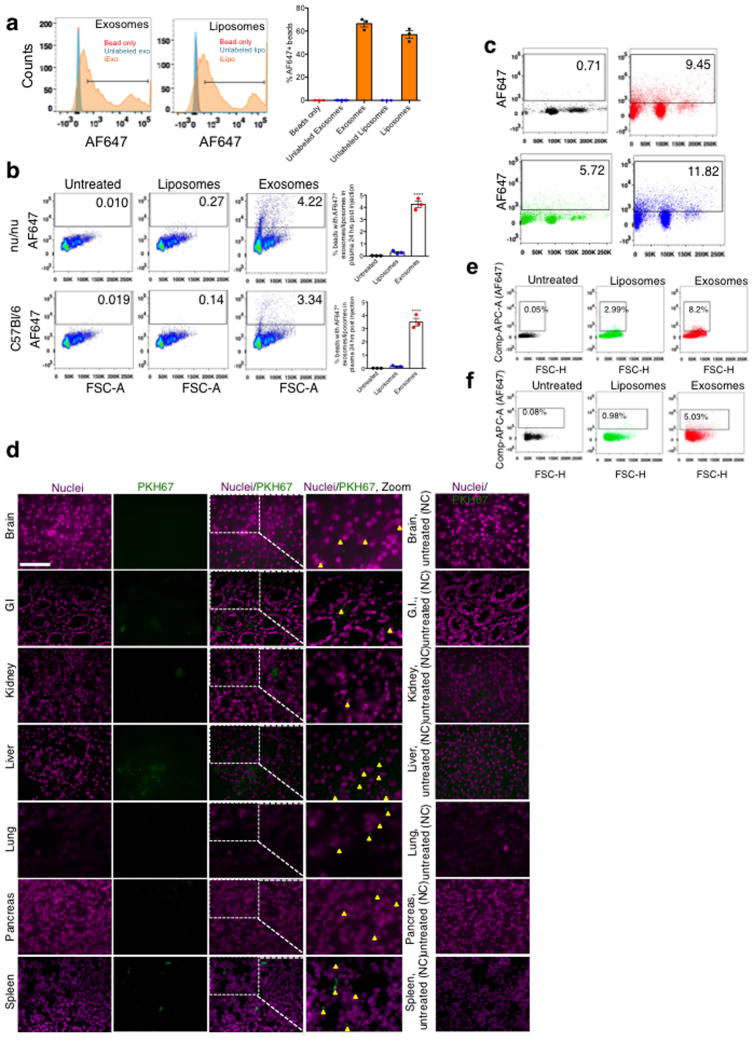
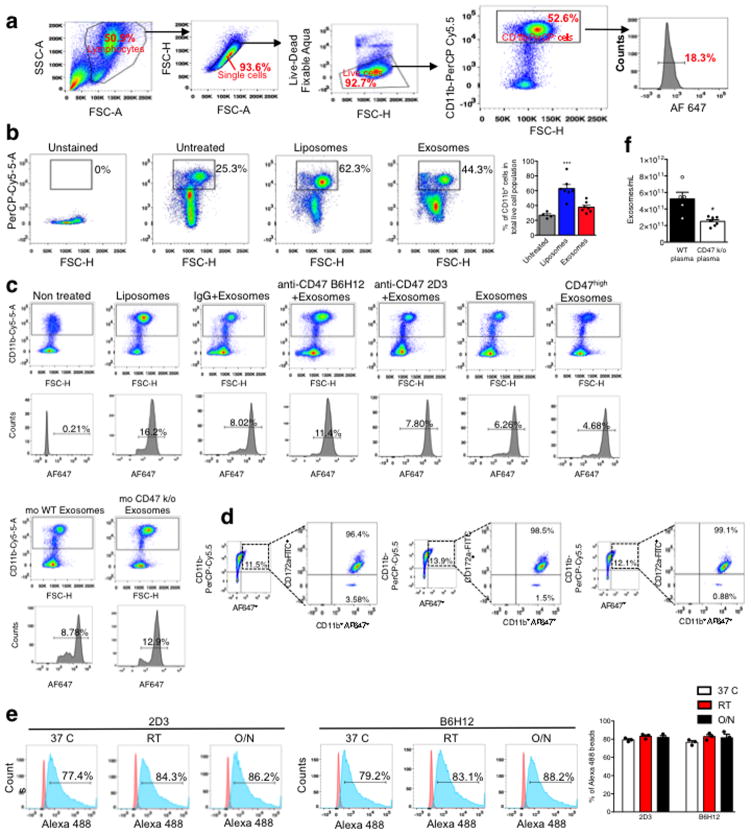
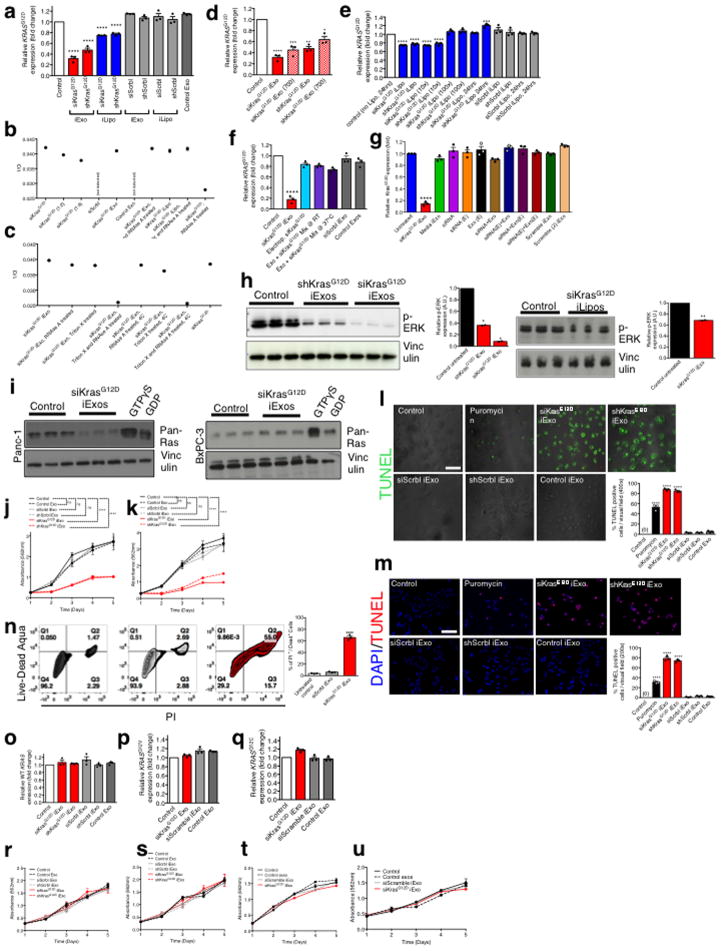
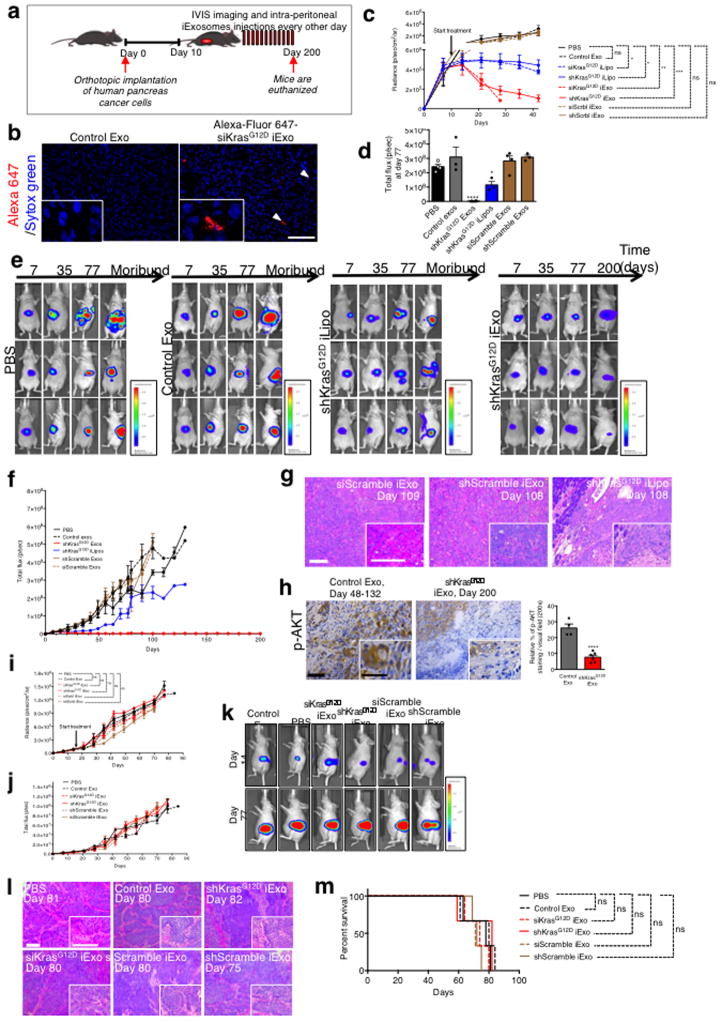
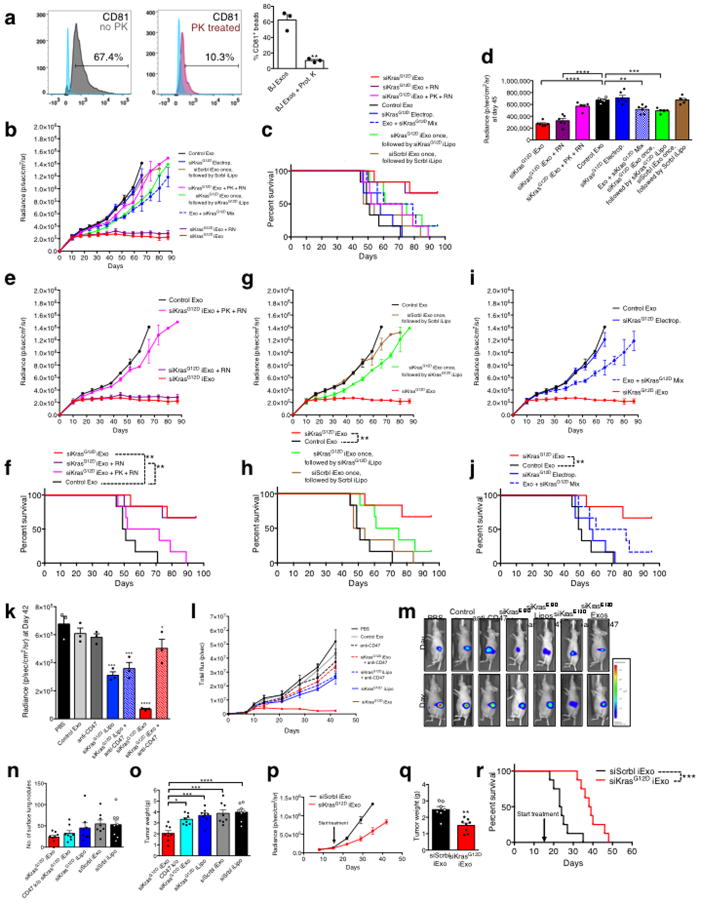
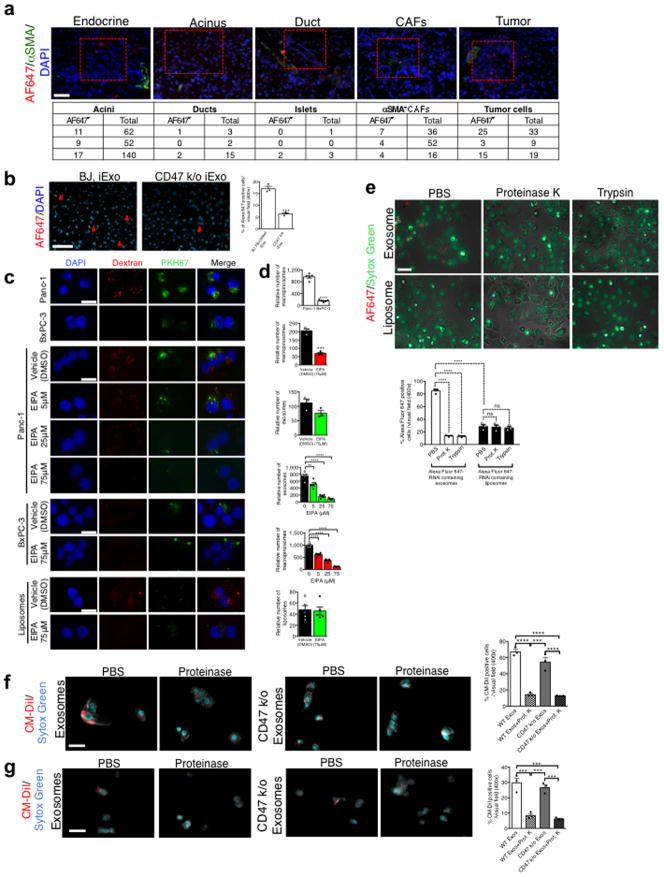
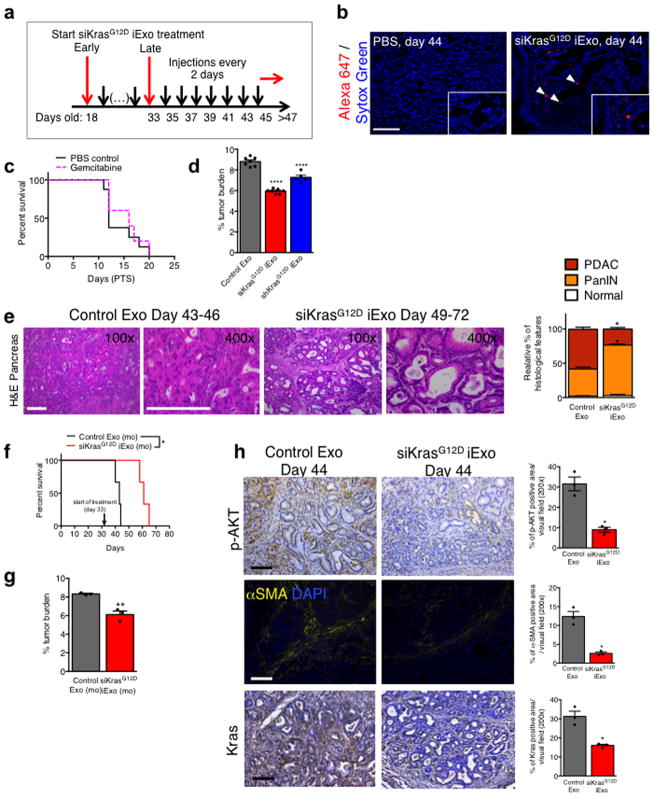
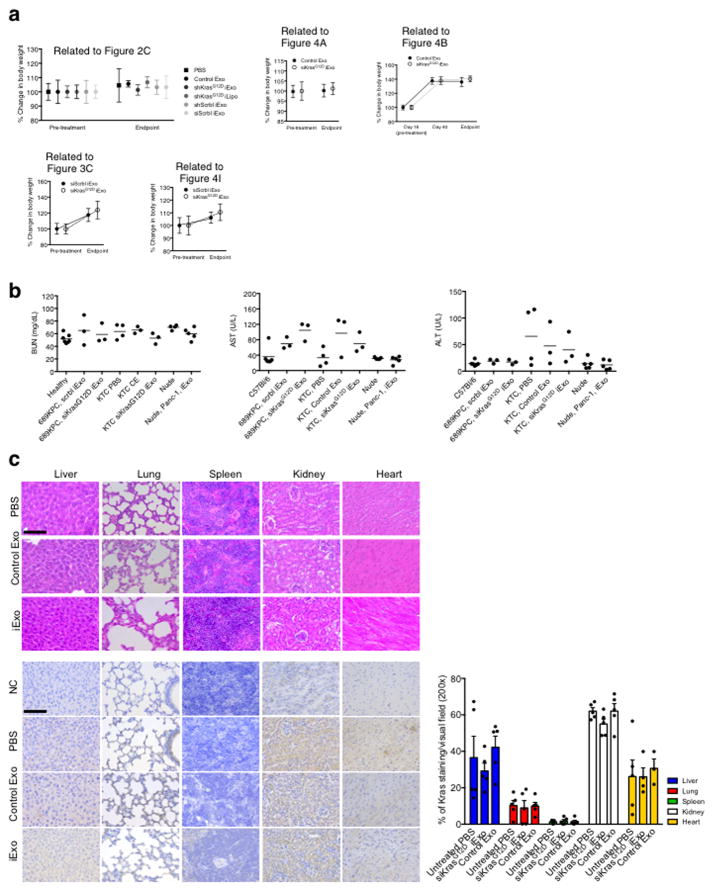
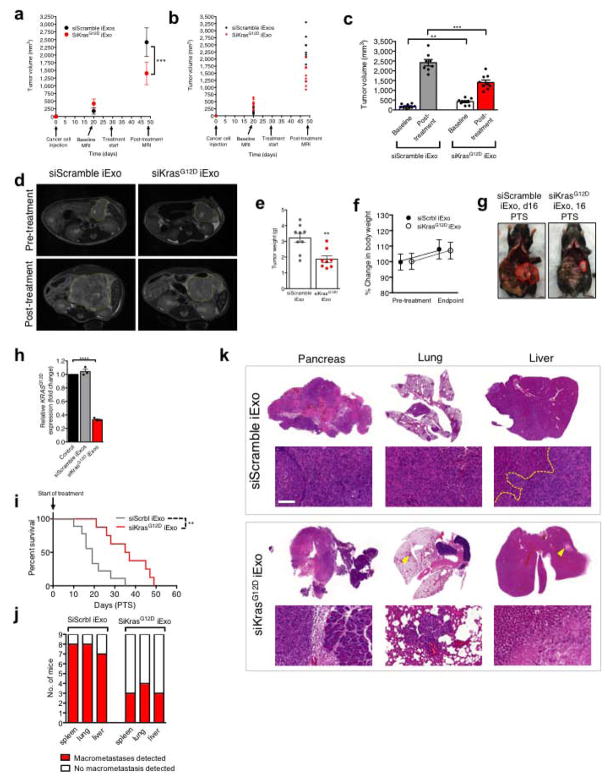
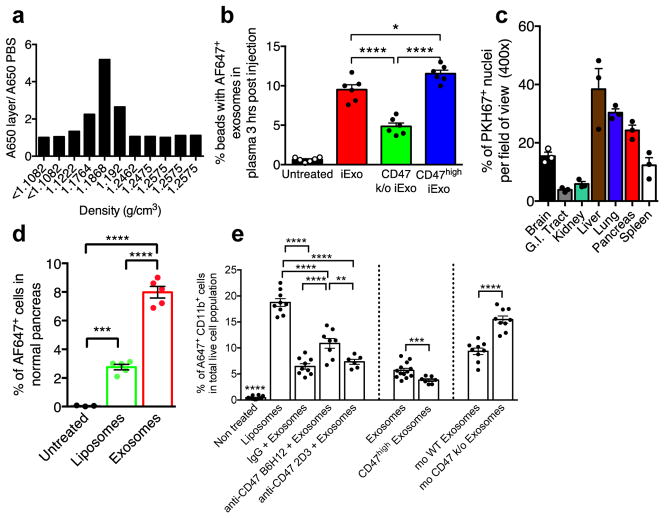
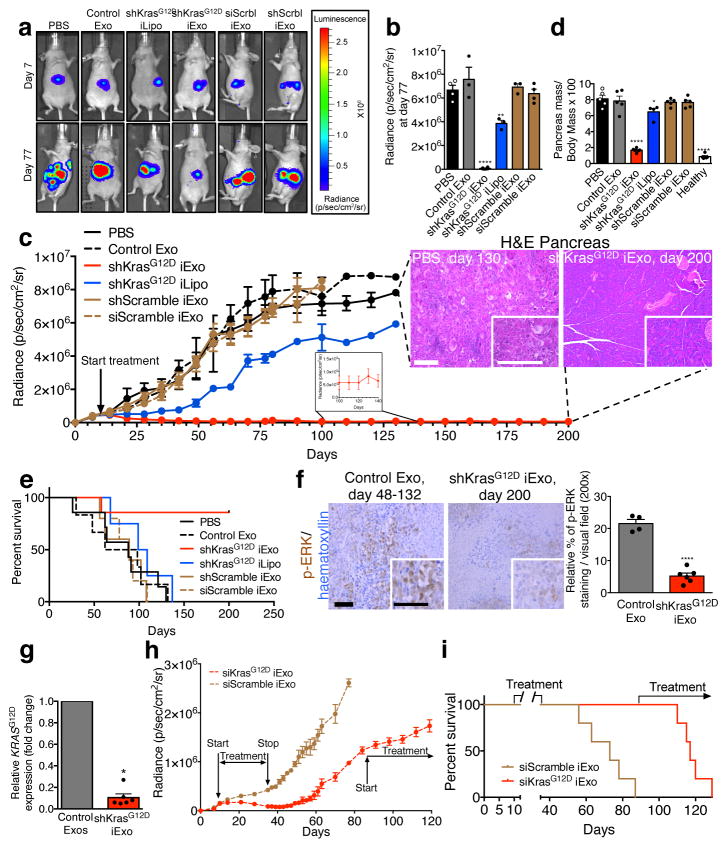
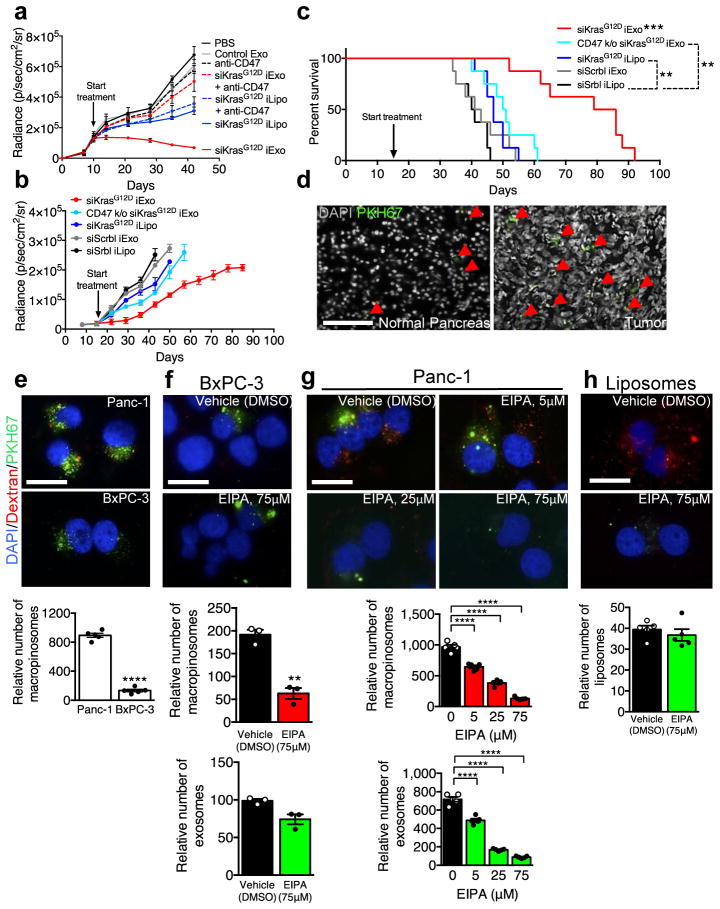
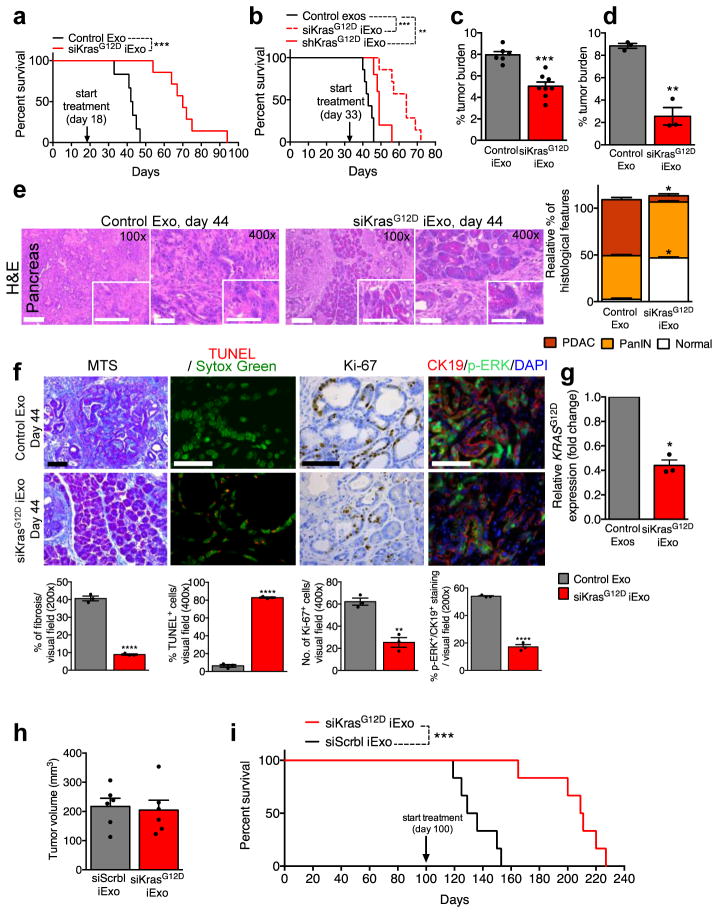
The mutant form of the GTPase KRAS is a key driver of pancreatic cancer but remains a challenging therapeutic target. Exosomes are extracellular vesicles generated by all cells, and are naturally present in the blood. Here we show that enhanced retention of exosomes, compared to liposomes, in the circulation of mice is likely due to CD47-mediated protection of exosomes from phagocytosis by monocytes and macrophages. Exosomes derived from normal fibroblast-like mesenchymal cells were engineered to carry short interfering RNA or short hairpin RNA specific to oncogenic KrasG12D, a common mutation in pancreatic cancer. Compared to liposomes, the engineered exosomes (known as iExosomes) target oncogenic KRAS with an enhanced efficacy that is dependent on CD47, and is facilitated by macropinocytosis. Treatment with iExosomes suppressed cancer in multiple mouse models of pancreatic cancer and significantly increased overall survival. Our results demonstrate an approach for direct and specific targeting of oncogenic KRAS in tumours using iExosomes.


Conflict of interest statement

Conflict of interest

MD Anderson Cancer Center and RK hold patents in the area of exosome biology and are licensed to Codiak Biosciences Inc. MD Anderson Cancer Center and RK are stock equity holders in Codiak Biosciences Inc. RK receives research support from Codiak Biosciences Inc. and serves as a member of the board of directors. VSL served once as a paid consultant for Codiak Biosciences Inc.

Figures

Extended Figure 1
Extended Figure 1. Exosomes purification and siRNA loading
(A) Exosomes and liposomes numbers and size distribution-using NanoSight. (B) Transmission electron micrograph of exosomes and stained for CD9 by immunogold (left panel: 2ary antibody only), scale bar: 100nm. (C) FC analyses for CD63 and CD47 on exosomes (n=3 distinct exosomes isolations). (D) FC analyses and quantification of exosomal proteins CD63 and CD47 in liposomes. (E) Schematic representation of electroporation of RNAi into exosomes. (F) Schematic and fluorescence intensity plot of sucrose gradient layers (from the “Bottom-Up” method, UC: ultracentrifuge). Results from three independent experiments are shown. (G) Schematic and fluorescence intensity plot of sucrose gradient layers (from the “Top-Down” method, UC: ultracentrifuge). Results from three independent experiments are shown. The data is presented as the mean ± SEM. FC: Flow cytometry. See accompanying source data.
Extended Figure 2
Extended Figure 2. Tissue distribution and clearance of iExosomes
(A) FC analyses and quantification of the comparison of the binding efficiency to aldehyde sulfate beads, n=3 distinct batches of exosomes and liposomes (B) FC analyses and quantification of AF647-tagged RNAi containing exosomes and liposomes isolated from the plasma of C57BL/6 (n=3 mice) and Nude (Nu/nu) mice (n=3 mice), 24 hours post injection. (C) FC analysis plots (from data shown in Fig. 1B) of exosomes with AF647 tagged siRNA in the circulation of mice. (D) Representative micrographs of the indicated organs of mice injected i.p. with PKH67 labeled BJ fibroblast exosomes (n=3 mice). Quantification is shown in Fig. 1C. (E–F) FC analyses of pancreas cells 6 hours (E) following injection of siKrasG12D Exos (quantification shown in Fig. 1D) and 24 hours (F) following injection of siKrasG12D Exos. The data is presented as the mean ± SEM. One-way ANOVA was used to determine statistical significance. **** p<0.0001. FC: Flow cytometry. See accompanying source data.
Extended Figure 3
Extended Figure 3. CD47 induced monocyte clearance and iExosomes characterization
(A) Schematic representation of gating strategy for data shown in Fig 1E. (B) FC analysis of CD11b+ cells in the circulation, liposomes (n=7 mice), exosomes (n=7 mice), Untreated mice (n=4). (C) Representative dot plots from Fig. 1E. (D) FC analyses of SIRP-α (CD172a) expression from Alexa 647+/CD11b+ monocytes. (E) FC analyses of the binding efficiency of CD47 neutralizing antibodies to exosomes (n=3 distinct batches of exosomes). (F) Quantification of the number of exosomes/mL in the plasma of WT C57BL/6 mice (n=5) vs. CD47 knockout mice (n=7), unpaired two-tailed t test. The data is presented as the mean ± SEM. Unless otherwise stated, one-way ANOVA was used to determine statistical significance. * p<0.05, *** p<0.001. FC: Flow cytometry. See accompanying source data.
Extended Figure 4
Extended Figure 4. iExosomes specifically target KrasG12D expression
(A) KRASG12D transcript levels in Panc-1 cells (n=3 independent experiments). (B–C) 1/Ct values from RT-PCR analysis under the listed conditions, to determine the loading efficiency of siRNA. Standards (siKrasG12D, 1:2 and 1:4 dilution): n=1, experimental groups: n=3 independent experiments. (D) KRASG12D transcript levels in Panc-1 cells, n=3 independent experiments. The experiments with 400 exos per cell is the same data that is also presented in panel A. (E–G) KRASG12D transcript levels in Panc-1 cells under the listed conditions. In all groups, n=3 independent experiments. (H) Western blotting (Panc-1 cells) for phosphorylated ERK (p-ERK) and Vinculin. si and sh KrasG12D iExo: One way ANOVA, iLipo: two-tailed t-test, n=2 independent experiments. (I) RAS pull-down assay. (J–K) Panc-1 cells MTT assay (n=5 partitions of indicated treatments with 3 or 6 wells for each partition of treatment) (J) and separate independent experiment (K). (L–M) TUNEL assay (n=3 distinct wells of Panc-1 cells) (L) and separate independent experiment (M). (N) FC analysis of apoptosis in Panc-1 cells. Three different treatments were used to treat n=3 distinct wells of cells. (O) Wild-type KRAS transcript levels in BxPC-3 cells (n=3 independent experiments). (P) KRASG12V transcript levels in Capan-1 cells (n=3 independent experiments) (Q) KRASG12C transcript levels in MIA PaCa-2 cells (n=3 independent experiments). (R–U) MTT assay: n=5 partitions of treatment given to 3 wells each, BxPC-3 cells (R) and separate independent experiment (S), n=3 partitions of treatment given to 10 wells each, Capan1 cells (T), n=3 partitions of treatment given to 10 wells each, MIA PaCa-2 cells, (U). The data is presented as the mean ± SEM. Unless otherwise stated, one-way ANOVA was used to determine statistical significance. * p<0.05, ** p< 0.01, *** p<0.001, **** p<0.0001. FC: Flow cytometry. See accompanying source data. For uncropped blots for H and I, refer to Supplementary Fig. 1.
Extended Figure 5
Extended Figure 5. KrasG12D RNAi containing exosomes suppress Panc-1 orthotopic tumor growth but not BxPC-3 orthotopic tumor growth
(A) Experimental scheme. (B) Representative micrographs (scale bar: 100μm,) depicting accumulation of internalized AF647-tagged siRNA from exosomes. (C) Panc-1 orthotopic tumor growth. PBS: n=6 mice, Control exos: n=6 mice, siKrasG12D iLipo: n=3 mice, shKrasG12D iLipo: n=3 mice, siKrasG12D iExo: n=7 mice, shKrasG12D iExo: n=7 mice, siScrbl iExo: n=5 mice, shScramble iExo: n=5 mice. Statistical test compares treatment groups to PBS control group at day 42-post cancer cell injection, or day 28 for siKrasG12D exos group. Unpaired two-tailed t test. This graph is an inset from the graph shown in Fig. 2C. (D) Tumor bioluminescence at day 77 (total flux), PBS: n=4 mice, Control Exo: n=3 mice, shKrasG12D iExo: n=6 mice, shKrasG12D iLipo: n=3 mice, shScramble iExo: n=3 mice, siScramble iExo: n=4 mice. (E) Luciferase activity at day 7, 35, 77 and moribund stage or day 200 (shKrasG12D iExo)-post cancer cell injection. Some of these panels are also shown in Fig. 2a. (F) Bioluminescence from Panc-1 orthotopic tumors over time (total flux). PBS: n=7 mice, Control Exo: n=6 mice, shKrasG12D iExo: n=7 mice, shKrasG12D iLipo: n=4 mice, shScramble iExo: n=5 mice, siScramble iExo: n=5 mice (G) Representative H&E of the Panc-1 orthotopic pancreas (scale bar: 100μm). (H) Representative micrographs (scale bar: 100μm) of tumors immunolabeled for phosphorylated AKT (p-AKT) and quantification. Control Exo, n=4 mice; shKrasG12D iExo, n=6 mice. Unpaired two-tailed t test. (I–J) BxPC-3 orthotopic tumor growth, n=3 mice per group. (K) Luciferase activity at day 14 and day 77-post cancer cell (BxPC-3) injection. (L) Representative H&E of the BxPC-3 orthotopic pancreas at the indicated experimental endpoints (scale bar: 100μm). (M) Kaplan-Meier curve of BxPC-3 tumor bearing mice, Log-rank Mantel-Cox, n=3 mice per group. The data is presented as the mean ± SEM. Unless otherwise stated, one-way ANOVA was used to determine statistical significance. * p<0.05, ** p< 0.01, *** p<0.001, **** p<0.0001. See accompanying source data.
Extended Figure 6
Extended Figure 6. Anti-tumor response of iExosomes in orthotopic models
(A) FC analyses and quantification of CD81 on exosomes under listed conditions, n=3 independent experiments. (B) Bioluminescence from Panc-1 orthotopic tumors over time, n=6 mice per group. (C) Kaplan-Meier curve of Panc-1 tumor bearing mice. Log-rank Mantel-Cox test, n=6 mice in each group. (D) Tumor bioluminescence at day 45, n=6 mice per group. One-way ANOVA. (E–J) Bioluminescence from Panc-1 orthotopic tumors over time depicting separate groups, from panel B, and Kaplan-Meier curve depicting the separate groups, from panel C, Log-rank Mantel-Cox test. n=6 mice per group. (K) Tumor bioluminescence at day 42, n=3 mice per group. Experimental groups compared to the PBS control group, one-way ANOVA. (L) Bioluminescence from Panc-1 orthotopic tumors over time (total flux), n=3 mice per group. (M) Luciferase activity at day 10 and day 42-post cancer cell (Panc-1) injection. (N) Surface lung nodules of KPC689 mice, n=8 mice per group. (O) Tumor weights (g: grams), n=8 mice per group, siKrasG12D iExo group is compared to other treatment groups, one-way ANOVA. (P) Bioluminescent KPC689 orthotopic tumors in nu/nu mice, n=8 mice per group. (Q) Tumor weights (g: grams), n=8 mice per group. (R) Kaplan-Meier curve of KPC689 nu/nu mice. Log-rank Mantel-Cox test, n=8 in each group. The data is presented as the mean ± SEM. Unless otherwise stated, unpaired two-tailed t test was used to determine statistical significance. ** p< 0.01, *** p<0.001, **** p<0.0001. See accompanying source data.
Extended Figure 7
Extended Figure 7. Pancreas localization and macropinocytosis promotes iExosomes uptake into tumor cells
(A) Quantification and representative pictures (scale bar: 100μm) of pancreas structure in KTC mice injected with exosomes with AF647 tagged siRNA, n=3 mice. (B) Quantification and representative images (scale bar: 100μm) of pancreas of mice injected with the indicated conditions, n=3 mice, unpaired two-tailed t test. (C) Representative images (scale bar: 50μm) for data presented in Fig. 3E–H. (D) Quantification of macropinocytic and exosomes uptake (independent experiment, identical statistical analyses). (E) AF647 RNAi-tagged exosomes/liposomes uptake in Panc-1 cells (scale bar: 100μm). n=3 independent experiments. (F) CM-DiI tagged CD47 k/o vs. WT exosomes uptake in Panc-1 cells (scale bar: 100μm). n=3 independent experiments. (G) CM-DiI tagged CD47 k/o vs. WT exosomes uptake in BxPC-3 cells (scale bar: 100μm). n=3 independent experiments. The data is presented as the mean ± SEM. Unless otherwise stated, one-way ANOVA was used to determine statistical significance. ns: not significant. * p<0.05, ** p< 0.01, *** p<0.001, **** p<0.0001. See accompanying source data.
Extended Figure 8
Extended Figure 8. Treatment of KTC GEMM with iExosomes
(A) Experimental scheme. (B) Accumulation of internalized AF647-tagged siRNA from exosomes (scale bar: 100μm). (C) Kaplan-Meier curve of KTC mice. PBS: n=8 mice, gemcitabine: n=5 mice. (D) Tumor burden at experimental end point (Control Exo: (n=7 mice), siKrasG12D iExo: (n=7 mice), shKrasG12D iExo: (n=5 mice)). One-way ANOVA. (E) H&E stained tumors (scale bar: 100μm) from KTC mice and relative percentages in histological phenotypes, n=4 mice per group. (F–G) Kaplan-Meier curve of KTC mice, n=3 mice per group, Log-rank Mantel-Cox test (F) and percent tumor burden (G). (H) Representative micrographs (scale bar: 100μm) of tumors immunolabeled for phosphorylated AKT, αSMA and Kras from 44 days old KTC mice in the indicated experimental groups (n=3 mice). Unless stated otherwise, unpaired two-tailed t test was used to determine statistical significance. * p<0.05, ** p< 0.01, **** p<0.0001. See accompanying source data.
Extended Figure 9
Extended Figure 9. Cytotoxicity and off target effect of iExosomes
(A) Change in the percentage of mouse body weights, pre- and post-treatment, in the listed groups and cohorts. (B) Mouse toxicity tests, consisting of BUN, AST and ALT in the listed groups. (C) Hematoxylin and eosin, and Kras immunostaining of the listed organs in KTC (early) mice. Three to five mice evaluated per organ, one-way ANOVA. The data is presented as the mean ± SEM. See accompanying source data.
Extended Figure 10
Extended Figure 10. iExosomes suppress pancreas cancer progression in KPC orthotopic mouse model
(A–B) Magnetic Resonance Imaging (MRI) of KPC orthotopic tumors n=9 mice per group (A) and each individual tumor (B). (C) Tumor volume as measured by MRI n=9 mice per group. One-way ANOVA. (D) Representative axial images. (E) Tumor weight (g: grams) at the experimental end point. siScrbl iExo: n=9 mice, siKrasG12D iExo: n=8 mice. (F) Change in the percentage of mouse body weights, pre and post treatment (endpoint), n=9 mice per group. (G) Representative gross images of two KPC orthotopic mice that died on day 16 PTS (siScrbl iExo) or was euthanized on day 16 PTS (siKrasG12D iExo). (H) KrasG12D transcript levels in KPC689 cells (n=3 independent experiments). One-way ANOVA. (I) Kaplan-Meier curve of KPC orthotopic tumor bearing mice, Log-rank Mantel-Cox test. siScrbl iExo group: n=9 mice, siKrasG12D iExo group: n=8 mice. (J) Macroscopic metastatic nodules, n=9 mice per group. (K) H&E stained tissues. Unless stated otherwise, the data is presented as the mean ± SEM and unpaired two-tailed t test was used to determine statistical significance. * p<0.05, ** p< 0.01, *** p< 0.001, **** p<0.0001. See accompanying source data.
Figure 1
Figure 1. CD47 on exosomes limits their clearance by circulating monocytes
(A) Fluorescence intensity in sucrose gradient layers from “Bottom-Up” method (see Supplementary Fig. 1E–F), (B) FC analysis of exosomes with AF647 tagged siRNA in the circulation (n=6 mice per group). (C) Quantification of PKH67 labeled exosomes in the indicated organs (n=3 mice) (D) FC analyses of pancreas cells 6 hours following injection of siKrasG12D Exos (n=5 mice), siKrasG12D Lipos (n=5 mice), and PBS (untreated, n=3 mice). (E) Quantification of Alexa 647+/CD11b+ monocytes in the blood 3 hours post i.p. injection. One way ANOVA: (Non treated, n=12 mice) vs (Liposomes, n=9 mice), IgG+siKrasG12D iExo (n=9 mice), anti-CD47 (B6H12)+siKrasG12D iExo (n=8 mice) and anti-CD47 (2D3)+siKrasG12D iExo (n=6 mice). Unpaired two-tailed t test: siKrasG12D iExo (n=13 mice) and (CD47high iExo, n=7 mice). Unpaired two-tailed t test: (mouse WT Exosomes, n=9 mice) and (mouse CD47 k/o exosomes, n=9 mice). The mean +/− SEM is depicted. Unless otherwise stated, one-way ANOVA was used. * p<0.05, ** p< 0.01, *** p<0.001, **** p<0.0001. FC: Flow cytometry; mo: mouse. See accompanying source data.
Figure 2
Figure 2. iExosomes restrains Panc-1 tumor growth
(A) Luciferase activity at day 7 and day 77-post cancer cell injection. (B) Tumor bioluminescence at day 77, PBS: n=4 mice, Control Exo: n=3 mice, shKrasG12D iExo: n=6 mice, shKrasG12D iLipo: n=4 mice, shScramble (Scrbl) iExo: n=5 mice, siScramble (Scrbl) iExo: n=5 mice. (C) Panc-1 orthotopic tumor growth (bioluminescence). PBS: n=7 mice, Control Exo: n=6 mice, shKrasG12D iExo: n=7 mice, shKrasG12D iLipo: n=4 mice, shScramble iExo: n=5 mice, siScramble iExo: n=5 mice. Representative H&E of the pancreas (scale bar: 100μm) is shown. (D) Relative pancreas mass (PBS, n=5 mice, Control exos, n=5 mice, shKrasG12D iExo, n=6 mice, shKrasG12D iLipo, n=4 mice, shScramble iExo, n=5, mice siScramble iExo, n=5, and normal healthy mice, n=5) mice. (E) Kaplan-Meier curve of Panc-1 tumor bearing mice, Log-rank Mantel-Cox test, PBS: n=7 mice, Control Exo: n=6 mice, shKrasG12D iExo: n=7 mice, shKrasG12D iLipo: n=4 mice, shScramble iExo: n=5 mice, siScramble iExo: n=5 mice. (F) p-ERK immunolabeling (scale bar: 100μm). Unpaired two-tailed t test, Control Exo: n=4 mice, shKrasG12D iExo: n=6 mice. (G) KrasG12D transcript levels in tumors, Control Exo (n=5 mice), or shKrasG12D iExo (n=6 mice), unpaired two-tailed t test. (H) Panc-1 orthotopic tumor growth, siScramble iExo (n=5) or siKrasG12D iExo (n=5). (I) Kaplan-Meier curve of Panc-1 tumor bearing mice. Log-rank Mantel-Cox test, n=5 mice per group. The mean +/− SEM is depicted. Unless stated otherwise, one-way ANOVA comparing experimental groups to control group (PBS) was used to determine statistical significance. * p<0.05, ** p< 0.01, *** p<0.001, **** p<0.0001, ns: not significant. See accompanying source data.
Figure 3
Figure 3. CD47 and macropinocytosis enhance iExosomes uptake and therapeutic efficacy
(A) Panc-1 orthotopic tumor growth, n=3 mice per group. (B) KPC689 orthotopic tumor growth, n=8 mice per group. (C) Kaplan-Meier curve, KPC689 orthotopic tumor bearing mice, Log-rank Mantel-Cox test, n=8 mice per group. (D) Confocal micrographs (scale bar: 100μm) of increased (preferential) entry of labeled exosomes into tumor tissue. (E) Macropinocytic uptake in Panc-1 or BxPC-3 cells, unpaired two-tailed t test. (F–G) Macropinocytic and exosomes uptake in BxPC-3 (unpaired two-tailed t test, F) or Panc-1 (one-way ANOVA comparing treated groups to non-treated group (0 μM EIPA, G) cells treated with vehicle (DMSO) or EIPA at the indicated concentrations (H) Macropinocytic and liposomes uptake, unpaired two-tailed t test. E, G, H: 5 distinct wells, F: 3 distinct wells. In E–H, scale bar: 50μm. The data is presented as the mean ± SEM. * p<0.05, ** p< 0.01, *** p<0.001, **** p<0.0001, ns: not significant. See accompanying source data.
Figure 4
Figure 4. iExosomes suppress pancreas cancer progression in KTC GEMM
(A) Kaplan-Meier curve of KTC (early treatment) mice, Log-rank Mantel-Cox test, siKrasG12D iExo: n=8 mice, Control exos: n=6 mice. (B) Kaplan-Meier curve of KTC mice, Log-rank Mantel-Cox test, siKrasG12D iExo: n=7 mice, shKrasG12D iExo: n=5 mice, Control exos: n=7 mice. (C) Tumor burden (early treatment) at end point. siKrasG12D iExo: n=8 mice, Control exos: n=6 mice. (D) Tumor burden at 44 days of age, n=3 mice per group. (E) H&E stained tumors (scale bar: 100μm, inset scale bar: 50 μm) from 44 days-old KTC mice and relative percentages in histological phenotypes, n=3 mice per group. (F) Masson Trichrome staining (MTS, scale bar: 100μm), TUNEL, Ki-67, and phosphorylated-ERK/CK-19 immunolabeling of 44 days-old KTC mice, n=3 mice per group. (G) KrasG12D transcript levels in tumors of age-matched (44 days old) KTC mice, n=3 mice per group. (H) Tumor volume at baseline (MRI), siKrasG12D iExo: n=6 mice, siScrbl iExo: n=6 mice. (I) Kaplan-Meier curve of KPC mice, Log-rank Mantel-Cox test, n=6 mice in each group. The mean ± SEM is depicted. Unless stated otherwise, unpaired two-tailed t test was used to determine statistical significance. * p<0.05, ** p< 0.01, *** p< 0.001, **** p<0.0001. See accompanying source data.

Comment in

References

    1. Hidalgo M, Von Hoff DD. Translational therapeutic opportunities in ductal adenocarcinoma of the pancreas. Clinical cancer research: an official journal of the American Association for Cancer Research. 2012;18:4249–4256. doi: 10.1158/1078-0432.CCR-12-1327. - DOI - PubMed
    1. Chang DK, Grimmond SM, Biankin AV. Pancreatic cancer genomics. Current opinion in genetics & development. 2014;24:74–81. doi: 10.1016/j.gde.2013.12.001. - DOI - PubMed
    1. Collins MA, et al. Oncogenic Kras is required for both the initiation and maintenance of pancreatic cancer in mice. The Journal of clinical investigation. 2012;122:639–653. doi: 10.1172/JCI59227. - DOI - PMC - PubMed
    1. Collins MA, et al. Metastatic pancreatic cancer is dependent on oncogenic Kras in mice. PloS one. 2012;7:e49707. doi: 10.1371/journal.pone.0049707. - DOI - PMC - PubMed
    1. Ying H, et al. Oncogenic Kras maintains pancreatic tumors through regulation of anabolic glucose metabolism. Cell. 2012;149:656–670. doi: 10.1016/j.cell.2012.01.058. - DOI - PMC - PubMed

Publication types

MeSH terms