. 2017 Jun 22;546(7659):492-497.
doi: 10.1038/nature22818. Epub 2017 Jun 7.

A retinal code for motion along the gravitational and body axes

Affiliations

A retinal code for motion along the gravitational and body axes

Shai Sabbah et al. Nature. .

Abstract

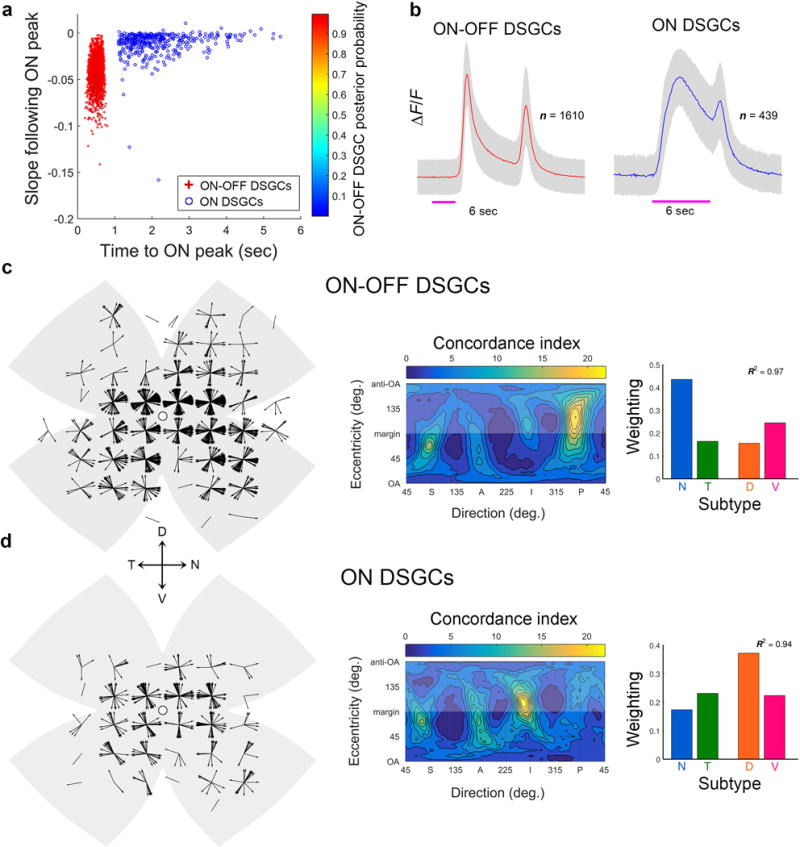
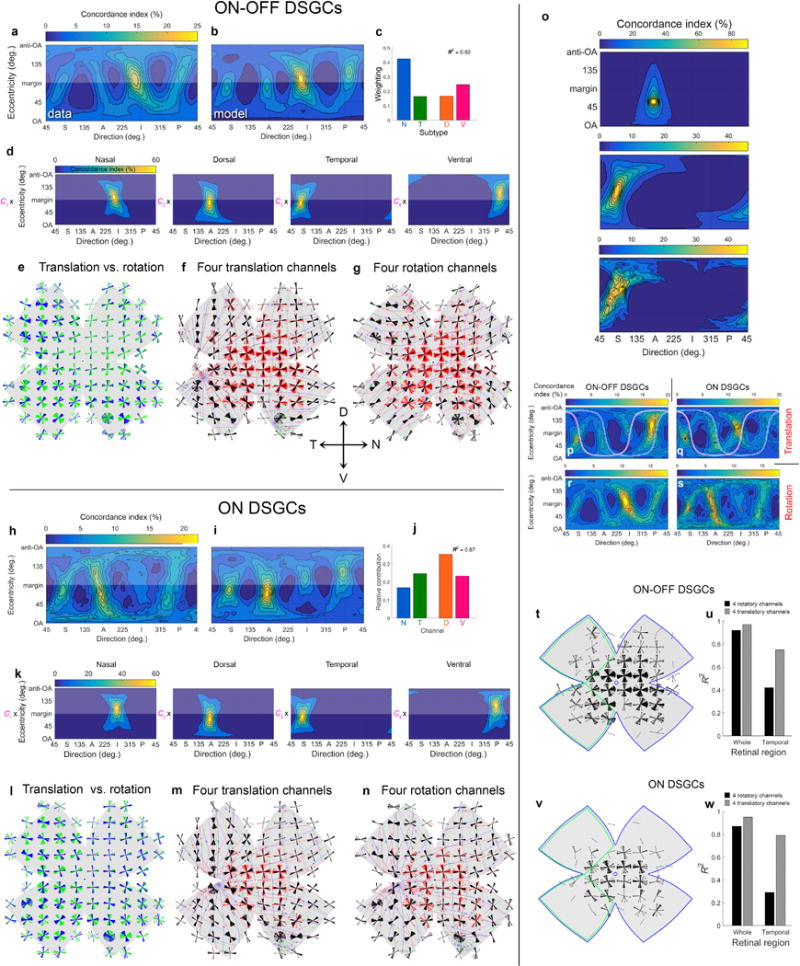
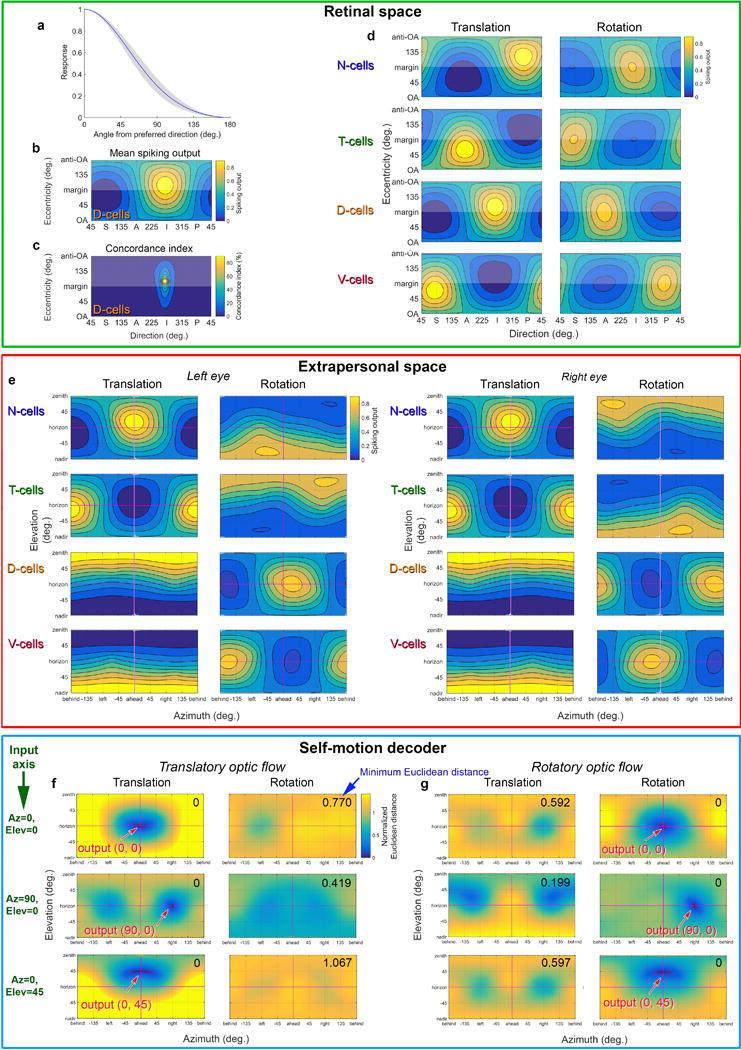
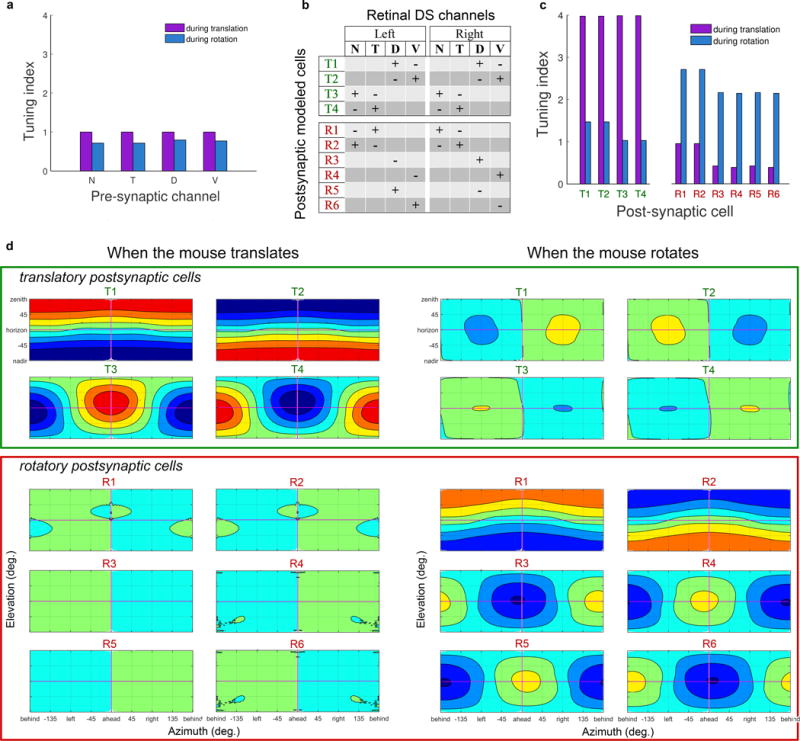
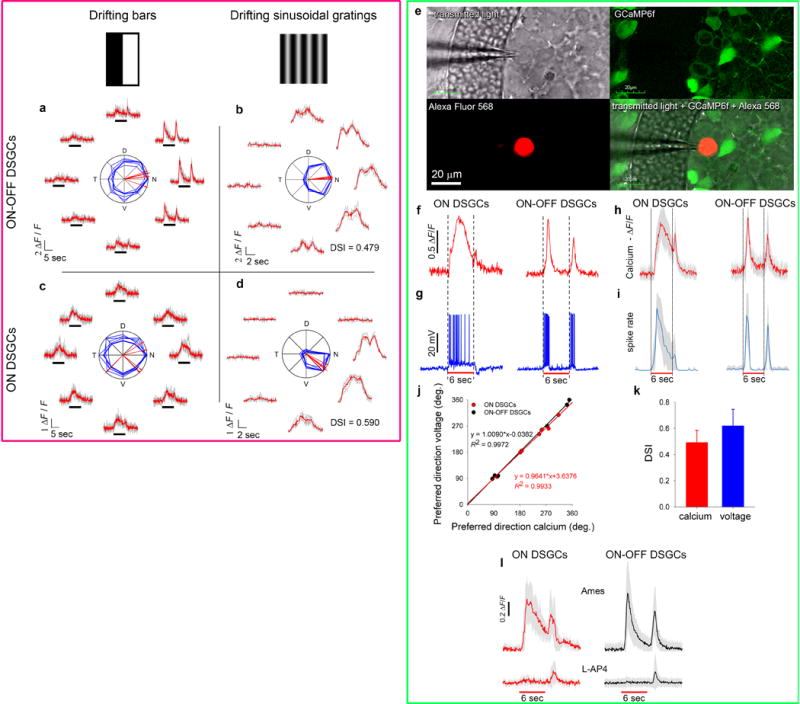
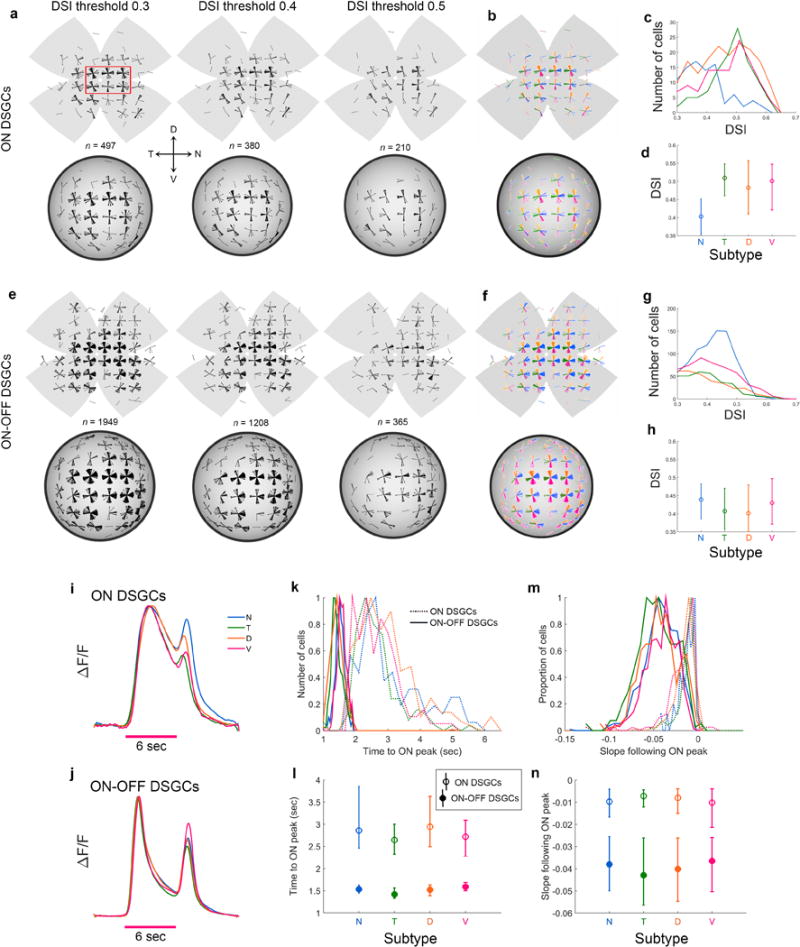
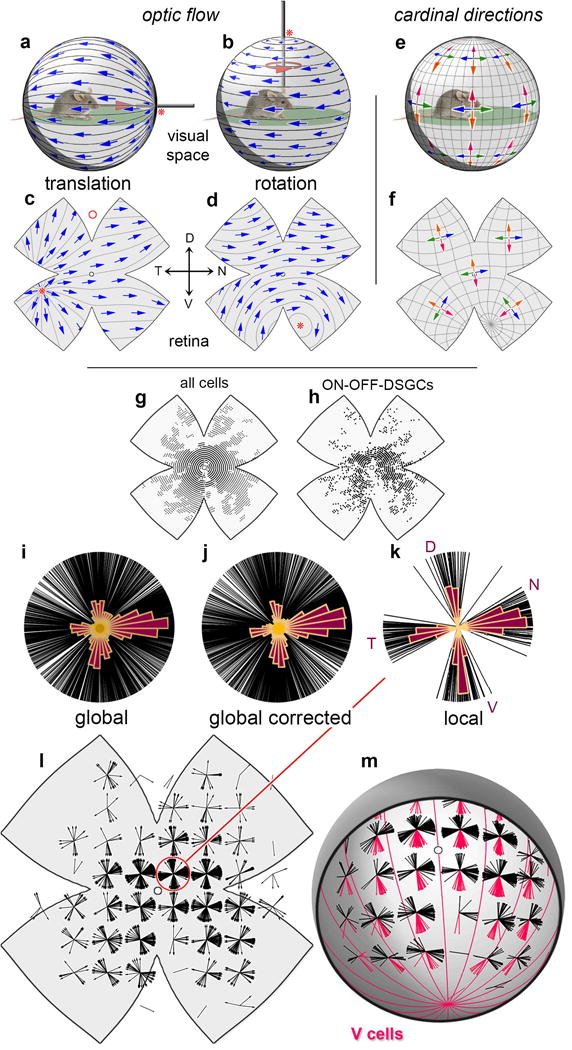
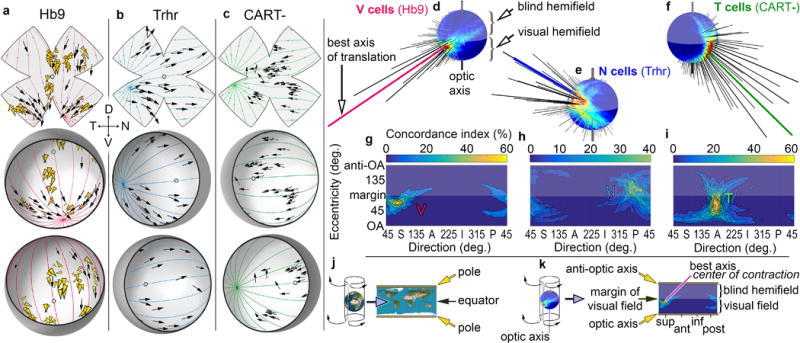
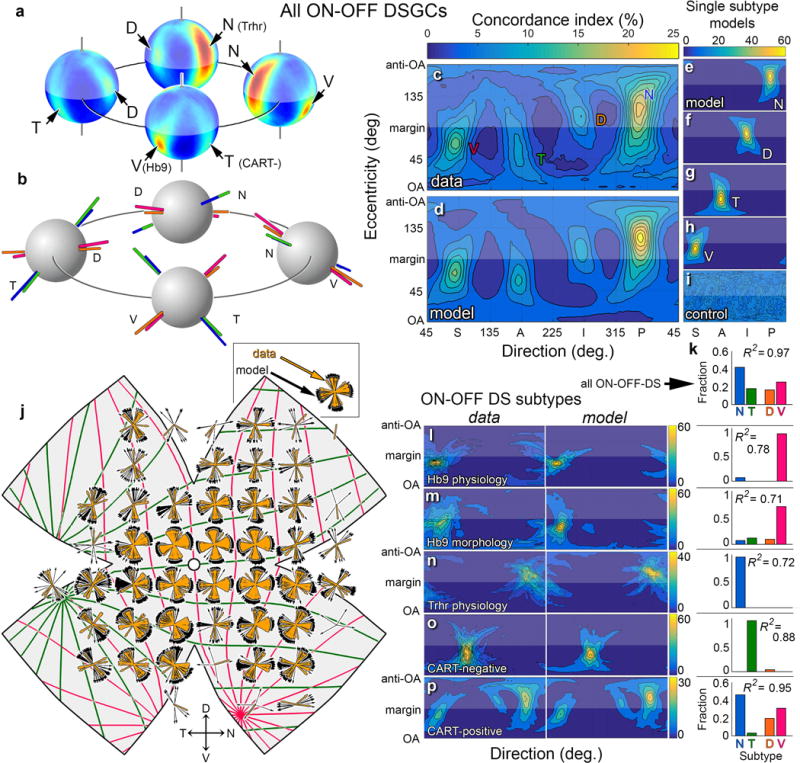
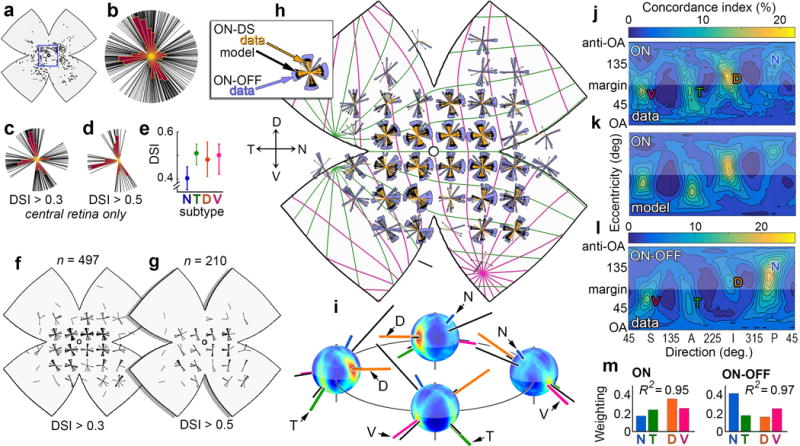
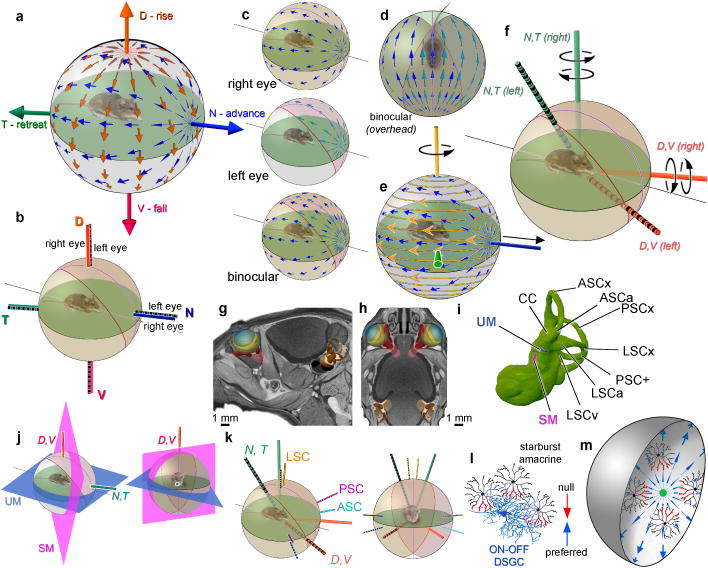
Self-motion triggers complementary visual and vestibular reflexes supporting image-stabilization and balance. Translation through space produces one global pattern of retinal image motion (optic flow), rotation another. We examined the direction preferences of direction-sensitive ganglion cells (DSGCs) in flattened mouse retinas in vitro. Here we show that for each subtype of DSGC, direction preference varies topographically so as to align with specific translatory optic flow fields, creating a neural ensemble tuned for a specific direction of motion through space. Four cardinal translatory directions are represented, aligned with two axes of high adaptive relevance: the body and gravitational axes. One subtype maximizes its output when the mouse advances, others when it retreats, rises or falls. Two classes of DSGCs, namely, ON-DSGCs and ON-OFF-DSGCs, share the same spatial geometry but weight the four channels differently. Each subtype ensemble is also tuned for rotation. The relative activation of DSGC channels uniquely encodes every translation and rotation. Although retinal and vestibular systems both encode translatory and rotatory self-motion, their coordinate systems differ.


Conflict of interest statement

The authors declare no competing financial interests.

Figures

Extended Data Figure 1
Extended Data Figure 1. Direction-selectivity of ON- and ON-OFF-DSGCs revealed by their calcium and voltage responses
a-d, Calcium transients of representative ON-OFF-DSGCs (a,b) and ON-DSGCs (c,d) in response to bright bars (a,c) or sinusoidal contrast gratings (b,d) drifting in eight directions at 45° intervals. Preferred direction and direction selectivity index (DSI) were determined from grating responses, cell class (ON- or ON-OFF-DSGC) from the bar responses. Traces plot somatic GCaMP6f Ca2+ signal over time; red = mean; gray = single trials. Black marker indicates when stimulus bar was within the cell’s receptive field. Polar plots show response amplitude (normalized to maximum) for each direction (bold curves = mean of four repetitions; thin = single trials). Red vectors show preferred direction (bold, mean; thin, single trials; N, nasal; D, dorsal; T, temporal; V, ventral). Direction-selectivity index (DSI) was higher for gratings than bars, especially for ON-DSGCs (Supplementary Note 9). ek, Morphological and functional validation of DSGC subtypes inferred from Ca2+ imaging. e, GCaMP6f fluorescence (top right) revealed DS tuning in a cell that was then targeted for patch recording (top left) and dye filling (bottom left; see Extended data Fig. 3i for representative morphological data). f,g, Calcium (f) and voltage (g) traces for representative ON- and ON-OFF-DSGCs in response to a drifting bright bar. h,i, mean calcium responses (h) and peristimulus time spike histograms (PSTH) (i) for patched ON- (n = 8) and ON-OFF-DSGCs (n = 6) in response to a drifting bright bar (gray bands: ±1 s.d.). The bar’s trailing edge evoked a small OFF Ca2+ transient in ON-DSGCs (h; see also f, left trace) and a very slight uptick in the PSTH (i). jk, DS preference inferred from Ca2+ signal closely matches that inferred from spiking for both ON-DSGCs (red) and ON-OFF-DSGCs (black) (j), despite having significantly broader tuning (k; lower DSI; paired t-test, t = −4.068, p<0.001). l, Bath application of a selective ON-channel blocker (L-AP4) abolished the ON response, but left an OFF transient of reduced amplitude in ON-DSGCs (n=10) and ON‐OFF-DSGCs (n=43) alike. OFF responses of ON-DSGCs are presumably mediated by excitatory input from OFF bipolar cells to the sparse OFF dendritic arbors of ON-DSGCs.
Extended Data Figure 2
Extended Data Figure 2. Anatomical analyses: correlating calcium with immunofluorescence, retrograde labeling, and morphological asymmetries
a-f, Correlating Ca2+ imaging and post-hoc immunofluorescence in a single imaged field. a, A 2‐photon image of GCaMP6f-expressing cells in live retina, in vitro. Numbers indicate regions of interest (ROIs) for assessing somatic DS responses. Cell-free zones are blood vessels. b-f, Confocal image of the same field after fixation, immunolabeling, and alignment with the live image (a). b, Immunolabeling for CART, a specific marker for 3 of 4 ON-OFF-DSGC subtypes (N-, V- and D-cells). c, Anti-GFP immunofluorescence, to enhance GCaMP6f signal which faded after fixation. d, Immunofluorescence for RBPMS, a marker for all RGCs. e,f, Merged images combining GCaMP6f (anti-GFP) signal with either RBPMS (e) or CART (f). g-j, Single imaged field demonstrating that identification of cells labeled by retrograde transport from the AOS can be linked to specific Ca2+-imaged cells. g, 2-photon image of GCaMP6f fluorescence in live retina in vitro; ROIs marked as in (a). h,i, Live confocal images of same field, showing (h) two cells retrolabeled from the MTNd (h; fluorescent cholera toxin beta-subunit, CTb) and GCaMP6f fluorescence (i). j, Merged image of h and i. k, Confocal images of coronal sections showing retrograde-tracer deposits (red) in 12 different mice, three mice each (#1-3) for four AOS targets (rows): superior fasciculus of the accessory optic tract (SF-AOT); inferior fasciculus of the AOT (IF-AOT); dorsal division of the medial terminal nucleus (MTNd); and nucleus of the optic tract (NOT). Far right column shows enlarged images from third column. These deposits spared retinorecipient nuclei outside the AOS, visible from nonspecific labeling by GCaMP6f fluorescence (green). ls, Structure and function of GFP-labeled DSGCs in Hb9-GFP mice. l. Voltage responses to drifting gratings (conventions as for Extended Data Fig. 1b,d). m,n, Spike responses to a bright bar moving in the preferred direction. Dashed line indicates roughly when the stimulus overlapped the receptive field. m, Voltage response of representative Hb9-GFP cell on a single trial. n, Mean peristimulus time histogram (PSTH) for all recorded Hb9-GFP cells (n = 32; 4 retinas). Gray band represents ±1 s.d. o, Preferred directions of all recorded GFP+ cells (n = 32 cells; 4 retinas). All point generally ventral, but scatter is substantial. (Arrow length not scaled to DSI). p-s, Dendritic asymmetry in Hb9 cells correlates with preferred direction. p, Typical Hb9 cell dye-filled during patch recording; maximum-intensity projected (MIP) confocal image. Blue vector indicates displacement of centroid of dendritic arbor (red dot) from the soma (black dot), a measure of the magnitude and direction of asymmetry. q, Dendritic asymmetry correlates strongly with physiologically determined DS preference (n = 12). r, Assessment of dendritic-field asymmetry in Hb9-GFP cells based on GFP fluorescence alone. In this MIP image, colored polygons show estimated dendritic-field envelopes for four cells. Vectors mark magnitude and direction of asymmetry as in (p). s, Polar plot of direction and magnitude of dendritic asymmetry among a large sample of Hb9-GFP cells (n = 82 cells; 3 retinas) estimated as in (r). Estimates made blinded to retinal location. Vector length indicates magnitude of arbor asymmetry (displacement of dendritic-field centroid from soma, normalized by the arbor circumference). Nearly all markedly asymmetric fields were displaced in a ventral direction from their somatic location, but with substantial scatter.
Extended Data Figure 3
Extended Data Figure 3. ON-DGSCs: Differentiation from ON-OFF-DSGCs by unsupervised clustering and projections to accessory optic system
a, DSGCs can be clustered into two classes (ON and ON-OFF) based on two parameters of Ca2+ responses to moving bars: 1) the latency of the ON peak (relative to the arrival of the bar at the receptive-field; assumes 300 μm field diameter and accounts for cell position within the imaged field); and 2) the slope of decay for 300 msec following the ON peak, a measure of the transience. Each cell is shown by a point colored to represent its posterior probability of belonging to the ON-OFF-DSGC cluster. Most cells are very likely to be one type or the other. bg, Average Ca2+ signals (ΔF/F ; mean [red] ± s.d. [gray]) evoked by light bar moving in the preferred direction for various samples of DSGCs (ON-OFF-DSGCs: red traces; ON-DSGCs: blue): b, all imaged DSGCs; c, morphologically identified (dye-filled) DSGCs; d, CART-immunopositive DSGCs (comprising mainly N-, D-, and V-type ON-OFF-DSGCs); e-g, DSGCs retrolabeled from three components of the AOS: superior (e) and inferior fasciculi (f) of the AOT, and dorsal division of the MTN (g). See Supplementary Note 10 for additional details. h, Representative morphology of ON-OFF-DSGCs (left) and ON-DSGCs (right) revealed by dye injection after Ca2+ imaging, and illustrated as MIP confocal images, projected onto the retinal plane (top) and an orthogonal one (bottom). ON-OFF-DSGCs stratify about equally in ON and OFF sublaminae; ON-DSGCs mainly in the ON sublamina. i-m, Ca2+ imaging of retrolabeled cells shows ON-DSGCs subtypes project differentially to AOS. Each panel includes DS preferences plotted on a standard flat retina with superimposed best-fitting optic flow for each subtype (left); translatory optic-flow-tuning plots (middle), one for the actual data [top] and a second for the best-fitting model [bottom]); and model-derived weighting coefficients (right), providing an estimate of relative subtype abundance. D- and V-cells selectively innervated the medial terminal nucleus (MTN) (i-k), while T- and N-cells supplied the nucleus of the optic tract (NOT)/dorsal terminal nucleus (DTN) (l). The superior fasciculus of the AOT (SF-AOT) apparently carries only D-cell axons (j), whereas the inferior fasciculus (IF-AOT) and dorsal MTN (MTNd) contain mixed V and D fibers (k) (but see). Thus, two cardinal translatory axes are separately represented in the AOS, one in the NOT/DTN and the other in the MTN.
Extended Data Figure 4
Extended Data Figure 4. Mapping cell locations in standard retinal coordinates
a, Representative experimental retina after GCaMP6f imaging (confocal image). Bright patches (mostly central) are GCaMP6f fluorescence. Magenta vectors show locations and DS preferences of imaged DSGCs. Four radial relieving cuts were made to promote flattening; blue circles mark their termini. The nasal and temporal cuts were made at medial and lateral rectus insertions; the line connecting these (the ‘horizontal reference line’) effectively parallels the horizontal plane in ambulating mice. Curl at retinal margins developed gradually and was taken into account. b, Map of estimated strain energy density, reflecting local stretching during flattening . c-f, Mapping of cell locations onto a standardized spherical coordinate system for pooling data across retinas and display in flattened (d) or hemispherical form (f). c, Data in (a) remapped into standardized spherical coordinates, followed by remapping into flattened form using modeled relieving cuts approximating the actual ones; close similarity to (a) indicates these transformations are accurate and reversible. d, Same as (c), but in the form of a standardized flat-mounted retina (four virtual radial cuts, 90° apart, extending 60% of the distance from retinal margin to optic disk). e,f, Schematic illustration of the mathematical approaches used for mapping to, and transformation between, coordinate systems. See Supplementary Equations. Parametrization x : Ω → R3 of the spherical retina S. s: arc length as measured from the optic disk. θ: the longitudinal coordinate; 0° corresponds to the nasal terminus of the horizontal reference line, 90° to the dorsal retina, and so forth. Four red meridional arcs show the reconstructed positions of the four radial cuts in (a) and (c). These have angular coordinates of θi and an arc length of Mmi. M was approximated from the flat-mount as the average length of lines extending from the optic disk to the retinal margin (green lines, including the curled portions in a). mi was estimated as the distance on the flat-mount from optic disk to the terminus of the corresponding radial cut [blue lines in (a), (e) and (f)]. Numerical reconstruction of the flat-mounted retina allowed empirical cell locations to be mapped to the spherical retina via the mapping x ◦ F−1.
Extended Data Figure 5
Extended Data Figure 5. Flow-tuning plots, correction for errors of rotatory orientation in vitro, and development of a flow-tuning model
a-d, Generation of flow-tuning plots. a, DS preferences of all imaged ON-OFF-DSGCs mapped onto standard flattened retina. Each black vector marks one cell’s location and preferred direction. How well do these DS preferences aligned with the local retinal optic flow produced by the mouse’s translation along specific axes? Two flow fields are shown (blue and red lines and arrowheads); many more were tested (2701 axes; 5° intervals of spherical angle). For each tested translation, we measured the angle θ between each cell’s preferred direction and the local direction of optic flow (inset: θ1 for the blue flow field, θ2 for the red one). N: nasal; D: dorsal; T: temporal; V: ventral. b, Distributions of angles θ1 (top) and θ2 (bottom) among all cells in a. Concordance index comprises the percentage of cells with DS preferences differing <10° from the local motion in a specific flow field (green rectangles). Alignment was much greater with ‘blue’ than ‘red’ optic flow (concordance index = 11.7 and 2.6, respectively). c, Spherical translatory-flow-tuning plot displaying concordance index as a function of the axis of the animal’s translation through space. Location of data for “blue” and “red” optic flows are indicated. d, Schematic representation of translatory optic flow induced in visual space (bottom hemisphere) and on retina (upper hemisphere) by animal’s (and eye’s) translation along the indicated axis (best axis of V‐cell subtype). Translation along the indicated axis yields flow with a center of contraction in the ventral retina (as for V-cells; Fig. 1m and 2a) and in the corresponding locus in superior visual field. e, Correcting for errors of rotatory orientation of retina in chamber. Flattened translatory-flow-tuning plots for ON-OFF-DSGCs in four different retinas with large samples of imaged cells. Plots are highly stereotyped in form, but exhibit some variation in phase (i.e., horizontal position; compare positions of hotspots to the arbitrary red vertical reference line). To correct for this experimental error, we phase-shifted each retina’s heat map (i.e., offset it along the x-axis) to produce the best match with a reference heat map (an average of the four maps in e). See Methods for details. f-i, Stepwise development of the model of global DS geometry. Note the progressive improvement in the agreement between the flow-tuning plots of modeled and actual imaged ON-OFF-DSGCs (j). f, Basic version of the model. Modeled DSGCs were uniformly distributed over the retina. DS preferences set to local flow produced by translation in one direction along one of two orthogonal axes, derived in Fig. 3b. g, After restricting modeled cells to the locations of actual imaged cells. Smearing of hotpots reflects degraded certainty about the position of the best axes due to undersampling of cells in retinal regions near the singularities (centers of expansion or contraction). h, After mimicking biological and experimental variability by adding angular noise (standard deviation = 10°) to the preferred directions of cells used in g. i, After accounting for the unequal abundances of subtypes by differentially weighting them before summation. Below: local polar plots of preferred directions of modeled DSGCs. Equivalent plots for cells in the final, refined model (i) are shown in Fig. 3j (black). k-n, Evidence for the predictive power of the model across data sets. ON-OFF-DSGC cells were arbitrary divided into two samples, a training set (flow tuning plot in k) and a test set (l). Best translatory axes derived from the training set were used to generate a 4-subtype translatory flow-matching model of the same form as in i. m, flow-tuning plot for these modeled cells closely resembles that for imaged cells in the test set (l; R2=0.95). n, A model with translatory axes derived from ON-OFF-DSGCs predicts the DS preferences of imaged ON-DSGCs cells (R2=0.83). Weighting coefficients giving the best fit recapitulated those from direct modeling of ON-DSGC (Fig. 4j,m). See Supplementary Note 11 for details.
Extended Data Figure 6
Extended Data Figure 6. Four ON-DSGC subtypes are still apparent when stringent criteria are used to distinguish them from ON-OFF-DSGCs
Even when we apply a more stringent criterion to differentiate ON- from ON-OFF-DSGCs, we detect four ON-DSGC subtypes rather than the expected three (Fig. 4). a, Cluster analysis identical to Extended Data Fig. 3a but including only cells very likely to belong to the ON- or ON-OFF-DSGC classes (posterior probabilities >0.95 of membership in one of the classes). This excluded 457 cells from analysis. b, Average calcium signals (ΔF/F; mean±s.d.) to moving bars for these stringently classified samples of ON-OFF-DSGCs (red traces) or ON-DSGCs (blue traces). See Extended Data Fig. 3c for details. c,d, Four subtypes remain evident in both ON DSGCs (d) and ON-OFF DSGCs (c) after application of the stringent classification criterion. These subtypes are evident in the four lobes of local polar plots of preferred direction (left) and in the four hotspots in the associated flattened translatory-flow-tuning plots (center). Bar plots (right) display the weighting coefficients of the best fitting model, a measure of the relative abundance of the four subtypes. These weighting coefficients were similar to those obtained using the standard posterior-probability criterion (>0.5), suggesting that the cells excluded due to the stringent criteria were distributed roughly equally across the four subtypes for each class.
Extended Data Figure 7
Extended Data Figure 7. Selectivity for direction varies among DSGC subtypes
a, Polar plots of local DS preference among ON-DSGCs, plotted on standard flat retinas (above) and in reconstructed hemispherical form (below). Increasing the stringency of the criterion for direction-selectivity index (DSI) from 0.3 to 0.5 reduced the number of N-cells (top left) by 95%, but other subtypes by only 42-60% (sample zone: red rectangle). Thus, N-type ON-DS cells are unusually poorly tuned, and may have been excluded on that basis in previous studies reporting only three ON-DSGC subtypes. b, Left panels of (a) reproduced with color coded subtypes. Each cell’s subtype assignment determined by which of the four cardinal translatory flow fields was most closely aligned with its preferred direction. N, blue; T, green; D, orange; V, magenta. c, Line histograms showing the distribution of DSIs among each ON-DSGC subtype. The distribution for N-type ON-DSGCs is shifted to lower DSI values. d, Median DSI and first and third quartiles for each ON-DSGC subtype. N-cells were significantly less well tuned. e-h, same analysis as ad, but for ON‐OFF DSGCs. There were significant differences among subtypes but the stringency of the DSI criterion did not affect the relative abundance of subtypes. i,j, Mean calcium responses (n=497) to preferred direction of bar motion of individual subtypes of ON‐DSGCs (i) and ON-OFF-DSGC (j). k,l, Histograms (k) and mean values (plus 1st and 3rd quartiles) (l) of latency to ON peak for each DSGC subtype, measured from estimated time of arrival bar edge at receptive field (see Methods). Latency differed significantly between each ON-DSGC subtype and its matching (homonymous) ON-OFF-DSGC subtype. m,n Histograms (n) and median plus 1st and 3rd quartiles (n) of the slope following the ON peak for each subtype of ON- and ON-OFF-DSGCs (see Methods). See Supplementary Note 12 for statistics and further details.
Extended Data Figure 8
Extended Data Figure 8. Direction preferences of both ON- and ON-OFF-DSGCs are better aligned with translatory optic flow fields than with rotatory ones
a, Flattened rotatory flow-tuning plot illustrating the concordance of DS preferences of all imaged ON‐OFF-DSGCs with rotatory optic flow fields as a function of rotatory axis orientation (plate carré projection; cf. Fig. 2j,k; Supplementary Note 13). b, Same as (a) but using modeled cells drawn from the best-fitting model. Model as for Extended Data Fig. 5i, but with subtypes (d) aligning DS preferences with rotatory instead of translatory optic flow fields (Supplementary Note 13). c, Weighting coefficients for the four subtypes in the best-fitting model. d. Rotatory-flow-tuning plots for the four individual rotatory-flow-matching subtypes used in the model, each with DS preferences aligned (±10° noise) with one of the four cardinal rotatory flow fields. e‐g, Local polar plots of DS preferences predicted for two sets of modeled DS cells, aligning their DS preferences either with translatory optic flow (Fig. 3d-h) or with rotatory optic flow [this figure, (b) and (d)]. e, Comparison of translatory and rotatory flow-matching models (green and blue polar plots, respectively). Predictions are similar in the central retina but diverge sharply in the periphery, especially ventrally and temporally. f, Observed preferred directions of imaged ON-OFF-DSGCs (red vectors; n = 1953) compared with those predicted by the model comprising four translatory-flow-matching channels (black vectors; n = 8100). g, Same as (f), but with preferred directions predicted from the rotatory-flow-matching model (black vectors; n = 8100). Optic flow preferred by each channel shown in pastel lines and arrowheads (N-cells, blue; D, green; T, red; V, magenta). h-n, Same as for (a-g), but comparing modeled and imaged ON‐DSGCs. o, Comparison of real and modeled responses to translatory and rotatory flow for an ensemble comprising a single ON-OFF-DSGC subtype (T-cells). Modeled cells were aligned with their respective canonical translatory optic flows and were uniformly distributed over the retina. Top: Response of modeled T-cell ensemble to translatory optic flow. Middle: Modeled ensemble response of same cells to rotatory optic flow. Bottom: same as middle, but for real imaged T-cells. p-s, Flow-tuning plots for all imaged ON-OFF-DSGCs (p,r) and ON-DSGCs (q,s) probed with translatory (p,q) or rotatory (r,s) flow. tw, Translatory-flow-matching model outperforms its rotatory equivalent overall, but especially temporally (green sector in t and v), where model predictions are most divergent (see e). u,w, Bar plots of R2 for fit to data of translatory (grey) and rotatory (black) models, assessed separately for the retina overall (left) or the temporal sample region alone. Similar trends were also apparent near the ventral translatory singularity (not shown).
Extended Data Figure 9
Extended Data Figure 9. Ensemble coding by DSGCs of all possible translatory and rotatory optic flows, mapped in retinal or global extrapersonal coordinates
a, Average directional tuning curve of imaged DSGCs (mean Ca2+ response, normalized to maximum, as a function of the angular offset from preferred directions). Tuning curves did not differ for ON- and ON-OFF-DSGC classes (see Methods). b, Flattened map of summed spike output of a single modeled ON-OFF-DSGC subtype — the D-cells — as a function of direction of the animal’s translation, expressed in retinal coordinates. Hotspot indicates location in retinal space of the center of contraction of the preferred translatory flow field (Supplemental Note 14). c, Alternative flow-tuning plot for the same subtype but plotting the concordance index (as elsewhere in this report; cf. Fig. 2d-k; Supplementary Note 14). d, Flow-tuning plots of estimated summed ensemble spike output for each of four modeled translatory-flow-matching DSGC subtypes in response to optic flow generated by translation along (left column) or rotation about any axis (right column). e, Same as (d) but remapped in extrapersonal space and shown separately for the left and right eyes. Azimuth of zero is anterior; elevation of 90º is overhead. Hotspots in maps for translatory optic flow (first and third columns) indicate the best egocentric direction of heading for activating that DS subtype ensemble (Supplementary Note 14). f, g, Decoder model showing the brain could discriminate rotatory from translatory optic flow and identify the axis of self‐motion by exploiting unique patterns of relative activation of the eight DS-channels (4 subtypes X 2 eyes) induced by specific optic flow fields. f. Left column: heat plots showing, as a function of axis orientation, the Euclidean distance (dissimilarity) between two patterns of relative activation of the eight DS channels induced by: 1) translation along that axis; and 2) translation along a single “input” axis (the unknown to be inferred by decoding, indicated at left, in green). Each probed axis is represented by a single pixel in the global map. Coldest color marks the coordinates in extrapersonal space of the axis of translation evoking 8‐channel outputs closest in Euclidean distance (black number, upper right), and thus highest in similarity, to the 8-channel outputs evoked by the reference (unknown) axis. Right column of plots: same as left except that the eight-channel outputs induced by the input translatory optic flow are now compared to those of the same eight channels when induced by rotation about any possible axis. The coldest spot in this plot marks the orientation of the rotatory axis producing an 8-channel output pattern most similar to that produced by translation along the input (unknown) axis. g, Same as (f) except that the input axis listed at left (the unknown) is an axis of rotation, rather than of translation. In each case, the flow field generating eight-channel outputs most like those induced by rotation about the input axis (minimum Euclidean distance and darkest blue) is rotatory (right column of plots), not translatory (left column), and the orientation of the best‐matching rotatory axis corresponds to that of the input axis of rotation. See Supplementary Note 14 for further explanation and interpretation.
Extended Data Figure 10
Extended Data Figure 10. Modeled postsynaptic cells differentially tuned for rotation or translation are easily generated by summing or subtracting specific DS channels in the two eyes
a, We devised a ‘tuning index’ to quantify the strength of tuning of single modeled subtype-ensembles for specific optic flow fields (Extended Data Fig. 9). The index consisted simply of the range of the Euclidean-distance values for the individual modeled DSGC ensembles. Individual DSGC subtype ensembles are nearly as well tuned to a specific axis of rotation as they are to their best axis of translation (Extended Data Figs. 8a,h; 9e). b, Design of a simple model for generating postsynaptic cells with a selective preference for translation over rotation (T1-T4), or for rotation over translation (R1-R6), through linear summation or subtraction of multiple DSGC channels in the two eyes (see Supplementary Note 15 for details on model design). c, Selectivity of modeled postsynaptic cell types for specific translations (T1-T4) or rotations (R1-R6), reflected in the tuning index as in a; note the enhanced discriminability of translation from rotation relative to the input DSGCs (a). d, Flattened spherical ensemble-output plots, showing variations in net excitation of specific modeled postsynaptic cell classes as a function of the axis of translation or rotation, all in egocentric (global) coordinates (see Extended Data Figure 9e). In heat maps, red and blue represent maximum and minimum channel activation, respectively. The model thus demonstrates that arithmetic combinations of signals from specific retinal DS channels could allow the brain to decompose optic flow into its translatory and rotatory components, paralleling the biomechanical decomposition of self-motion into these components by the vestibular labyrinth.
Figure 1
Figure 1. Directional preferences of ON-OFF-DSGCs are topographically dependent
a-d, Optic flow induced by animal’s translation (a,c) or rotation (b,d) (pink arrows) and illustrated as apparent motions (blue arrows) in the visual space around the animal (a,b) and projected onto the retina, after flattening (c,d). Asterisks: flow fields’ center of expansion (a,c) or rotation (b,d). Red circle in (c): DSGC receptive-field size. e,f, Inferred geometry of ON‐OFF‐DS preferences assuming cardinal directions remain orthogonal everywhere. One pair of types (orange, red) follows longitudinal (translatory-flow) geometry, the other (blue, green) latitudinal (rotatory-flow) geometry. g,h. Location of calcium-imaged cells (g) and imaged ON‐OFF-DSGCs (h). i-k, Polar plots of DS preference among imaged ON‐OFF-DSGCs, one line per cell. Polar histograms are overlaid. Cells pooled from whole retina (i, j) or only from the small circled central region (k). l, Topographic dependence of ON-OFF-DSGC local directional preferences, displayed as polar plots on a standardized flattened retinal map. m, Same as (l) but in reconstructed 3D view, corrected for histological distortions. Cells preferring ventral retinal movement (red lobes; ‘V-cell’ subtype) prefer motion toward a ventral singularity (center of contraction) and align with optic flow produced by downward translation (red meridians in [m]; cf. pink arrows in [e,f]).
Figure 2
Figure 2. Genetically defined ON-OFF-DSGC subtypes align DS preferences with translatory optic flow
a-c, DS preferences of molecularly defined ON-OFF-DSGC subtypes, assessed electrophysiologically (black arrows) and plotted on standard flattened (above) and reconstructed hemispheric retinas viewed from two perspectives (below). a, V-cells, preferring ventral motion, targeted in Hb9-GFP mice. Gold arrowheads indicate orientations of dendritic asymmetry. b, N‐cells, preferring nasal motion, targeted in Trhr-GFP mice. c, T-cells, preferring temporal motion, identified by immunonegativity for CART. Colored lines in (ac) indicate best-fitting translatory optic flow. dk, Quantitative assessment and cartographic representation of best translatory axes for DSGC ensembles. d. Concordance index (goodness of fit) as a function of axis of translation for recorded Hb9 V-cells, plotted as a spherical flow-tuning map. Optic axis (projection of optic disk into central visual field) points downward in this view. Hotspot and longest spike (red) point to visual-field location of the center of contraction of the translatory flow field best aligned with the direction preferences of sampled cells. g, Cartographically flattened (plate carré) projection of the flow-tuning plot in (d). The spherical (d) and flattened plots (g) both exhibit the same hot spot near the superior (S) edge of the visual field. Equivalent plots shown for N-cells (e,h; e is rotated 90° to display hotspot) and T-cells (f,i), with optimal optic flow either diverging from (N-cells) or converging at a singularity in the anterior visual field. j-k, Schematic explication of cartographic flattening of earth (j) or spherical translatory tuning plots (k) by plate carré projection.
Figure 3
Figure 3. Direction preferences of ON-OFF-DSGCs align globally with two axes of translatory optic flow
a, Spherical translatory-flow tuning plot for all ON-OFF-DSGCs, from four perspectives. Four hotspots are apparent, one per subtype (cf. Fig. 2d-f). b, Best translatory axes are aligned for D- and V-cells (orange; red), and for N- and T-cells (blue; green). c, Flattened version of translatory-flow-tuning plot in (a) (cf. Figs. 2g–k) is recapitulated by a model (dh) comprising four subtype ensembles (eh), weighted as in (k). i, Control flow-tuning map (randomized DS preferences). See Supplementary Note 3 for clarification. j, Local polar plots of DS preference for modeled cells (black) recapitulate the same topographic variations for imaged cells (gold). Colored meridians plot the two best-fitting translatory optic flows. lo, Left column: flattened flow-tuning maps for effectively pure single-subtype samples. l, m, V-cells (Hb9-GFP); n, N-cells (Trhr-GFP); o, T-cells (CART-immunonegative). p, Same, but for all subtypes but T-cells using CART-immunopositivity. Best-fitting models (right column of plots) reproduce the actual plots; optimal weighting factors (bar plots) confirm subtype purity.
Figure 4
Figure 4. ON-DSGCs unexpectedly match global geometry of ON-OFF-DSGCs: Four channels; four cardinal translatory directions
Locations (a) and DS preferences (b-d) of imaged ON-DSGCs. b, all cells; c,d, central retina (square in a). Four subtypes (lobes) are apparent in the central retina (c) but N-cells are less well-tuned for direction (e), so N-cell lobe vanishes under a more stringent tuning criterion (d,f,g). h, Topography of DS preference among ON-DSGCs (gold) resembles that of ON-OFF-DSGCs (purple) and of modeled ON-DSGCs (black) aligned with optimal orthogonal translatory optic flow fields (colored meridians). i, Spherical flow-tuning plot for all ON-DSGCs; four perspectives. Best axes for the four subtypes (colored) form two co-linear pairs defining two perpendicular cardinal translatory axes closely matching those of ON-OFF-DSGCs (black). j-m, Flow tuning plot for all ON-DSGCs (j) reveals four channels well described by the model (k) and closely resembling the equivalent plot for imaged ON-OFF-DSGCs (l) (from Fig. 3c) except for the relative weighting of channels (m).
Figure 5
Figure 5. Global geometry of retinal DS: ensemble coding of translatory and rotatory self-motion
a, Orientation of best translatory axes in extrapersonal space, roughly midaxial and gravitational. b, Orientation of best translatory axes is identical for both eyes; thus a single translatory optic flow optimally activates the N-cell ensemble in both the right and left eyes (c,d). e, Geometric basis of sensitivity of DS ensembles to rotatory optic flow. In central retina, “advance” or N-cells (blue arrows) align their preferences with optic flow (gold lines and arrowheads) produced by rotation around a vertical axis (gold) orthogonal to their best translatory axis (blue). f, Best rotatory axes of N- and T-cells (green) and V- and D-cells (orange) in the two eyes; left-eye axes striped. gi, MicroCT reconstruction of vestibular system in context from side (g), above (h), or in isolation (i). See Supplementary Note 7 for abbreviations. j, Relationship of cardinal DSGC translatory axes to otolithic planes. k, Relationship of best rotatory axes of DSGCs (thick) to those of semicircular canals (thin); axes for left eye and labyrinth are striped. l, Asymmetric starburst amacrine cell wiring underlying retinal DS. m, Current findings imply wiring asymmetries for a given DS subtype (blue) vary topographically and are oriented toward or away from a singularity.

Comment in

References

    1. Vaney DI, He S, Taylor WR, Levick WR. In: Motion Vision - Computational, Neural, and Ecological Constraints. Zanker JM, Zeil, editors. Springer Verlag; 2001. pp. 13–56.
    1. Wei W, Hamby AM, Zhou K, Feller MB. Development of asymmetric inhibition underlying direction selectivity in the retina. Nature. 2011;469:402–406. doi: 10.1038/nature09600. - DOI - PMC - PubMed
    1. Taylor WR, He S, Levick WR, Vaney DI. Dendritic computation of direction selectivity by retinal ganglion cells. Science. 2000;289:2347–2350. - PubMed
    1. Oesch N, Euler T, Taylor WR. Direction-selective dendritic action potentials in rabbit retina. Neuron. 2005;47:739–750. doi: 10.1016/j.neuron.2005.06.036. - DOI - PubMed
    1. Demb JB. Cellular mechanisms for direction selectivity in the retina. Neuron. 2007;55:179–186. doi: 10.1016/j.neuron.2007.07.001. - DOI - PubMed

Publication types