. 2017 Jul 6;547(7661):68-73.
doi: 10.1038/nature22354. Epub 2017 Jun 7.

Single-molecule analysis of ligand efficacy in β2AR-G-protein activation

Affiliations

Single-molecule analysis of ligand efficacy in β2AR-G-protein activation

G Glenn Gregorio et al. Nature. .

Abstract

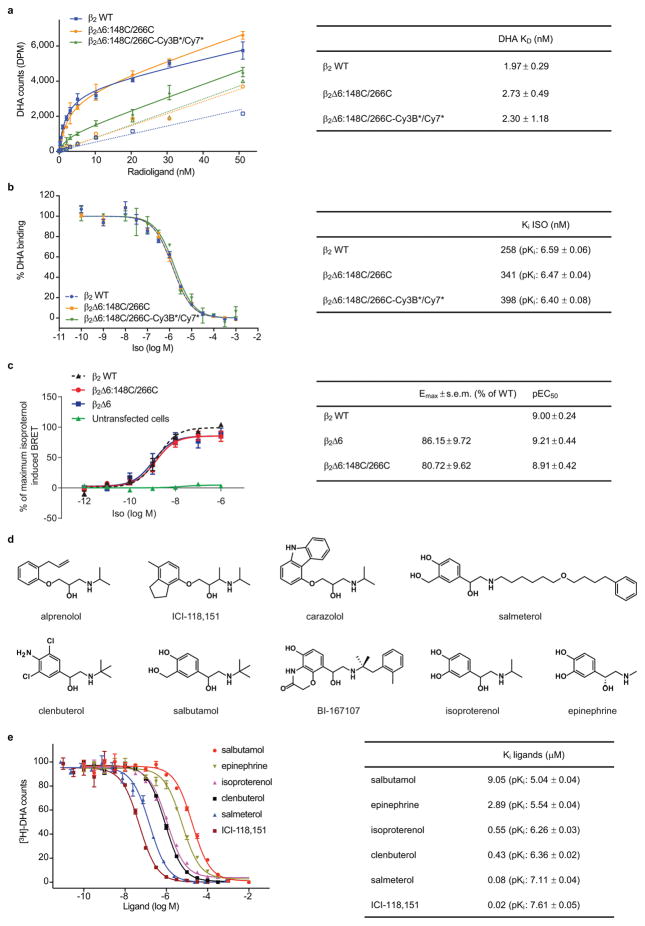
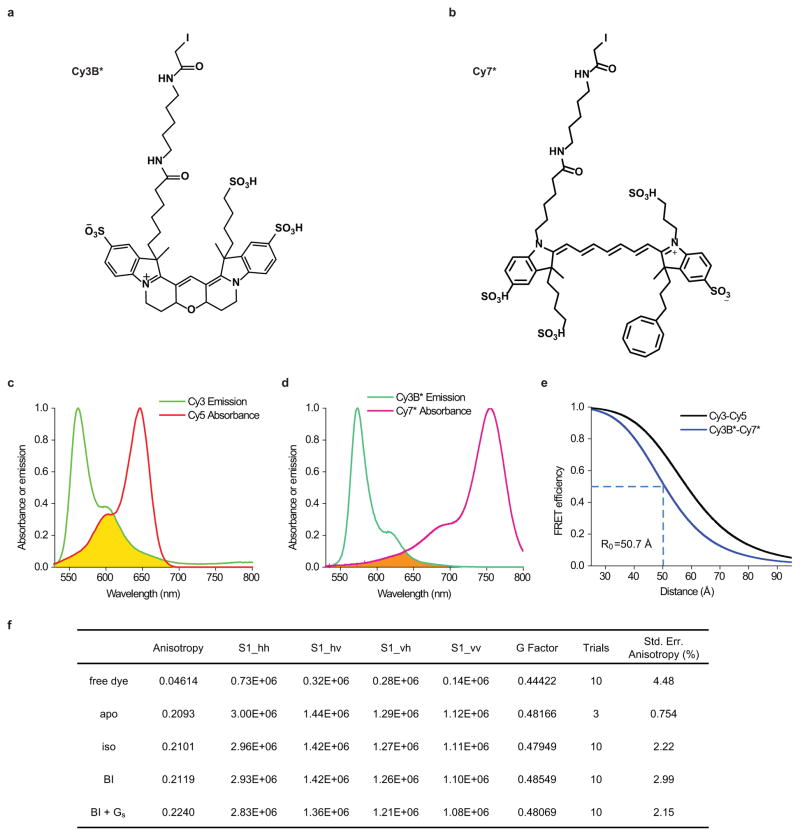
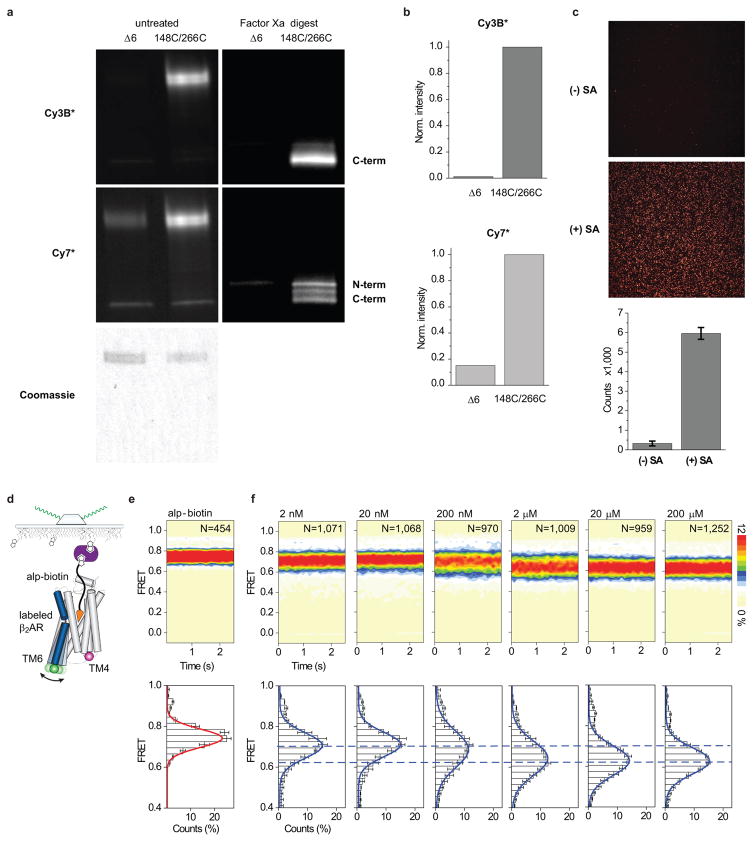
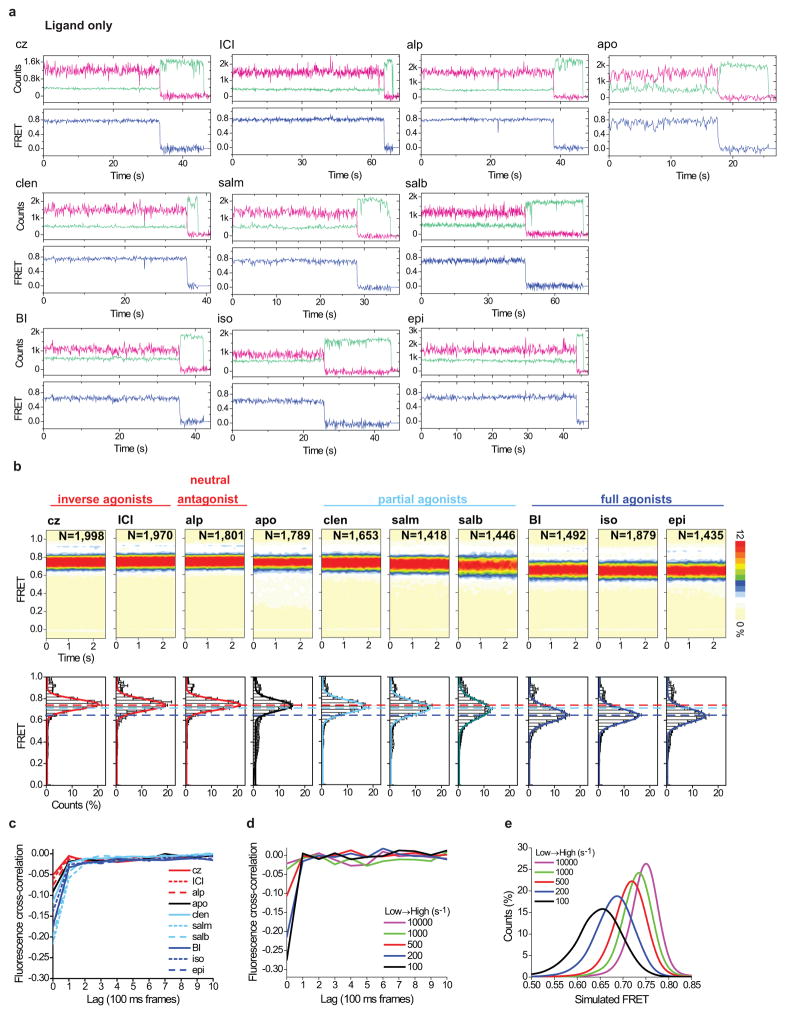
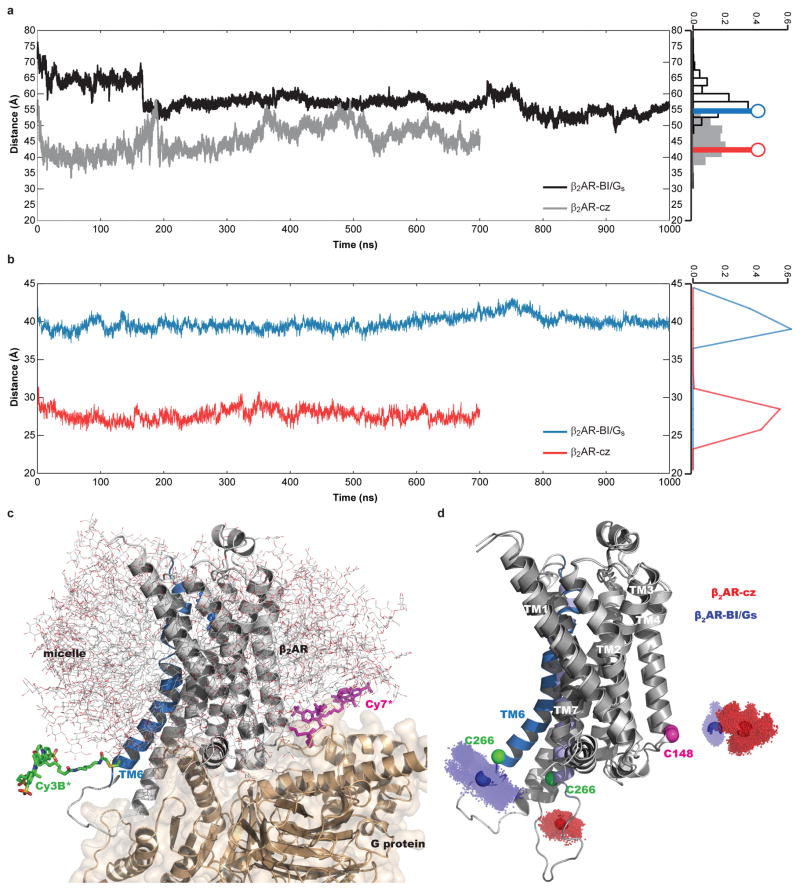
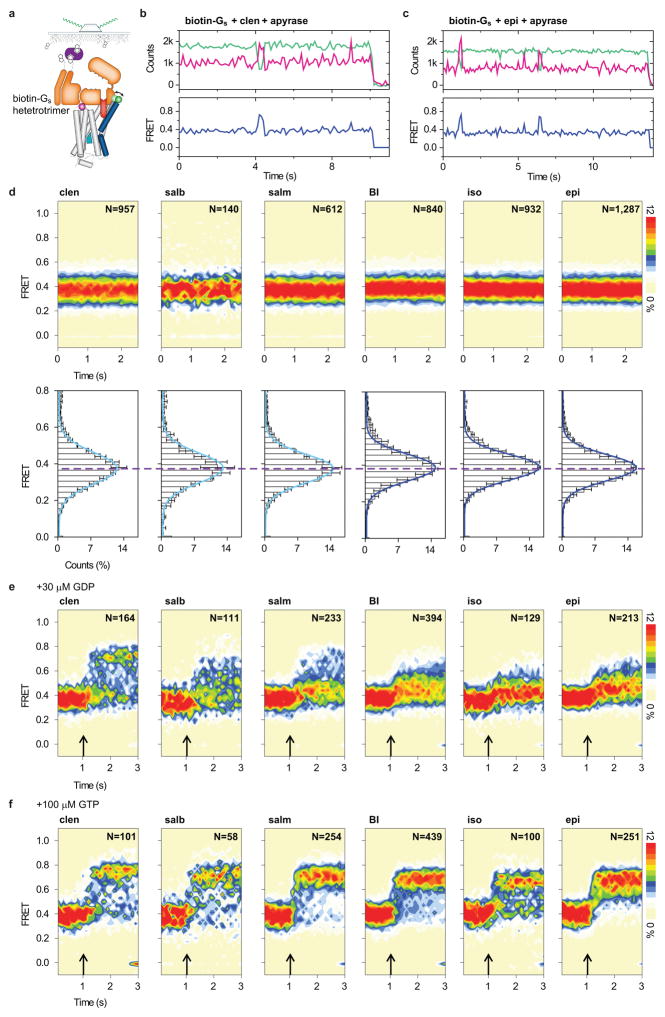
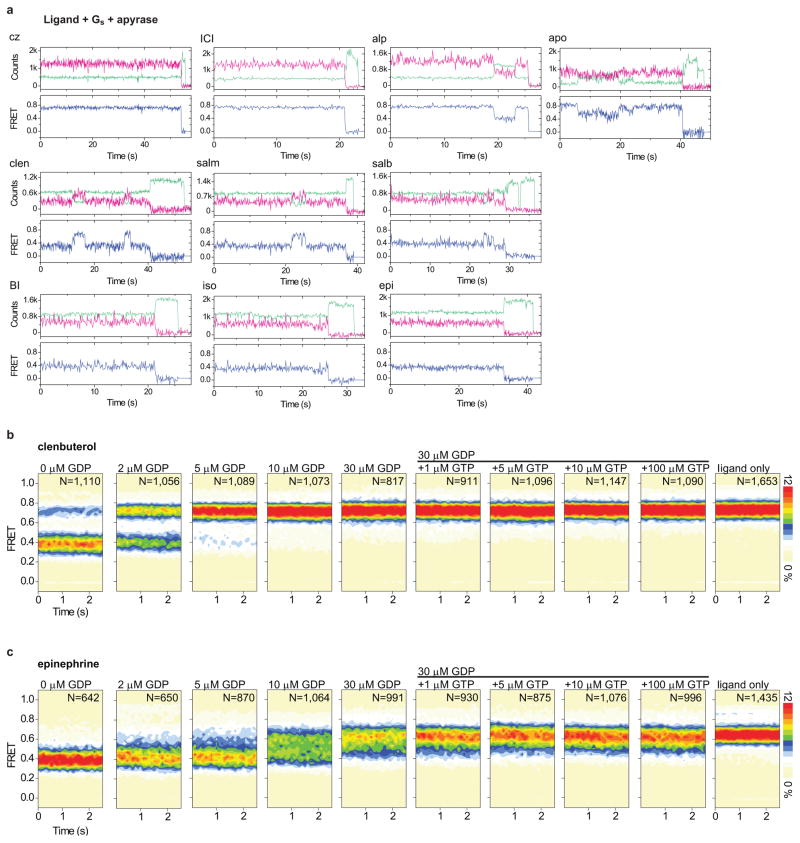
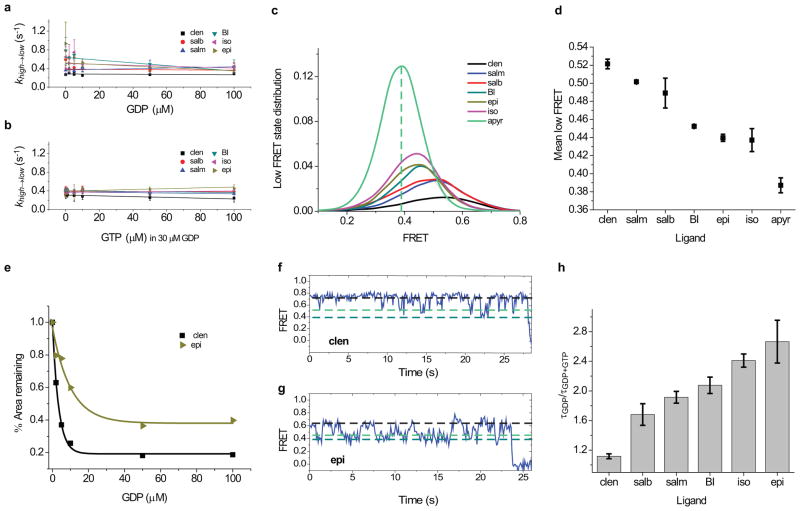
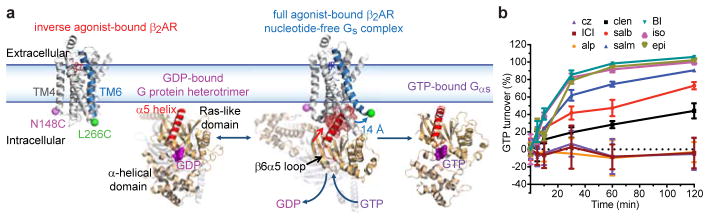
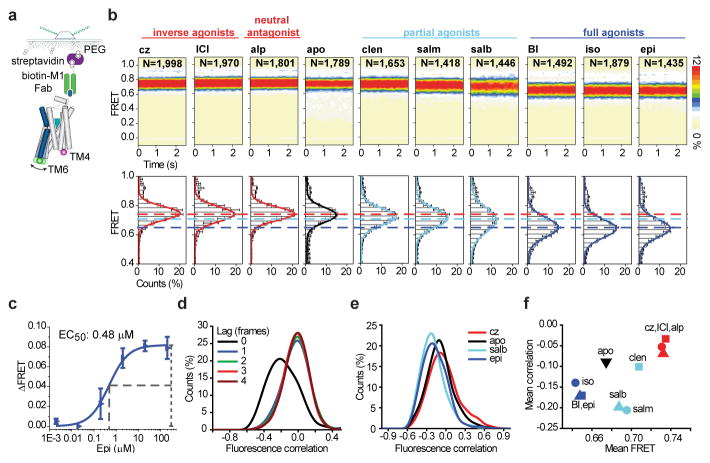
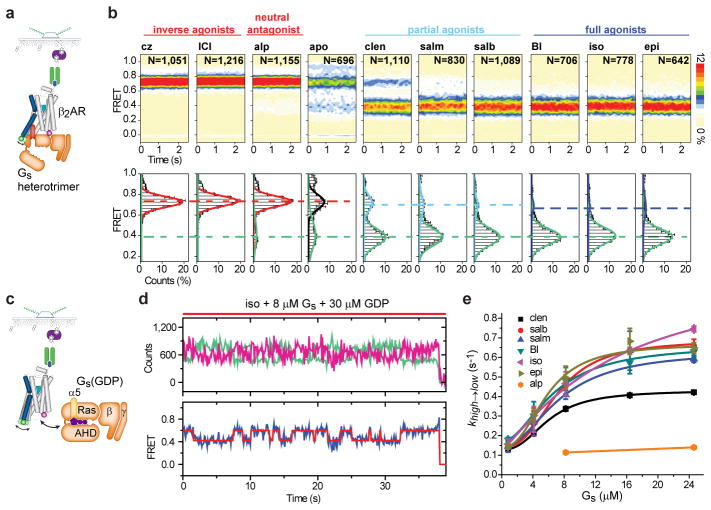
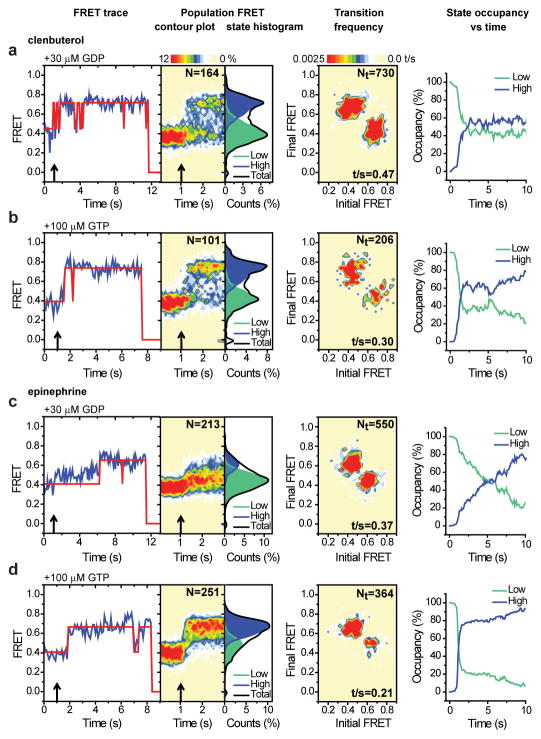
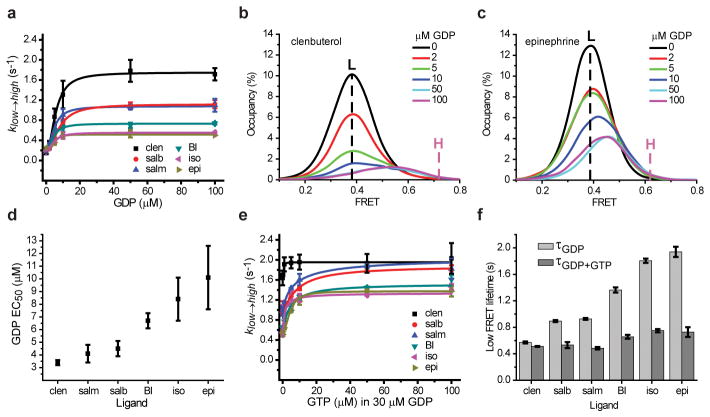
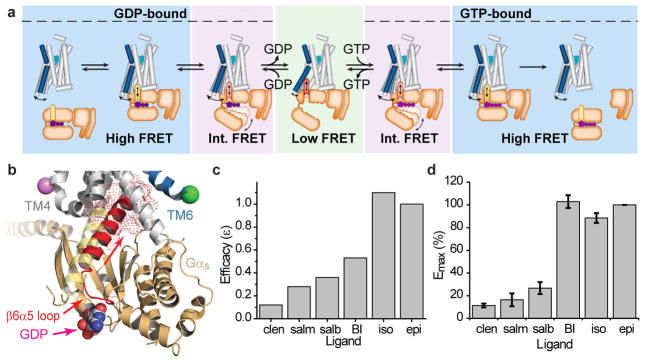
G-protein-coupled receptor (GPCR)-mediated signal transduction is central to human physiology and disease intervention, yet the molecular mechanisms responsible for ligand-dependent signalling responses remain poorly understood. In class A GPCRs, receptor activation and G-protein coupling entail outward movements of transmembrane helix 6 (TM6). Here, using single-molecule fluorescence resonance energy transfer imaging, we examine TM6 movements in the β2 adrenergic receptor (β2AR) upon exposure to orthosteric ligands with different efficacies, in the absence and presence of the Gs heterotrimer. We show that partial and full agonists differentially affect TM6 motions to regulate the rate at which GDP-bound β2AR-Gs complexes are formed and the efficiency of nucleotide exchange leading to Gs activation. These data also reveal transient nucleotide-bound β2AR-Gs species that are distinct from known structures, and provide single-molecule perspectives on the allosteric link between ligand- and nucleotide-binding pockets that shed new light on the G-protein activation mechanism.


Conflict of interest statement

The authors declare competing financial interest: details accompany the full-text HTML version of the paper (nature.com).

Figures

Extended Data Figure 1
Ligand binding properties of β2Δ6-148C/266C. a, [3H]-dihydroalprenolol (DHA) saturation binding on purified β2AR, comparing wild-type (WT; blue squares) versus unlabeled (orange circles) and labeled (green triangles) β2Δ6-148C/266C. Affinities (Kd) are shown in the table. Non-specific binding controls are shown as corresponding open symbols. Error bars represent the standard error of the mean (s.e.m.) from triplicate measurements. b, [3H]-DHA–iso competition binding on purified β2AR, comparing wild-type (WT; blue circles) versus unlabeled (orange squares) and labeled (green triangles) β2Δ6-148C/266C. Affinities (Ki) are reported in the table. Error bars represent the s.e.m. from triplicate measurements. c, Dose-response curves of the BRET-based cAMP biosensor CAMYEL with wild-type (WT) β2AR (black triangles) and the mutants β2Δ6 (blue squares) and β2Δ6-148C/266C (red circles). Data from untransfected cells are shown in green triangles. Data from five independent experiments were normalized to the maximal isoproterenol response by WT β2AR in each experiment and globally fit to the entire data set, with the error bars representing the s.e.m., as reported in the table. d, Skeletal structures of ligands used in the current study. e, [3H]-DHA competition binding on unlabeled β2Δ6-148C/266C for ligands used in the current study, except for cz and BI, for which the ultra-high affinities reported (32 pM and 84 pM, respectively) would not allow us to determine them accurately in our assay. Instead, we used concentrations of 1 μM for both in all our measurements. The calculated Kis are shown on the table.
Extended Data Figure 2
Fluorophore structures and properties. a–b, Skeletal structures of the modified Cy3B* donor (a) and Cy7* acceptor (b) fluorophores. c–d, Normalized donor fluorophore emission (Cy3: green; Cy3B*: dark green) and acceptor fluorophore absorbance (Cy5: red; Cy7*: dark magenta) spectra for Cy3/Cy5 (c) and Cy3B*/Cy7* (d) FRET pairs. The spectral overlap integral (shaded region) was calculated and used to determine the Förster distance (R0) values for each pair. e, Inter-dye FRET efficiencies of the Cy3/Cy5 (black) and Cy3B*/Cy7* (blue) donor and acceptor fluorophore pairs as a function of inter-dye distances calculated based on R0 values. f, Bulk anisotropy measurements on Cy3B*-labeled β2Δ6-148C/266C.
Extended Data Figure 3
smFRET experimental controls. a, Site-specific labeling. SDS-PAGE gels under green (540 nm) or near IR (740 nm) epi-illumination for fluorescence visualization of Cy3B* or Cy7* labeling of β2Δ6 and β2Δ6-148C/266C. Coomassie-stained gel image is shown as a gel-loading control. Digestion with Factor Xa protease and deglycosylation with PNGase F leads to separation of the 148C and 266C labeling sites on generated N-terminal and C-terminal fragments, respectively. For gel source data, see Supplementary Figure 1. b, Quantification of Cy3B*/Cy7*-labeling specificity of full-length β2Δ6-148C/266C. Data is normalized to β2Δ6-148C/266C labeling. c, Specificity of streptavidin-mediated receptor immobilization. Frame capture from immobilization movies showing labeled β2Δ6-148C/266C on streptavidin-free (-SA) or streptavidin-coated (+SA) surfaces. Bar graph shows the number of immobilized, labeled β2AR in these conditions. Error bars represent the standard deviation from two replicates. d, Schematic of labeled β2AR immobilization via biotinylated alp (alp-biotin). e, FRET population contour plot and histogram for alp-biotin-immobilized receptor shows correspondence with the FRET population distribution of biotin-M1-Fab-immobilized, alp-bound, labeled β2AR (Fig. 2b). Histogram error bars represent the standard deviation from four replicates with N total molecules analyzed. f, FRET population contour plots (top row) and histograms (bottom row) for epi titration on biotin-M1-Fab-immobilized, labeled β2Δ6-148C/266C (Fig. 2c). Dashed lines (blue) highlight the mean FRET values for the lowest (2 nM; top dashed line) and highest (200 μM; bottom dashed line) epi concentrations tested. Histogram error bars represent the standard deviation from three replicates with N total molecules analyzed. The scale bar on the right indicates relative populations for the contour plots.
Extended Data Figure 4
a, Sample fluorescence (green for Cy3B*; magenta for Cy7*) and FRET (blue) time traces for biotin-M1-Fab-immobilized, labeled β2Δ6-148C/266C imaged in the absence and presence of saturating ligands. b, Same as Fig. 2b but with the full FRET efficiency range (0–1) shown for the population histograms (bottom row). c, Plots showing the mean cross correlation values of donor and acceptor fluorescence as a function of lag time for the ensemble of individual fluorescence traces obtained from experiments shown in Figure 2b. d, Plots showing the mean cross correlation values of donor and acceptor fluorescence as a function of lag time for an ensemble of simulated fluorescence trajectories rapidly fluctuating between high (0.75) and intermediate (0.55) FRET values with varying low- to high-FRET transition rate constants (colored lines), where the high- to low-FRET transition rate is held constant at 100 s−1 (Methods). e, FRET distributions of the simulated data, as described in panel d.
Extended Data Figure 5
All-atom molecular dynamics simulations of the Cy3B*/Cy7*-labeled β2AR in a detergent micelle. a, Time evolution of the distance between the dyes. Time dependence of the distances between the midpoints of the dyes along the simulation trajectories is shown for the β2AR-cz (gray) and β2AR-BI/Gs (black) systems. The distributions are displayed as histograms on the right; gray bars: β2AR-cz; clear bars: β2AR-BI/Gs. The estimated inter-dye distances derived from the experimental mean FRET values (Figs. 2b,3b; Extended Data Fig. 2e) are indicated by solid lines topped with circles (β2AR-cz: red; β2AR-BI/Gs: blue). b, Time evolution of the distance between Calpha carbons at the labeling site. Calpha-Calpha distances for β2AR-cz: red and β2AR-BI/Gs: blue. c, The simulated dye-tethered β2AR-BI/Gs system embedded in a DDM micelle (gray sticks). β2AR is rendered in gray, with TM6 and the agonist (BI) highlighted in blue. The Gs protein is rendered in wheat color surrounded by its molecular surface to indicate the excluded volume for dye movements. The Cy3B* and Cy7* dyes are colored green and magenta, respectively. Water molecules, ions, and detergent molecules distant from the β2AR structure are omitted. d, Positions explored by the midpoints of the dyes during the simulations are shown as clusters of dots in the context of the β2AR-cz (transparent red dots) and β2AR-BI/Gs (transparent blue dots) complexes; the center of mass of each collection of dots is indicated by a solid sphere. Calpha carbons for labeled positions 1484.40 and 2666.28, are shown as magenta and green spheres, respectively.
Extended Data Figure 6
smFRET imaging of biotin-Gs-immobilized, labeled β2AR. a, Schematic of labeled β2AR immobilization via biotinylated Gs heterotrimer. b–c, Representative fluorescence (green for Cy3B*; magenta for Cy7*) and FRET (blue) time traces for biotin-Gs-immobilized, labeled β2Δ6-148C/266C imaged in the presence of clen (b) or epi (c) in nucleotide-free conditions (apyrase-treated). d, FRET population contour plots (top row) and histograms (bottom row) for biotin-Gs-immobilized β2Δ6-148C/266C imaged in the presence of partial and full agonists in nucleotide-free conditions. The dashed line indicates the invariant mean FRET value (~0.38) for all agonists tested. Histogram error bars represent the standard deviation from three replicates with N total molecules analyzed. e–f, FRET population contour plots of biotin-Gs-immobilized β2Δ6-148C/266C in the presence of agonists exhibiting FRET transitions upon rapid addition (arrow) of 30 μM GDP (e) or 100 μM GTP (f). Scale bar on the right indicates the relative population for the contour plots.
Extended Data Figure 7
a, Sample fluorescence and FRET time traces for biotin-M1-Fab-immobilized, labeled β2Δ6-148C/266C imaged in the absence and presence of saturating ligands plus 8 μM Gs in nucleotide-free (after apyrase treatment) conditions. b–c, FRET population contour plots for biotin-M1-Fab-immobilized, labeled β2Δ6-148C/266C imaged in the presence of the agonists clenbuterol (b) or epinephrine (c), 8 μM Gs and increasing concentrations of GDP (Fig. 5a) or GTP in the presence of saturating GDP (30 μM) (Fig. 5e) with N indicating the total number of molecules analyzed from two replicates. Nucleotide-free (0 μM GDP; from Fig. 3b) and ligand only (from Fig. 2b) conditions are included as references. Scale bar on the right indicates the relative population for the contour plots.
Extended Data Figure 8
a–b, Transition rates from high- to low-FRET states (khigh→low) of labeled β2AR with different agonists, saturating Gs (8 μM) and increasing GDP concentrations (2–100 μM)(a) or increasing GTP concentrations (0–100 μM) in 30 μM GDP (b). c, Low-FRET state distributions for labeled β2AR with different agonists in 100 μM GDP and saturating Gs showing their overlap with the distribution in the presence of epi and saturating Gs in nucleotide-free conditions (apyr) (Fig. 3b). The dashed line shows the mean FRET value for apyr. d, Mean low FRET values from c. e, The percent change in the area of the low-FRET state population distributions for clen (black squares) and epi (dark yellow triangles)(as shown in Fig. 5b and c, respectively) was plotted with increasing GDP concentration (0–100 μM) and fitted to a single exponential decay function to derive the GDP EC50. f–g, Sample FRET traces (blue line) of labeled β2AR in the presence of clen (f) or epi (g) plus 100 μM GDP and saturating Gs. Dashed lines indicate each ligand’s corresponding mean high FRET value (black), mean low FRET value (light green) and mean FRET value in nucleotide-free conditions (dark green). h, The ratio of the low-FRET state lifetime of β2AR in the presence of saturating Gs and GDP (τGDP) over the low-FRET state lifetime in saturating GTP plus 30 μM GDP (τGDP+GTP)(Fig. 5f) is shown for different agonists. All error bars in the figure represent the standard deviation from two replicates.
Figure 1
Figure 1
High-resolution perspective of β2AR-Gs activation. a, Labeling sites N148C (magenta) in TM4 and L266C (green) in TM6 (blue) are shown on the inactive β2AR structure (PDB:2RH1). Agonist activation leads to outward TM6 displacement (~14Å) and Gs coupling (shown GDP-bound Gi; PDB:1GP2). Within the GDP-free complex the α5 helix (red) of Gαs (wheat) engages the cytoplasmic face (red mesh) of β2AR (PDB:3SN6). GTP binding causes Gαs (PDB:1AZT) and Gβγ subunit (not shown) to separate. b, Ligand efficacy profiles determined using a GTP turnover assay (Methods; error bars=s.e.m., 3 replicates).
Figure 2
Figure 2
The extent of TM6 motions correlate with efficacy. a, Schematic of ligand binding experiments (Methods). b, Population FRET contour plots (top; scale bar=relative population) and cumulative population histograms (bottom; error bars=s.d., 3 replicates with N total molecules). Dashed lines indicate the distinct mean FRET values observed. c, Apparent EC50 for epinephrine (Methods; error bars=s.d., 3 replicates). d, Pearson’s correlation histograms (Methods) describing anticorrelated donor and acceptor fluorescence fluctuations in epinephrine with increasing donor lag time. e, Comparison of zero-lag Pearson’s correlation histograms for representative ligands. f, Scatter plot of mean FRET efficiencies vs. mean correlation coefficients observed for each ligand.
Figure 3
Figure 3
Ligand efficacy affects β2AR-Gs coupling efficiency. a, Schematic of Gs-coupling experiments (Methods). b, Population FRET contour plots (top; scale bar=relative population) and cumulative population histograms (bottom; error bars=s.d., 2 replicates with N total molecules) observed for apyrase-treated (nucleotide free) β2AR-Gs complexes. Dashed lines show correspondence between high- and low-FRET values. c, Schematic of Gs titration experiments (Methods). d, Example fluorescence (donor [light green]; acceptor [magenta]), and FRET (blue) time traces overlaid with predicted state sequence (red) in the presence of iso, GDP and Gs. e, Transition rates from high- to low-FRET states (khigh→low; error bars=s.d., 2 replicates) with increasing Gs(GDP) concentrations.
Figure 4
Figure 4
Pre-steady state measurements of nucleotide binding to clen- and epi-bound β2AR-Gs complexes. a–d (panels from left to right), Sample FRET traces (blue) with state idealizations (red line) following nucleotide addition (arrow). Population FRET contour plots (scale bar=relative population; N=total molecules) before and after nucleotide addition (arrow). Population histograms showing the relative occupancies of low- (green) and high- (blue) FRET states post-nucleotide addition. Transition density plots displaying the mean FRET values before (x axis) and after (y axis) each transition (scale bar=transitions per second t/s; Nt=total transitions). Time-dependent changes in the relative occupancies of low- (green) and high- (blue) FRET states.
Figure 5
Figure 5
Nucleotide exchange efficiency is ligand dependent. a, Transition rates from low- to high-FRET states (klow→high) with agonists, Gs and increasing GDP concentrations. b–c, Low-FRET state distributions with increasing GDP in Gs and clen (b) or epi (c). Vertical dashed lines indicate the mean low-FRET value observed without GDP (black; L) and the mean high-FRET value at 100 μM GDP (purple; H). d, Apparent EC50 for GDP binding to the β2AR-Gs complex with different agonists. e, Transition rates from low- to high-FRET states (klow→high) with agonists, Gs, GDP, and increasing GTP concentrations. f, Histograms of low-FRET state lifetimes (τ) for each agonist with Gs and saturating GDP (light gray) or saturating GTP and GDP (dark gray). Error bars represents s.d. (two replicates) except (d), which represents s.e.m.
Figure 6
Figure 6
Proposed kinetic framework underlying β2AR-Gs coupling and nucleotide exchange. a, Schematic of β2AR TM6 conformational states within the G protein activation cycle (Note: the low-FRET β2AR-Gs(GTP) complex was not experimentally observed but is inferred). b,s α5 helix engaging the intracellular face of β2AR disrupts helix-proximal β6α5 loop interactions with GDP. c, Ranking of agonist molecular efficacies (ε) relative to epi in terms of the effective rate of generating Gs(GTP) from Gs(GDP) (Methods). d, Ligand efficacy-based cAMP measurements in living cells (Methods; error bars=s.e.m, 3 replicates).

Similar articles

Cited by

References

    1. Pierce KL, Premont RT, Lefkowitz RJ. Seven-transmembrane receptors. Nat Rev Mol Cell Biol. 2002;3:639–650. - PubMed
    1. Vilardaga JP, et al. GPCR and G proteins: drug efficacy and activation in live cells. Mol Endocrinol. 2009;23:590–599. - PMC - PubMed
    1. Kenakin T. New concepts in pharmacological efficacy at 7TM receptors: IUPHAR review 2. Br J Pharmacol. 2013;168:554–575. - PMC - PubMed
    1. Manglik A, Kobilka B. The role of protein dynamics in GPCR function: insights from the beta2AR and rhodopsin. Curr Opin Cell Biol. 2014;27:136–143. - PMC - PubMed
    1. Baker JG. The selectivity of beta-adrenoceptor agonists at human beta1-, beta2- and beta3-adrenoceptors. Br J Pharmacol. 2010;160:1048–1061. - PMC - PubMed

Publication types

MeSH terms