. 2017 Jun 15;546(7658):421-425.
doi: 10.1038/nature22360. Epub 2017 Jun 7.

Stability and function of regulatory T cells expressing the transcription factor T-bet

Affiliations

Stability and function of regulatory T cells expressing the transcription factor T-bet

Andrew G Levine et al. Nature. .

Erratum in

Abstract

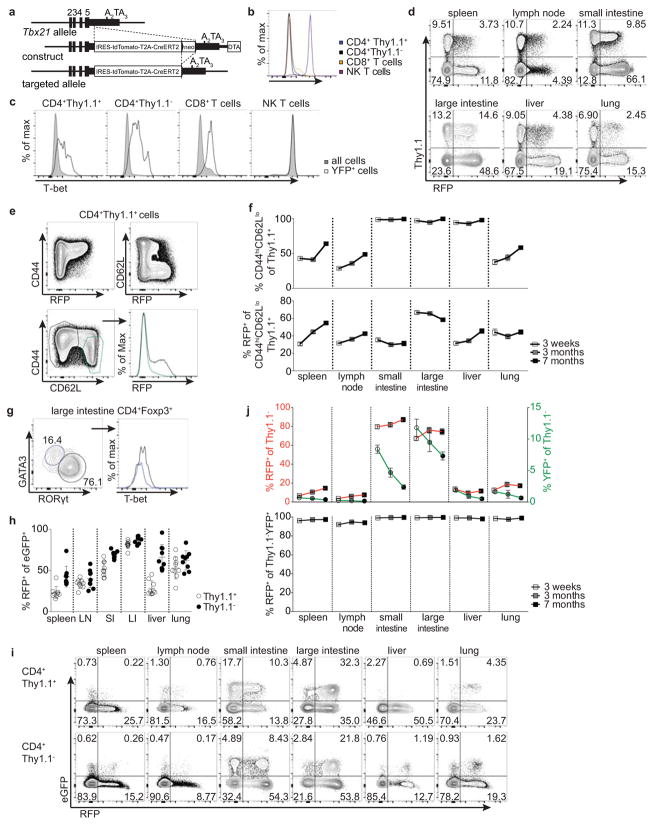
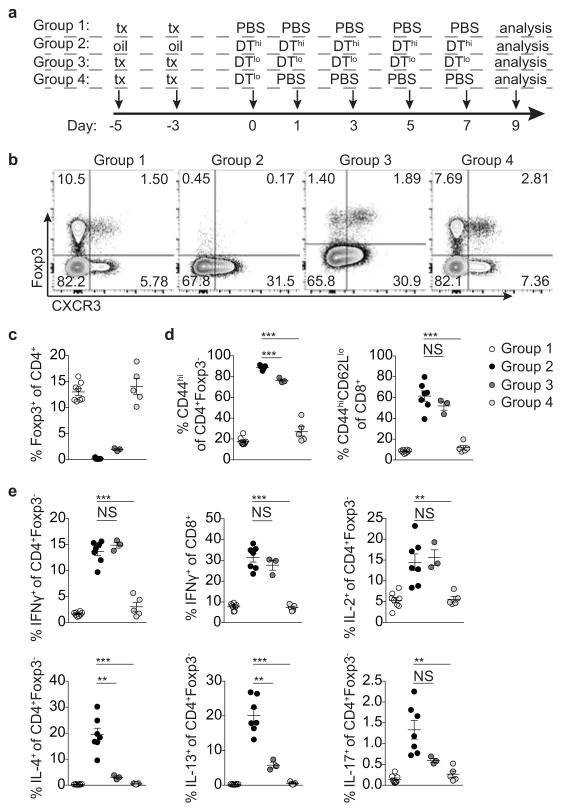
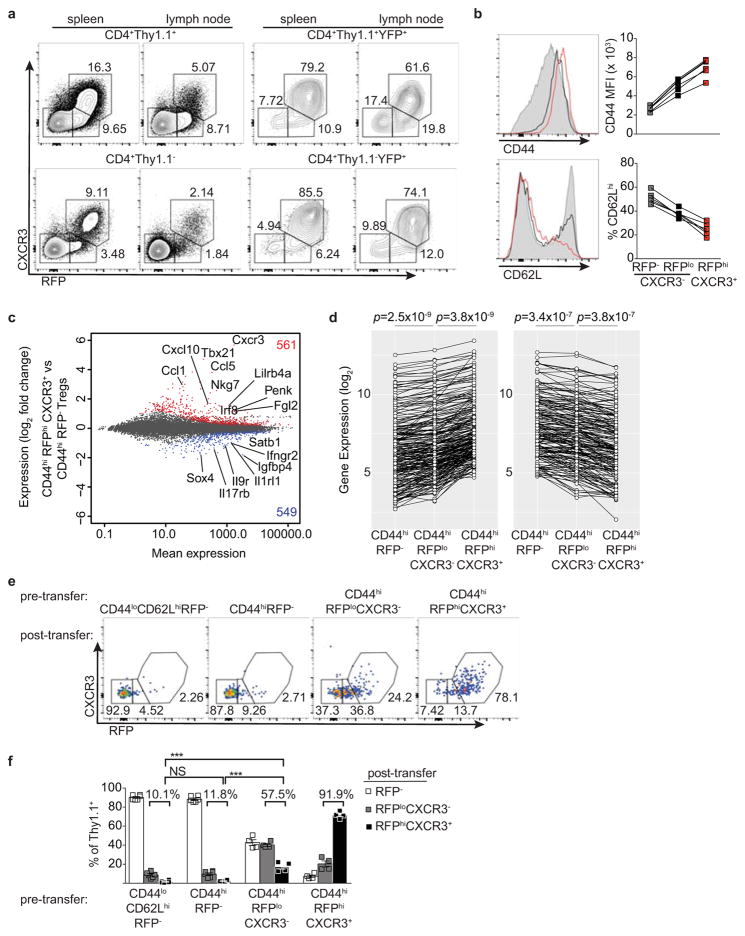
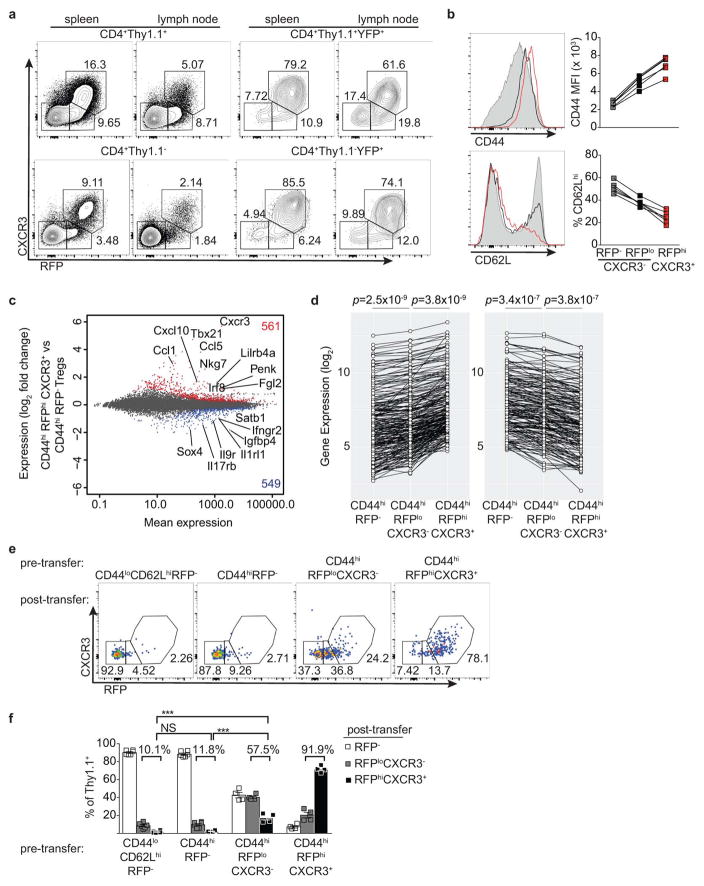
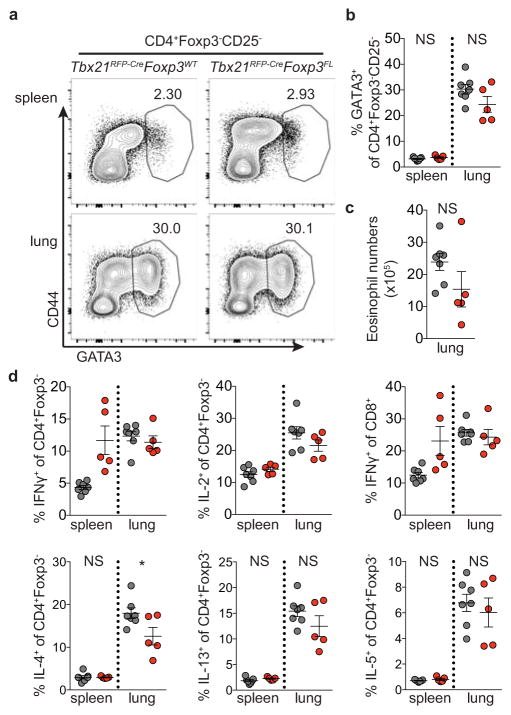
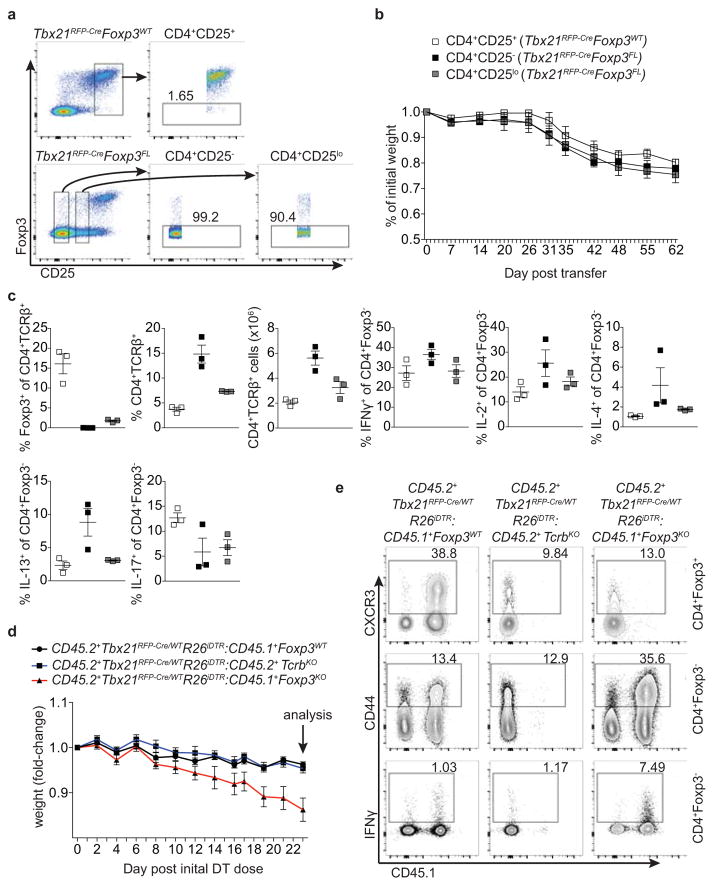
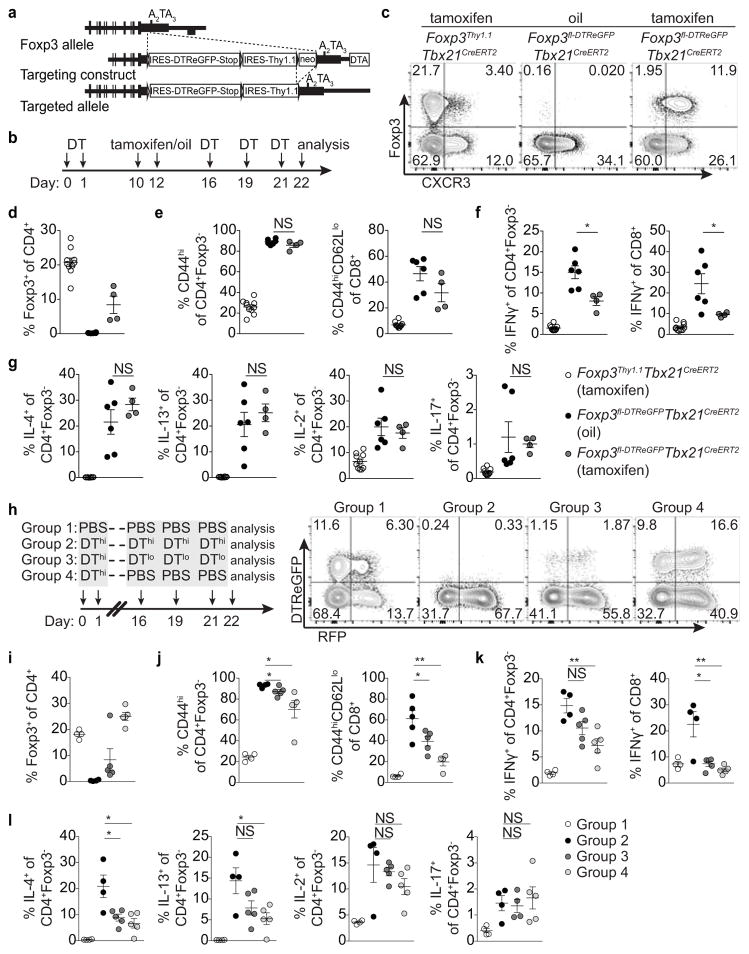
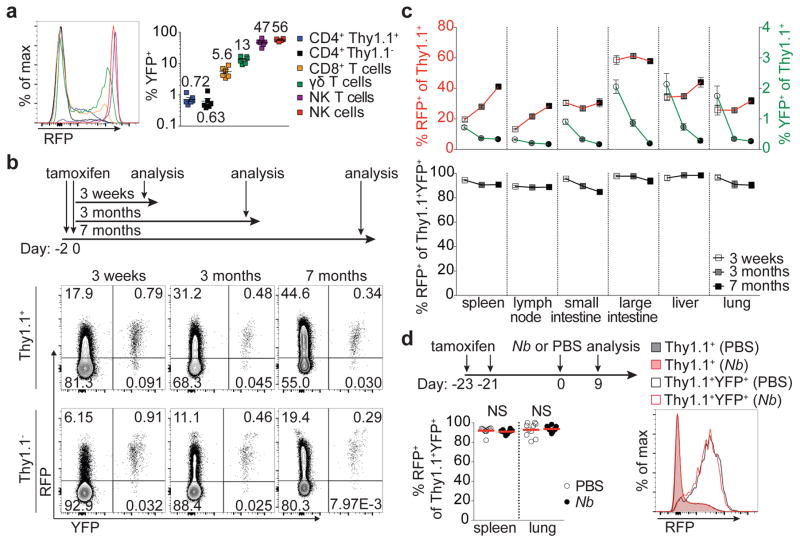
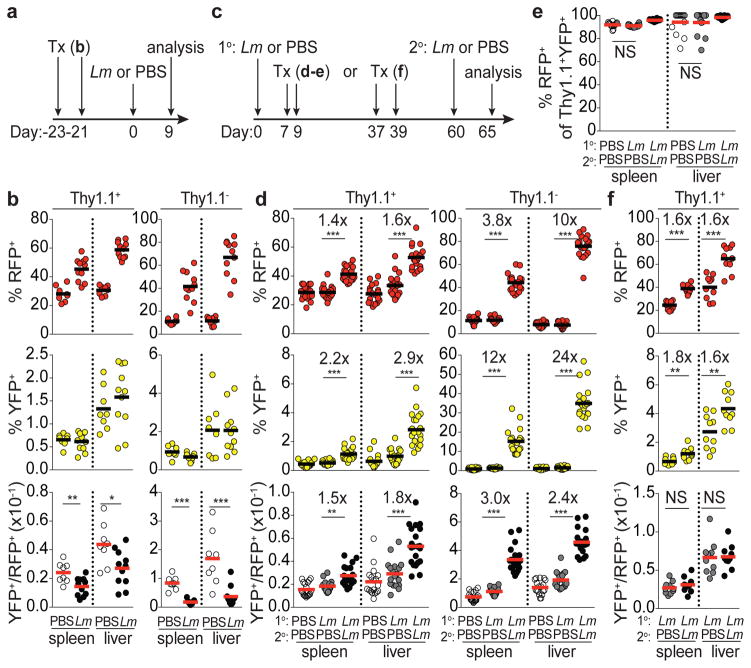
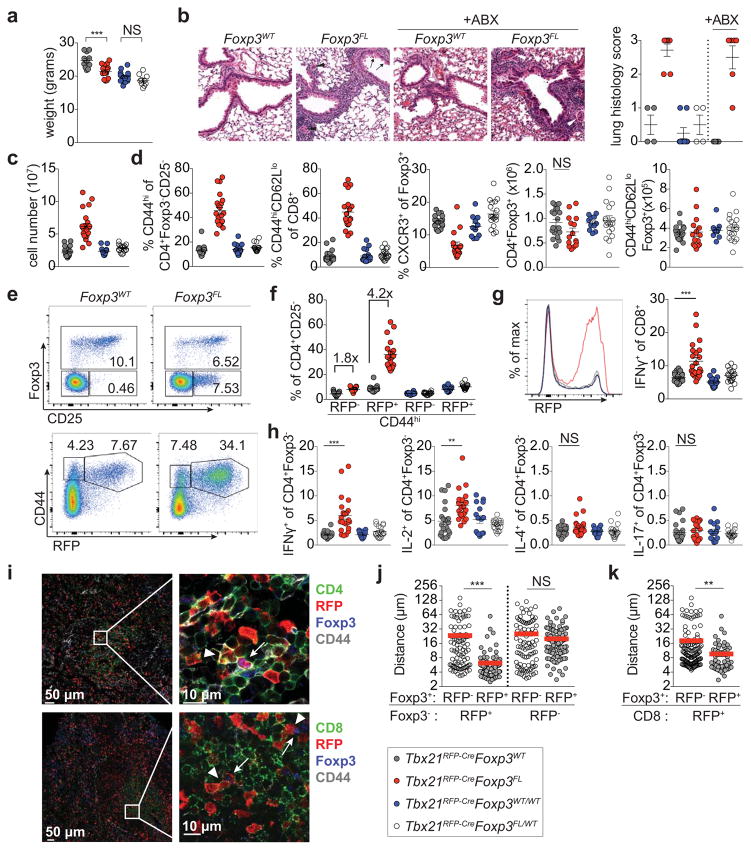
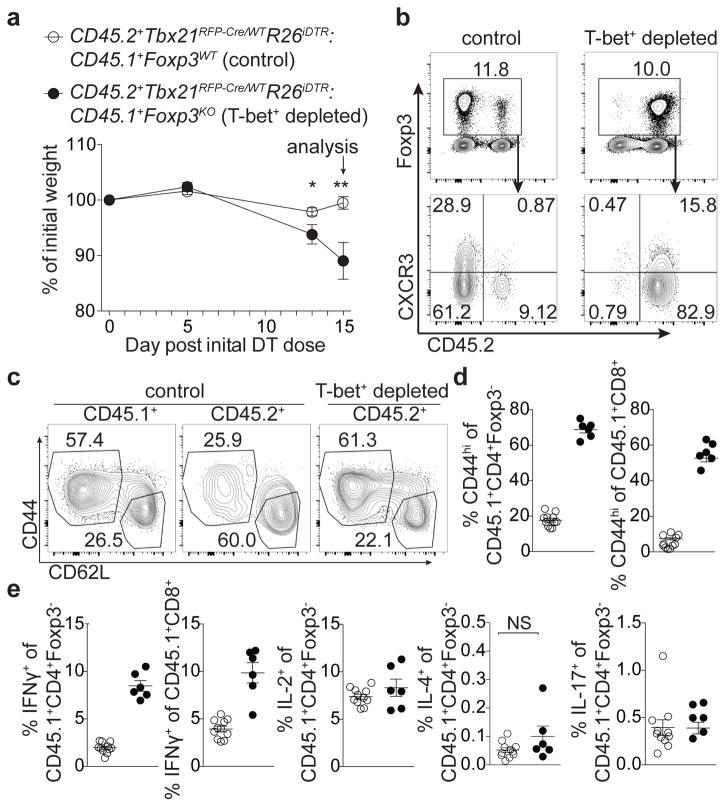
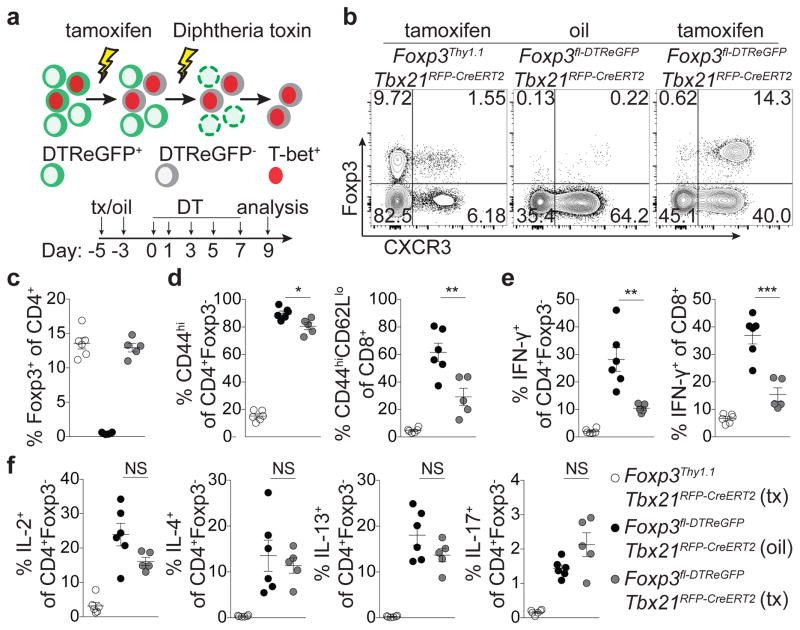
Adaptive immune responses are tailored to different types of pathogens through differentiation of naive CD4 T cells into functionally distinct subsets of effector T cells (T helper 1 (TH1), TH2, and TH17) defined by expression of the key transcription factors T-bet, GATA3, and RORγt, respectively. Regulatory T (Treg) cells comprise a distinct anti-inflammatory lineage specified by the X-linked transcription factor Foxp3 (refs 2, 3). Paradoxically, some activated Treg cells express the aforementioned effector CD4 T cell transcription factors, which have been suggested to provide Treg cells with enhanced suppressive capacity. Whether expression of these factors in Treg cells-as in effector T cells-is indicative of heterogeneity of functionally discrete and stable differentiation states, or conversely may be readily reversible, is unknown. Here we demonstrate that expression of the TH1-associated transcription factor T-bet in mouse Treg cells, induced at steady state and following infection, gradually becomes highly stable even under non-permissive conditions. Loss of function or elimination of T-bet-expressing Treg cells-but not of T-bet expression in Treg cells-resulted in severe TH1 autoimmunity. Conversely, following depletion of T-bet- Treg cells, the remaining T-bet+ cells specifically inhibited TH1 and CD8 T cell activation consistent with their co-localization with T-bet+ effector T cells. These results suggest that T-bet+ Treg cells have an essential immunosuppressive function and indicate that Treg cell functional heterogeneity is a critical feature of immunological tolerance.


Conflict of interest statement

The authors declare no completing financial interests.

Figures

Extended Data Figure 1
Extended Data Figure 1. Analysis of T-bet+ cells in Tbx21RFP-CreERT2 reporter mice
a, Targeting strategy for the Tbx21 locus. b, T-bet protein levels in immune cells in Tbx21RFP-CreERT2 mice. c, T-bet protein levels in Tbx21RFP-CreERT2 mice gavaged with tamoxifen (tx) on days −2 and 0 and analyzed 3 wk later. Shaded gray and open histograms represent all and YFP+ cells, respectively. d, Flow cytometry of RFP expression in Treg and nonTreg CD4 T cells. e, Flow cytometry of splenic Treg cells. f, Percent CD44hiCD62Llo among Thy1.1+ (above) and RFP+ among CD44hiCD62Llo Thy1.1+ (below) cells in Tbx21RFP-CreERT2 three weeks (white squares), three months (gray squares), and seven months (black squares) post tx treatment. g, Flow cytometry of T-bet expression in GATA3+ (blue gate, left, and histogram, right) and RORγt+ (black gate, left, and histogram, right) Treg cells isolated from the large intestine laminia propria. h, Percent RFP+ cells among eGFP+ CD4+ Thy1.1+ (open circles) and Thy1.1 (black circles) cells in Tbx21RFP-CreERT2RorcGFP/WT mice. LN, lymph node; SI, small intestine; LI, large intestine. i, Flow cytometry of CD4 T cells in Tbx21RFP-CreERT2RorcGFP/WT mice as quantified in (h). j, (Above) RFP+ (left axis, squares) and YFP+ (right axis, circles) effector CD4 T cells; (below) Percent RFP+ among YFP+ effector CD4 T cells 3 weeks (white symbols), 3 months (gray symbols), and 7 months (black symbols) post tx gavage, as outlined in Fig 1b. Bars, mean±s.e.m. All data are representative of ≥ 2 experiments, n ≥ 4 mice per group each.
Extended Data Figure 2
Extended Data Figure 2. T-betlo cells likely represent transient unstable intermediates in the differentiation of stable T-bethi Treg cells
a, Flow cytometry of the indicated cell subsets. b, CD44 and CD62L expression on RFPCXCR3 (gray shaded histograms, squares), RFPloCXCR3 (black histograms, squares), and RFPhiCXCR3+ (red histograms, squares) splenic CD4+ Thy1.1+ cells. c, Differential gene expression between CD44hiRFP and CD44hiRFPhiCXCR3+ Treg cells sorted from pooled spleens and lymph nodes of Tbx21RFP-CreERT2 mice. All genes significantly up (red)- or down-regulated (blue) are indicated. d, Expression of the 288 genes up- (≥ 1.5-fold; left) or 184 genes down-regulated (≤ 1.5-fold; right) in CD44hiRFPhiCXCR3+ vs. CD44hiRFP cells. Genes with a mean expression value < 15 were excluded from the analysis. p, paired t test; adjustments were made for multiple comparisons. e, CD44loCD62LhiRFP, CD44hiRFP, CD44hiRFPloCXCR3, and CD44hiRFPhiCXCR3hi CD4+Thy1.1+ cells were FACS-sorted and transferred into lymphoreplete hosts and analyzed in pooled spleens and lymph nodes 14 days after transfer. f, Quantification of data in (e) using a two-tailed t test (*** denotes p values <0.001). All data are representative of ≥ 2 experiments, n ≥ 2 mice per group each.
Extended Data Figure 3
Extended Data Figure 3. Fate mapping T-bet-expressing Treg cells during infectious challenge
a, Preferential expansion of CD44hiRFP vs. CD44hiRFP+ CD4 effector T cells during Nippostrongylus brasiliensis (Nb) infection. Flow cytometry analysis of splenic (above) and lung (below) CD4+Thy1.1 cells from PBS- (left) and Nb- (right) challenged mice. b, Flow cytometry of splenic CD4+ Thy1.1+ (left) and Thy1.1 (right) cells of PBS- (above) and Lm- (below) challenged mice, as indicated in Fig 2a. Numbers indicate percent RFP+ (left) and YFP+ (right) cells. c, (Above) schematic of experiment. CD44loCD62LhiRFP, CD44hiRFP, and CD44hiRFPhiCXCR3hi CD4+Thy1.1+ cells were FACS-sorted from pooled spleens and lymph nodes of Tbx21RFP-CreERT2 mice and transferred into lymphoreplete hosts one day before PBS or Lm challenge. (Below) Flow cytometry of transferred populations (indicated on left) on d9 in spleens of PBS- (left) or Lm- (right) challenged hosts. d, Representative histograms of RFP and CXCR3 expression on total CD4+Thy1.1+ (shaded histograms) or Th1.1+YFP+ (open histograms) cells from spleens of PBS- (black) or Lm- (red) challenged mice, as indicted in Fig 2a. e–g, eGFP expression in PBS or Lm challenged Tbx21RFP-CreERT2IL-10eGFP mice. e, Schematic of tamoxifen (tx) administration to Tbx21RFP-CreERT2IL10eGFP/WT mice for data shown in (f,g). f, Flow cytometry of Treg (above) and YFP+ Treg (below) cells in spleens of PBS (left) and Lm (right) treated mice. g, (Left) percent RFP-eGFP+ and RFP+eGFP+ among Treg cells, as gated in (f, above); (right) percent eGFP+ cells among YFP+ Treg cells, as gated in (f, below). h, Schematic of Lm reinfection in Tbx21RFP-CreERT2IL10eGFP/WT mice for data shown in (i,j); 1o and 2o indicate primary and secondary challenge, respectively. i, Flow cytometry of cells in Tbx21RFP-CreERT2IL-10eGFP mice on d65, treated as indicated above. j, Percent RFPeGFP+ and RFP+eGFP+ cells among Thy1.1+ cells, as gated in (i). All data are representative of ≥ 2 experiments, n≥ 2 mice per group each. Bars, mean±s.e.m. Two-tailed t test (NS – not significant).
Extended Data Figure 4
Extended Data Figure 4. Features of T-bet+ Treg cells
a, T cell activation, CXCR3 expression, and cytokine production in 12 wk old control Foxp3YFP-CreTbx21WT/WT and Foxp3YFP-CreTbx21FL/WT (white circles) and experimental Foxp3YFP-CreTbx21FL/FL (black circles) mice. Bars, mean±s.e.m. Two-tailed t test (* denotes p value < 0.05; NS – not significant). Data is representative of 3 experiments, n ≥ 7 mice per group. b, Cumulative distribution function plot of the 561 genes up in Thy1.1+ CD44hiRFPhiCXCR3+ vs. CD44hiRFP cells in Tbx21RFP-CreERT2 mice compared to all genes differentially expressed in CD4+CD25+ Treg vs. CD4+CD25lo exTreg cells. P=0.2xE−15, two-sample Kolmogorov-Smirnov test. c, Expression of CCR5 (above) and CD29 (below) in CD44loCD62Lhi naïve (blue histogram), CD44hiCXCR3 (black histogram) and CD44hiCXCR3+ (red histogram) Treg (left) and CD4+Foxp3 (right) T cells from spleens of Foxp3YFP-CreTbx21WT/WT mice. d, Expression of CXCR3 (left), CCR5 (middle), and CD29 (right), gated on CD4 T cells in spleens of Foxp3YFP-CreTbx21WT/WT and Foxp3YFP-CreTbx21FL/FL mice. e, Dendrogram represents cluster analysis of TCR sequences in CD44hiCXCR3+ (red symbols) and CD44hiCXCR3 (black symbols) Treg (right) and effector CD4 T (left) cells in spleens (white symbols) and lymph nodes (gray symbols) of DO11.10 TCRβ+ Tcra+/ Foxp3 reporter mice. Sample preparation and statistical analyses are described in the Methods section. Pearson correlation of clonotype frequencies for the shared TCR clones was used for the generation of the dendrogram.
Extended Data Figure 5
Extended Data Figure 5. Characterization of Tbx21RFP-CreFoxp3FL mice
a, Targeting strategy for the Tbx21 locus (above) and RFP expression in the indicated cell populations in spleens of homozygous Tbx21RFP-Cre mice (below). b, Progressive loss of hair pigmentation in Tbx21RFP-CreFoxp3FL mice. c, (Above) RFP and YFP expression and (below) CD44 and CD62L expression in the indicated splenic cell populations in Tbx21RFP-CreR26Y mice. d, Activation and expansion of RFP+ T cells in lymph nodes (above) and lungs (below) of the indicated mice. e, Cytokine production by CD4+Foxp3 and CD8+ T cells in lungs of the indicated mice. f, Characterization of lymph node Treg cells. g, Percentages of ex-Treg cells in spleens, lymph nodes, and lungs. h, (Above) flow cytometry of lymph node CD4 T cells, as quantified in (g); numbers indicate the percent Foxp3CD25+; (below), histograms showing expression of Treg cell signature molecules in CD4+Foxp3CD25+ cells in lymph nodes of Tbx21RFP-CreFoxp3WT (open gray histogram), Tbx21RFP-CreFoxp3FL (open red histogram), Tbx21RFP-CreFoxp3WT/WT (open blue histogram), and Tbx21RFP-CreFoxp3FL/WT (open black histogram) mice. CD4+Foxp3+CD25+ cells from a Tbx21RFP-CreFoxp3WT (shaded gray histogram) mouse are shown as a point of reference. Bars, mean±s.e.m. Two-tailed t test (***, **, and * denotes p values <0.001, 0.01, and 0.05, respectively; NS – not significant). Data represent the combined results from several experiments.
Extended Data Figure 6
Extended Data Figure 6. The TH2 response to N. brasiliensis is not exacerbated in Tbx21RFP-CreFoxp3FL mice
Tbx21RFP-CreFoxp3FL and Tbx21RFP-CreFoxp3WT mice were infected with N. brasiliensis and analyzed on day 9 post challenge. a, Flow cytometry of GATA3 expression in CD4+Foxp3CD25 T cells in spleens (above) and lungs (below) of Tbx21RFP-CreFoxp3WT (left) and Tbx21RFP-CreFoxp3FL (right) mice. b, Quantification of data in (a). c, Numbers of eosinophils in lungs of the indicated mice. d, Cytokine production by CD4+Foxp3 and CD8 T cells in spleens and lungs of the indicated mice. Bars, mean±s.e.m. Two-tailed t test (* denotes p values < 0.05; NS – not significant). Data represents 1 experiment, n ≥ 5 mice per group.
Extended Data Figure 7
Extended Data Figure 7. Distinguishing the drivers of autoimmunity in the absence of T-bet+ Treg cells
a,b, ex-Treg cells are no more pathogenic than effector CD4 T cells. a, CD4+CD25+ (Treg) cells were sorted from lymph nodes of Tbx21RFP-CreFoxp3WT mice, and CD4+CD25 (effector) and CD4+CD25lo (exTreg) cells were sorted from lymph nodes of Tbx21RFP-CreFoxp3FL mice for transfer into Tcrb/Tcrd/ mice. Intracellular staining for Foxp3 demonstrates purity of cell populations. b, Weights of Tcrb/Tcrd/ mice receiving CD4+CD25+ (white squares), CD4+CD25 (black squares), and CD4+CD25lo (gray squares) cells. c, Percentages and numbers of the indicated T cell populations in spleens of mice analyzed on d62 post transfer. d,e, T-bet+ effector αβT cells drive disease upon ablation of T-bet+ Treg cells. Lethally irradiated Tcrb/Tcrd/ mice were reconstituted with a 1:1 mix of CD45.2+Tbx21RFP-Cre/WTR26iDTR T-cell depleted bone marrow cells with either CD45.1+Foxp3KO, CD45.1+Foxp3WT, or CD45.2+TcrbKO T-cell depleted bone marrow cells. Mice were injected with 0.5μg diphtheria toxin (DT) on day 0, then treated daily with 0.1μg DT for 22 days before analysis. d, Weight loss in Tbx21RFP-Cre/WTR26iDTR:Foxp3KO (red line) vs. Tbx21RFP-Cre/WTR26iDTR:Foxp3WT (black line) vs. Tbx21RFP-Cre/WTR26iDTR:TcrbKO (blue line) reconstituted mice. e, Representative flow cytometry of splenic cell populations (indicated on right) in chimeric mice (as indicated above.) All data represent 1 experiment, n ≥ 3 mice per group.
Extended Data Figure 8
Extended Data Figure 8. Co-localization of T-bet+ Treg and T-bet+ effector T cells in vivo
a,b, Representative images (left) and insets (right) of lymph node sections from Tbx21RFP-Cre mice with CD4 (a) or CD8 (b) in green, RFP in red, Foxp3 in blue, and CD44 in gray. In inset, arrowheads indicate CD4+CD44hiRFP+Foxp3 (a) or CD8+CD44hiRFP+ (b) cells and arrows indicate CD4+CD44hiRFP+Foxp3+ cells. c,d, Quantification of nearest distances between Treg cells and CD4 (c) and CD8 (d) T cells, as shown in (a,b); Foxp3+ denotes CD4+CD44hiFoxp3+; Foxp3 (c) denotes CD4+CD44hiFoxp3 and CD8+ (d) denotes CD8+CD44hiRFP+. e,f, Quantification of nearest distances between Treg and nonTreg CD4 (e) and CD8 (f) T cells in spleens of Tbx21RFP-CreFoxp3WT and Tbx21RFP-CreFoxp3FL mice. Genotypes of mice are indicated above plots; cell types being analyzed are shown below plots, as in (c,d). Bars indicate mean. p values were calculated using a two-tailed t test (c,d) or one-way ANOVA (e,f) (***, **, and * denotes p values <0.001, 0.01, and 0.05, respectively; NS – not significant). Data are representative of multiple imaged sections from ≥ 2 mice.
Extended Data Figure 9
Extended Data Figure 9. T-bet+ Treg cells suppress pre-established TH1 but not TH2 or TH17 activation induced by depletion of Treg cells
a, Targeting strategy for the Foxp3 locus. (b) Schematic for experiment shown in (c–g) depleting all Treg cells and subsequently depleting all or only non-T-bet-expressing Treg cells in Foxp3fl-DTReGFPTbx21RFP-CreERT2 mice. c, Flow cytometry of splenic CD4 T cells in the indicated mice treated with tamoxifen (tx) or oil, as indicated. d–g, Percentages of Treg cells (d) and activation status of (e) and cytokine production by (f,g) splenic CD4+Foxp3 and CD8 T cells in tx-treated Foxp3Thy1.1Tbx21RFP-CreERT2 (open circles), mock oil-treated Foxp3fl-DTReGFPTbx21RFP-CreERT2 (black circles), and tx-treated Foxp3fl-DTReGFPTbx21RFP-CreERT2 (gray circles) mice. h–l, Treg cells rebounding post depletion in DT-treated Foxp3DTReGFPTbx21RFP-CreERT2 mice efficiently suppress TH2 responses. h, (left) Schematic for control experiment shown in (i–l); (right) flow cytometry of splenic CD4 T cells in mice treated with high dose DT (DThi, 1μg/mouse), low dose DT (DTlo, 0.0625μg/mouse), and PBS. Group 1 (control); group 2 (depletion without Treg cell recovery); group 3 (depletion with partial recovery); group 4 (depletion with full recovery). i–l, Percentages of Treg cells (i) and activation status of (j) and cytokine production by (k,l) splenic CD4+Foxp3 and CD8 T cells in the indicated groups of mice. Bars, mean±s.e.m. Two-tailed t test (***, **, and * denotes p values <0.001, 0.01, and 0.05, respectively; NS – not significant). Data are representative of ≥ 1 experiment, n ≥ 4 mice per group.
Extended Data Figure 10
Extended Data Figure 10. Treg cells rebounding post transient depletion efficiently suppress TH2 and TH17 responses
a, Experimental schematic. Mice were treated with tamoxifen (tx) or oil (to additionally control for potential effects of tx) on days −5 and −3 and received PBS on days 0, 1, 3, 5, 7 (control); 1μg DT (DThi) on days 0, 1, 3, 5, and 7 (no Treg cell recovery); 0.062μg DT (DTlo) on days 0, 1, 3, 5, and 7 (partial Treg cell recovery); or 0.062μg DT (DTlo) on day 0 and PBS on days 1, 3, 5, and 7 (full Treg cell recovery). Mice were analyzed on day 9. b, Flow cytometry analysis of CD4 T cells in spleens of the indicated groups of mice. c–e, Percentages of Treg cells (c) and CD4+Foxp3 and CD8 T cell activation (d) and cytokine production (e) in spleens of the indicate mice (Group 1 - open circles; Group 2 - black circles; Group 3 - dark gray circles; Group 4 - light gray circles). Bars, mean±s.e.m. Two-tailed t test (*** and ** denotes p values <0.001 and 0.01, respectively; NS – not significant). Data represent the combined results from 2 experiments, n ≥ 3 mice per group.
Figure 1
Figure 1. Stable T-bet expression in a subset of peripheral Treg cells
a, Splenic cells inTbx21RFP-CreERT2 mice 3 weeks following tamoxifen (tx) gavage on days −2 and 0. Numbers on graph (right) indicate the mean. b, Schematic of tx administration to Tbx21RFP-CreERT2 mice (above) and flow cytometry (below) of splenic CD4 Thy1.1+ and Thy1.1 cells. c, (Above) RFP+ (left axis, squares) and YFP+ (right axis, circles) Treg cells; (below) Percent RFP+ of YFP+Treg cells 3 weeks (white symbols), 3 months (gray symbols), and 7 months (black symbols) post tx gavage. d, (Above) schematic of tx treatment with Nippostrongylus brasiliensis (Nb) infection; (below, left) percent RFP+ among YFP+ Treg cells in PBS- (white circles) and Nb- (black circles) challenged mice; (below, right) RFP expression in Treg (shaded histograms) or YFP+ Treg (open histograms) cells from spleens of PBS- (black) or Nb- (red) challenged mice. Bars, mean±s.e.m. Two-tailed t test (NS – not significant). All data are representative of 2 experiments, n ≥ 3 mice per group each.
Figure 2
Figure 2. Stable differentiation of T-bet+ Treg cells in response to L. monocytogenes infection
a, Schematic of experiment shown in (b) combining tamoxifen (tx) treatment with Lm infection in Tbx21RFP-CreERT2 mice. b, Percent RFP+, YFP+, and YFP+/RFP+ ratio in CD4+ Thy1.1+ (left) and Thy1.1 (right) cells in spleens and livers of PBS and Lm challenged mice. c, Schematic of experiments shown in (d,e) and (f); 1o and 2o indicate primary and secondary challenge, respectively. d, data presented as in (b). e, Percent RFP+ of YFP+ Treg cells. f, data presented as in (b). Bars, mean. Two-tailed t test (***, **, and * denotes p values <0.001, 0.01, and 0.05, respectively; NS – not significant). All data are representative of ≥ 2 experiments, n ≥ 4 mice per group each.
Figure 3
Figure 3. Foxp3 ablation in T-bet+ Treg cells results in spontaneous TH1 autoimmune disease
a, Body weights of 8–10 wk old Tbx21RFP-CreFoxp3WT (gray circles), Tbx21RFP-CreFoxp3FL (red circles), Tbx21RFP-CreFoxp3WT/WT (blue circles), and Tbx21RFP-CreFoxp3FL/WT (white circles) mice. b, H&E staining (left) and histology scores (right) of lungs from Tbx21RFP-Cre mice combined with indicated Foxp3 alleles, treated or not with antibiotics (ABX). Tbx21RFP-CreFoxp3FL mice show moderate perivascular and peribronchiolar inflammation, mild respiratory epithelial hyperplasia and mucus metaplasia with hyalinization (arrows). Pulmonary arterioles are contracted with thickened media, reactive endothelia, and marginating leukocytes (arrowheads). Original magnification, 20x. c, Lymph node cell numbers and d, characterization of T cell populations in spleens. e, Flow cytometry of splenic cells in Tbx21RFP-CreFoxp3WT (left) and Tbx21RFP-CreFoxp3FL (right) mice, gated on fixed CD4+ (above) and live CD4+CD25 (below) cells. f, Quantification of RFP and RFP+ CD4 T cells, as shown in (e, bottom). g, RFP expression (left) and cytokine production (right) in splenic CD8 T cells. h, Cytokine production by splenic CD4+Foxp3 T cells. i, Representative images (left) and insets (right) of spleen sections from Tbx21RFP-Cre mice with CD4 (green, above) or CD8 (green, below), RFP (red), Foxp3 (blue), CD44 (gray). Inset, arrowheads indicate CD4+CD44hiRFP+Foxp3 (above) or CD8+CD44hiRFP+ (below) cells and arrows indicate CD4+CD44hiRFP+Foxp3+ cells. j–k, Nearest distances between cells as shown in (i); Foxp3+ denotes CD4+CD44hiFoxp3+; Foxp3 (j) denotes CD4+CD44hiFoxp3 and CD8+ (k) denotes CD8+CD44hiRFP+. Each circle (j,k) represents the distance between cells on imaged sections from three mice. Bars, mean±s.e.m. Two-tailed t test (*** and ** denotes p values <0.001 and 0.01, respectively; NS – not significant). All data are representative of several experiments.
Figure 4
Figure 4. Acute ablation of T-bet+ Treg cells results in TH1 immune activation
Bone marrow chimeric mice were injected with 0.5μg diphtheria toxin (DT) on d0, then treated daily with 0.1μg DT until d15. a, Weight loss in the indicated mice. b, Flow cytometry of splenic CD4 (above) and Treg (below) cells in the indicated mice. c, Activation status of CD45.1+ and CD45.2+ Treg cell compartments in spleens of indicated mice. d,e, T cell activation (d) and cytokine production (e) in control (white circles) and T-bet Treg depleted (black circles) chimeras. Bars, mean±s.e.m. Two-tailed t test (** and * denotes p values <0.01 and 0.05, respectively; NS – not significant). Data is representative of 2 experiments, n ≥ 6 mice per group.
Figure 5
Figure 5. T-bet+ Treg cells suppress TH1 and CD8+ T cell but not TH2 or TH17 responses
a, Schematic for tamoxifen (tx) administration and depletion of non-T-bet-expressing Treg cells in Foxp3fl-DTReGFPTbx21RFP-CreERT2 mice. b, Flow cytometry of splenic CD4 T cells in the indicated mice on d9, as outlined in (a). c–f, Treg cell percentages (c), and activated (d) and cytokine producing (e,f) T cells in spleens of tx-treated Foxp3Thy1.1Tbx21RFP-CreERT2 (open circles), oil-treated Foxp3fl-DTReGFPTbx21RFP-CreERT2 mice (black circles) and tx-treated Foxp3fl-DTReGFPTbx21RFP-CreERT2 mice (gray circles) mice. Bars, mean±s.e.m. Two-tailed t test (***, **, and * denotes p values <0.001, 0.01, and 0.05, respectively; NS – not significant). Data are representative of 2 experiments, n ≥ 3 mice per group each.

Comment in

Similar articles

Cited by

References

    1. Zhu J, Yamane H, Paul WE. Differentiation of effector CD4 T cell populations (*) Annual review of immunology. 2010;28:445–489. - PMC - PubMed
    1. Fontenot JD, Gavin MA, Rudensky AY. Foxp3 programs the development and function of CD4+CD25+ regulatory T cells. Nature immunology. 2003;4:330–336. - PubMed
    1. Hori S, Nomura T, Sakaguchi S. Control of regulatory T cell development by the transcription factor Foxp3. Science. 2003;299:1057–1061. - PubMed
    1. Koch MA, et al. The transcription factor T-bet controls regulatory T cell homeostasis and function during type 1 inflammation. Nature immunology. 2009;10:595–602. - PMC - PubMed
    1. Ohnmacht C, et al. MUCOSAL IMMUNOLOGY. The microbiota regulates type 2 immunity through RORgammat(+) T cells. Science. 2015;349:989–993. - PubMed

Publication types

MeSH terms

Substances