. 2017 Jun 15;546(7658):426-430.
doi: 10.1038/nature22797. Epub 2017 Jun 7.

The metabolic function of cyclin D3-CDK6 kinase in cancer cell survival

Affiliations

The metabolic function of cyclin D3-CDK6 kinase in cancer cell survival

Haizhen Wang et al. Nature. .

Abstract

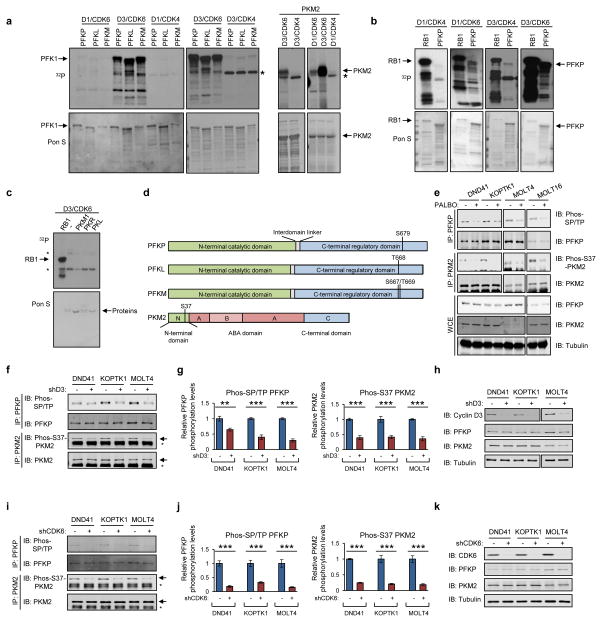
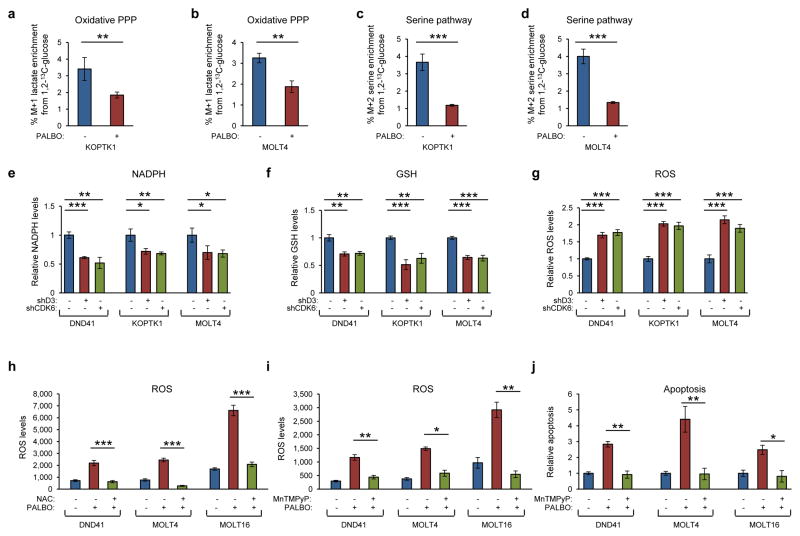
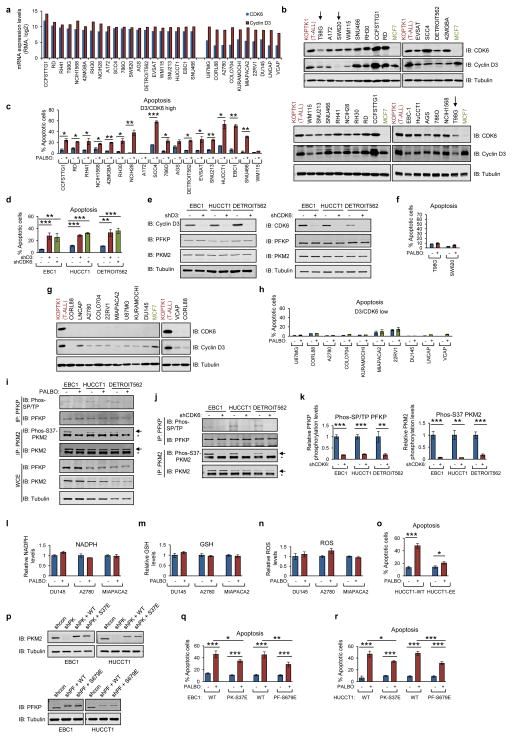
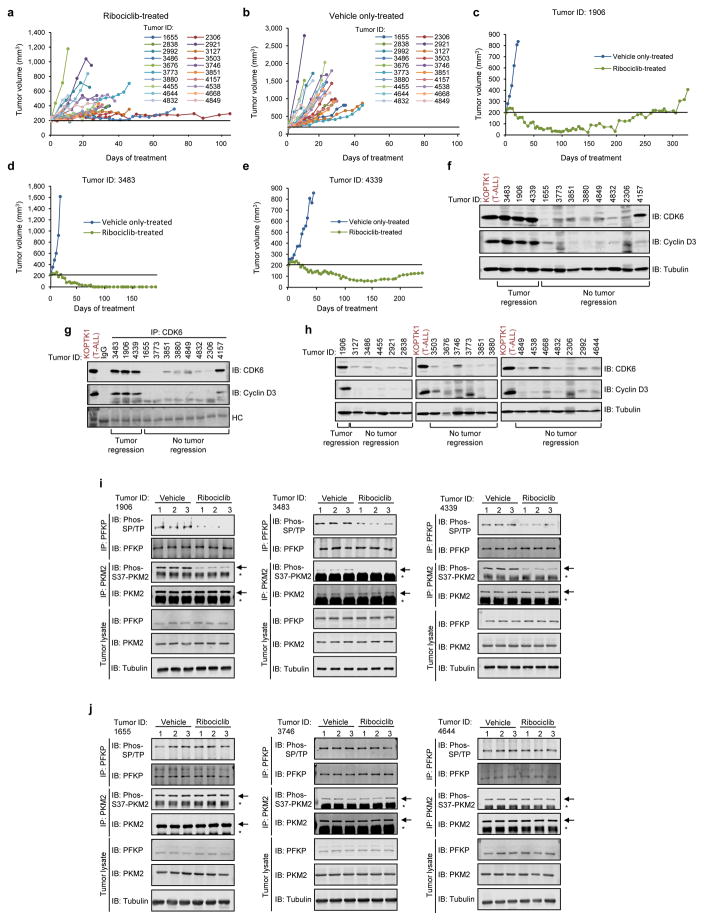
D-type cyclins (D1, D2 and D3) and their associated cyclin-dependent kinases (CDK4 and CDK6) are components of the core cell cycle machinery that drives cell proliferation. Inhibitors of CDK4 and CDK6 are currently being tested in clinical trials for patients with several cancer types, with promising results. Here, using human cancer cells and patient-derived xenografts in mice, we show that the cyclin D3-CDK6 kinase phosphorylates and inhibits the catalytic activity of two key enzymes in the glycolytic pathway, 6-phosphofructokinase and pyruvate kinase M2. This re-directs the glycolytic intermediates into the pentose phosphate (PPP) and serine pathways. Inhibition of cyclin D3-CDK6 in tumour cells reduces flow through the PPP and serine pathways, thereby depleting the antioxidants NADPH and glutathione. This, in turn, increases the levels of reactive oxygen species and causes apoptosis of tumour cells. The pro-survival function of cyclin D-associated kinase operates in tumours expressing high levels of cyclin D3-CDK6 complexes. We propose that measuring the levels of cyclin D3-CDK6 in human cancers might help to identify tumour subsets that undergo cell death and tumour regression upon inhibition of CDK4 and CDK6. Cyclin D3-CDK6, through its ability to link cell cycle and cell metabolism, represents a particularly powerful oncoprotein that affects cancer cells at several levels, and this property can be exploited for anti-cancer therapy.


Figures

Extended Data Figure 1
Extended Data Figure 1. Analyses of human T-ALL cells
a, b, Quantification of D-type cyclins levels (a), CDK4 and CDK6 (b) in T-ALL cell lines. c, CDK6 was immunoprecipitated and immunoblots probed with the indicated antibodies. d, T-ALL cell lines were transduced with viruses encoding shRNA against cyclin D3, or CDK6, or control shRNA (−), and apoptosis was gauged by Annexin V staining/FACS. e, Immunoblotting from d. f–h, The goal was to determine whether CDK4/6 inhibition causes apoptosis of normal human T lymphocytes. T lymphocytes from two donors (#1, #2) were stimulated with interleukin 2 (IL2) and analyzed by immunoblotting (f), or cultured in the presence/absence of palbociclib (PALBO), and analyzed for apoptosis as in d (g), or cultured as in g, pulsed with BrdU, stained with an anti-BrdU antibody and propidium iodide, and analyzed for cell cycle distribution (h). i, T-ALL cell lines were transduced with viruses encoding anti-RB1 or control shRNA (−). Cells were cultured in the presence/absence of palbociclib, and apoptosis was quantified as in d. j, Cells were treated as in i, and apoptosis was assessed by immunoblotting with anti-cleaved PARP antibody. k, T-ALL cell lines were transduced with viruses encoding shRNAs against RB1, RBL1 and RBL2 or control shRNA (−). Cells were cultured in the presence/absence of palbociclib, and apoptosis quantified as in d. l, Immunoblot analysis from k. m, Quantification of expression levels of PFK1 isoforms in T-ALL cell lines. n, Analysis of expression of PKM1 and PKM2 in T-ALL cell lines and in lung cancer A549 and 293T cells. o, Quantification of expression levels of PKM2 in T-ALL cell lines. p, q, Interaction of PFKP (p) and PKM2 (q) with CDK6 and cyclin D3 in T-ALL cell lines. HC, Ponceau staining for immunoglobulin heavy chains. In a–c, i, j, m–q Identical results were obtained with RPMI8402 cells, which are not shown (lines spliced out) due to their inclusion in the list of potentially misidentified cell lines. d, g-I, k, n=3, biological replicates; bars, mean; error bars, s.d. ***P<0.001 (t-test). a, b, representative experiments (out of 2), c, e, f, j, l–q, out of 3. Supplementary Fig. 1 shows gel source data.
Extended Data Figure 2
Extended Data Figure 2. Phosphorylation of PFK1 and PKM2 by cyclin D3-CDK6
a, In vitro kinase reactions. Pon S, Ponceau S staining of membranes. Arrows point to PFK1 or PKM2 proteins; star, phosphorylation of CDK4. b, In vitro kinase reactions (controls for analyses shown in panel a). c, In vitro kinase reactions to test whether cyclin D3-CDK6 can phosphorylate PKM1, PKR or PKL isoforms of pyruvate kinase. Stars denote phosphorylation of cyclin D3 and CDK6. Pon S, Ponceau S staining of membranes. d, Cyclin D3-CDK6-dependent phosphoresidues, identified in our mass spectrometric analyses. In case of PFKM we were unable to distinguish between phosphorylation of S667 and T669. e, Decreased phosphorylation of the endogenous PFKP and PKM2 upon palbociclib treatment. T-ALL cell lines were cultured in the presence/absence of palbociclib. PFKP or PKM2 were immunoprecipitated and immunoblots probed with an anti-phospho Ser-Pro/Thr-Pro antibody (Phos-SP/TP) to detect phosphorylated PFKP, or with an antibody against serine 37-phosphorylated PKM2 (Phos-S37-PKM2), or with anti-PFKP and -PKM2 antibodies. Whole cell extracts (WCE) were also immunoblotted. Quantification of band intensities is in Fig. 1c. Identical results were obtained with RPMI8402 cells (lines spliced out). f, Decreased phosphorylation of the endogenous PFKP and PKM2 upon depletion of cyclin D3. T-ALL cell lines were transduced with viruses encoding shRNA against cyclin D3, or control shRNA (−). PFKP or PKM2 phosphorylation was assessed as in e. Arrows point to PKM2; stars, immunoglobulin heavy chain. g, Quantification of PFKP and PKM2 phosphorylation from f. h, Immunoblot analysis from f. i, Decreased phosphorylation of PFKP and PKM2 upon depletion of CDK6. T-ALL cell lines were transduced with viruses encoding shRNA against CDK6, or control shRNA (−). PFKP or PKM2 phosphorylation was assessed as in e and f. j, Quantification of PFKP and PKM2 phosphorylation from i. k, Immunoblot analysis from i. g, j, quantification of experiments shown in f and i, respectively (out of 3). Bars, mean values, error bars, s.d. ***P<0.001 (t-test). a, b, e, f, h, i, k, representative experiments (out of 3), c out of 5. Supplementary Fig. 1 shows gel source data.
Extended Data Figure 3
Extended Data Figure 3. Cyclin D3-CDK6 inhibits PFKP and PKM2
a, b Purified recombinant PFKP (a) or PKM2 (b) wild-type/mutants were pre-incubated with (+) or without (−) cyclin D3-CDK6, and PFKP or PKM2 activity was assayed. c, d, Cell lines were transduced with viruses encoding shRNA against cyclin D3, or CDK6 or control shRNA (−), and the activity of PFKP (c) or PKM2 (d) was assayed. e, Purified recombinant PFKP wild-type/mutants were pre-incubated as in a, and ADP binding was assayed using 100 μM ADP and 18 pmol PFKP. f, g, Binding of PFKP to ADP was assayed using 100 μM ADP (f), or 22.3 pmol PFKP (g). h, Flag-tagged PFKP wild-type/mutants were expressed in MCF7 cells. Whole cell lysates were resolved on a non-denaturing gel and immunoblots probed with an anti-Flag antibody. The amount of protein extracts loaded onto gels was adjusted so that each sample contained roughly the same amount of PFKP tetramers. Lower panels, whole cell lysates were resolved on a denaturing SDS-PAGE gel. i, Quantification from h. j, Flag tagged PFKP was expressed in MOLT4 cells. Whole cell lysates were filtered using Disposable Ultrafiltration Units with molecular weight 200 kDa cutoff. The filtrates (< 200 kDa fraction) were then analyzed, along with whole cell extracts prior to filtration (WCE), by immunoblotting with an anti-Flag antibody. LRP6 protein (molecular weight 180 kDa, passes the filter), BRCA1 (208 kDa, not passing the filter). k, Quantification from j. l, Cell lines were cultured in the presence/absence of palbociclib. Whole cell lysates were filtered as in j. m, Quantification from l. n, Flag-tagged PKM2 was expressed in EBC1 (lanes 1–2) and HUCCT1 cells (lanes 3–4). Whole cell lysates were resolved on a non-denaturing gel and immunoblots probed with an anti-Flag antibody. Lower panel, whole cell lysates were resolved on a denaturing SDS-PAGE gel. o, Quantification from n. a–g, i, k, m, o, mean values; error bars, s.d. *P<0.05; **P<0.01; ***P<0.001 (t-test). a–g, n=3 independent experiments. i, k, m, o, quantification of experiments in h, j, l, n (out of 3). h, representative experiment (out of 5), j, l, n out of 3. Supplementary Fig. 1 shows gel source data.
Extended Data Figure 4
Extended Data Figure 4. Metabolic changes in T-ALL cells upon inhibition of cyclin D3-CDK6
a, b, Flow of glucose-derived carbon into the pentose phosphate pathway following cyclin D3-CDK6 inhibition in T-ALL KOPTK1 (a) and MOLT4 (b) cells. Cells were fed with isotopically labeled [1,2-13C] glucose in the presence/absence of palbociclib, and the flow of 13C-labelled carbon was quantified using isotopic enrichment analysis and mass spectrometry. c, d, Flow of glucose-derived carbon into the serine pathway following cyclin D3-CDK6 inhibition in T-ALL KOPTK1 (c) and MOLT4 (d) cells. e–g, Cells were transduced with viruses encoding shRNA against cyclin D3, or CDK6, or control shRNA (−), and metabolite levels were measured. h, i, Cells were cultured in the presence/absence of palbociclib and an anti-oxidant N-acetyl-cysteine (NAC, h), or palbociclib and cell-permeable superoxide dismutase mimetic MnTMPyP (i), and ROS levels were measured. j, Cells were cultured in the presence/absence of palbociclib and MnTMPyP, and apoptosis was gauged by cleaved caspase 3/7 assay. a–j, n=3, biological replicates. Bars, mean values; error bars, s.d. *P<0.05; **P<0.01; ***P<0.001 (t-test).
Extended Data Figure 5
Extended Data Figure 5. Analyses of the functional consequences of PFKP and PKM2 phosphorylation by cyclin D3-CDK6
a, Analysis of PFKP and PKM2 levels in T-ALL KOPTK1 and MOLT4 cells that were left untreated (non), or engineered to express control shRNA (shcon), or anti-PFKP and anti-PKM2 shRNAs (shPF + shPK), or anti-PFKP and anti-PKM2 shRNAs together with ectopically expressed wild-type PFKP and PKM2 (shPF + shPK + WT + WT), or anti-PFKP and anti-PKM2 shRNAs together with ectopically expressed PFKP S679E and PKM2 S37E phosphomimicking mutants (shPF + shPK + S679E + S37E). b–e, Cells engineered as in a to express wild-type PFKP and PKM2 (KOPTK1-WT, MOLT4-WT), or PFKP S679E and PKM2 S37E mutants (KOPTK1-EE, MOLT4-EE), were cultured in the presence/absence of palbociclib, and the activities of PFKP and PKM2 were measured. f, KOPTK1-EE and MOLT4-EE cells were cultured in the presence/absence of palbociclib. Whole cell lysates were filtered and analyzed as in Extended Data Fig. 3j. g, Quantification from f. h–j, Flow of glucose-derived carbon into PPP (h, i) and the serine pathway (j) following cyclin D3-CDK6 inhibition in KOPTK1-WT and KOPTK1-EE, or MOLT4-WT and MOLT4-EE cells, analyzed as in Extended Data Fig. 4a, b. k–p, KOPTK1-WT and KOPTK1-EE, or MOLT4-WT and MOLT4-EE cells were cultured in the presence/absence of palbociclib and metabolite levels were determined. q, Apoptosis was quantified by cleaved caspase 3/7 assay. r, s, Apoptosis analyzed by Annexin V staining followed by FACS. t, Quantification from s. u, KOPTK1-WT and KOPTK1-EE cells were transduced with viruses encoding shRNA against CDK6, or control shRNA (−), and apoptosis was analyzed as in r. v, Immunoblot analysis from u and Fig. 2h. w and x, Cells were treated as indicated and apoptosis quantified as in r. y and z, Fraction of cells in the indicated cell cycle phases. b–e, g–q, t, u, w, x, bars, mean values; error bars, s.d. *P<0.05; **P<0.01; ***P<0.001 (t-test). b–e, h–q, u, w, x, n=3 biological replicates. g, t, quantification of the experiments shown in f, s (out of 3). a, f, v, representative experiments (out of 3). r, y, z, n=3 independent experiments. Supplementary Fig. 1 shows gel source data.
Extended Data Figure 6
Extended Data Figure 6. Analyses of KOPTK1 and MOLT4 T-ALL cells expressing phosphomutant PFKP or PKM2
a–i, To gauge the contribution of PFKP versus PKM2 phosphorylation to the observed phenotypes, we engineered “single mutant” T-ALL cells expressing phosphomimicking PFKP S679E mutant in place of wild-type PFKP (along with wild-type PKM2), and cells expressing phosphomimicking PKM2 S37E mutant in place of wild-type PKM2, (along with wild-type PFKP). a, Immunoblot analysis of PFKP and PKM2 levels in T-ALL KOPTK1 and MOLT4 cells engineered to stably express control shRNA (shcon), or anti-PKM2 shRNA together with ectopically expressed wild-type PKM2 (shPK + WT), or anti-PKM2 shRNAs together with PKM2 S37E (shPK + S37E, “single mutant” cells), or anti-PFKP shRNA plus ectopically expressed wild-type PFKP (shPF + WT), or anti-PFKP shRNAs plus PFKP S679E (shPF + S679E, “single mutant” cells). b–i, Analysis of “single mutant” KOPTK1 and MOLT4 cells engineered as in a to express wild-type PFKP and PKM2 (WT), or PKM2 S37E (PK-S37E), or PFKP S679E (PF-S679E). Cells were cultured in the presence/absence of palbociclib, and the indicated parameters were measured. Note that palbociclib treatment of “single mutant” cells reduced PPP and serine pathway flows, and GSH levels, increased ROS and triggered apoptosis; the effects were generally milder than those in cells expressing wild-type PFKP and PKM2. j–n, Analyses of KOPTK1 and MOLT4 T-ALL cells expressing doxycycline-inducible phospho-inactivating PFKP S679A and PKM2 S37A mutants. j, Immunoblot analysis of PKM2 and PFKP levels in T-ALL MOLT4 cells engineered to stably express control shRNA (shcon), or anti-PFKP and anti-PKM2 shRNAs together with doxycycline-inducible wild-type PFKP and PKM2 (shPF + shPK + WT + WT), or anti-PFKP and anti-PKM2 shRNAs together with doxycycline-inducible PFKP S679A and PKM2 S37A (shPF + shPK + S679A + S37A). Cells were cultured in the absence/presence of doxycycline (DOX). k–n, MOLT4 cells engineered as in j to express doxycycline-inducible wild-type PFKP and PKM2 (WT), or PFKP S679A and PKM2 S37A (AA) were cultured in the presence/absence of doxycycline and the indicating parameters were measured. b–i, k–n, n=3 biological replicates. Bars, mean values; error bars, s.d. *P<0.05; **P<0.01; ***P<0.001 (t-test). a, j, a representative experiment (out of 2). Supplementary Fig. 1 shows gel source data.
Extended Data Figure 7
Extended Data Figure 7. Inhibition of PPP and serine pathway in T-ALL cells
a–d, KOPTK1 cells were transduced with vectors encoding shRNA against phosphoserine aminotransferase, the key enzyme in the serine pathway (shPSAT +), or control shRNA (−), and cultured in the presence (+) or absence (−) of dehydroepiandrosterone (DHEA, an inhibitor of pentose phosphate pathway), and the levels of NADPH (a), reduced glutathione (GSH, b), ROS (c), and apoptosis (d, Annexin V staining followed by FACS) were determined. e–h, Similar analysis of MOLT4 cells. i–l, Similar analysis for DND41 cells. m, Immunoblot analysis to gauge the efficiency of PSAT1 knockdown. Tubulin served as a loading control. n–p, The indicated T-ALL cell lines were treated with vehicle (con) or with PPP inhibitors 6-aminonicotinamide (6-AN) or DHEA, and the levels of NADPH (n) and ROS (o) were assayed. Apoptosis was quantified by Annexin V staining followed by FACS (p). a–l, n–p, n=3 biological replicates. Bars, mean values; error bars, s.d. *P<0.05; **P<0.01; ***P<0.001 (t-test). m, a representative experiment (out of 3). Supplementary Fig. 1 shows gel source data.
Extended Data Figure 8
Extended Data Figure 8. Analyses of human breast cancer cells
a, Apoptosis levels in human breast cancer cell lines cultured in the presence/absence of palbociclib (cleaved caspase 3/7 assay). b, Protein levels in breast cancer and T-ALL cell lines, assessed by immunoblotting of whole cell lysates. c, Breast cancer cell lines were cultured in the presence/absence of palbociclib; PFKP and PKM2 phosphorylation was assessed as in Extended Data Fig. 2e. Arrow points to PKM2; star, immunoglobulin heavy chain. Right panel: immunoblotting of whole cell extracts. d, Quantification from c. e, Breast cancer cell lines were cultured in the presence/absence of palbociclib. Whole cell lysates were filtered and analyzed as in Extended Data Fig. 3j. f, Quantification from e. g–k, Breast cancer cell lines were cultured in the presence/absence of palbociclib, and the indicated parameters were assessed. l, The absolute levels of ROS in human T-ALL and breast cancer cell lines. Identical results were obtained with T-ALL RPMI8402 cells. Note that the absolute levels of ROS in breast cancer cell lines are overall higher than those in T-ALL cells, which may render breast cancer cells less sensitive to modest increases in ROS levels observed in these cells upon CDK4/6 inhibition (see k). m, n, Breast cancer cells were transduced with vectors encoding shRNA against phosphoserine aminotransferase (PSAT), the key enzyme in the serine pathway or control shRNA (−), and cultured in the presence/absence of 6-aminonicotinamide (6-AN, a PPP inhibitor), and the indicated parameters were measured. o, Immunoblot analysis from n. p, ROS levels in breast cancer cells treated with palbociclib alone, or together with low 6-AN concentration. Note that palbociclib treatment caused only a small increase in ROS, which was enhanced by 6-AN addition. q, Cells were treated with palbociclib together with low concentrations of 6-AN, and apoptosis quantified by Annexin V/FACS. Note a synergistic effect of palbociclib and 6-AN in inducing apoptosis. a, d, f–n, p, q, bars, mean values; error bars, s.d. *P<0.05; **P<0.01; ***P<0.001 (t-test). a, g–n, p, q, n=3, biological replicates. d, f, quantification of c, e (out of 3 biological replicates), b, c, e, o, representative experiments (out of 3). Supplementary Fig. 1 shows gel source data.
Extended Data Figure 9
Extended Data Figure 9. Apoptosis of D3/CDK6-high tumor cell lines upon CDK4/6 inhibition
a, Transcript levels (log2 Robust Multi-Array Average values) according to CCLE (https://portals.broadinstitute.org/ccle/home). Left, CDK6-high; right, CDK6-low cell lines. b, Immunoblot analysis of “top 20” cell lines. T98G and SW620 cells express lower CDK6 and/or D3 protein levels. c, d, Apoptosis of D3/CDK6-high cell lines upon palbociclib treatment, or cyclin D3/CDK6 knockdown. e, Immunoblot analysis from d. f, Analysis of T98G and SW620 cells. g, h Immunoblot analysis and apoptosis of D3/CDK6-low cell lines. i, D3/CDK6-high cells analyzed as in Extended Data Fig. 2e. Arrows point to PKM2; stars, immunoglobulin heavy chain. Quantification shown in Fig. 4a, b. j, D3/CDK6-high cells were transduced with anti-CDK6 or control shRNA (−); PFKP and PKM2 phosphorylation was assessed as above. k, Quantification from j. l–n, Analysis of D3/CDK6-low cells. o, D3/CDK6-high HUCCT1 cells expressing wild-type PFKP and PKM2 (HUCCT1-WT), or PFKP S679E and PKM2 S37E (HUCCT1-EE) were cultured in the presence/absence of palbociclib. p–r, To gauge contribution of PFKP versus PKM2 phosphorylation to the observed phenotypes, we engineered “single mutant” D3/CDK6-high EBC1 and HUCCT1 cells expressing phosphomimicking PFKP S679E mutant in place of wild-type PFKP (along with wild-type PKM2), and cells expressing phosphomimicking PKM2 S37E mutant in place of wild-type PKM2 (along with wild-type PFKP). p, Immunoblot analysis of PKM2 and PFKP levels in EBC1 and HUCCT1 cells expressing control shRNA (shcon), anti-PKM2 shRNA (shPK), anti-PKM2 shRNA plus ectopically expressed wild-type PKM2 (shPK + WT), anti-PKM2 shRNAs plus PKM2 S37E (shPK + S37E), anti-PFKP shRNA plus wild-type PFKP (shPF + WT), or anti-PFKP shRNAs plus PFKP S679E (shPF + S679E). q, r, analysis of cells engineered in p to express wild-type PKM2 and PFKP (WT), or mutants (PK-S37E or PF-S679E). “Single mutant” cells underwent apoptosis upon palbociclib treatment; the effect was less pronounced than in cells expressing wild-type PFKP and PKM2. c, d, f, h, k, l–o, q, r, bars, mean values; error bars, s.d. *P<0.05; **P<0.01; ***P<0.001 (t-test). c, d, f, h, l–o, q, r, n=3, biological replicates. k, quantification from j (out of 3). b, e, g, i, j, p, representative experiments (out of 3). Supplementary Fig. 1 shows gel source data.
Extended Data Figure 10
Extended Data Figure 10. Analyses of human melanoma xenografts
Patient-derived melanomas were implanted into immunocompromised mice, recipients treated with ribociclib or vehicle. a, b, Growth curves of 20 tumors that responded to ribociclib by reduced tumor growth, but no regression (a, ribociclib-treated; b, vehicle-treated tumors). c-e, Growth curves of three tumors that underwent long-term regression upon ribociclib treatment. f, CDK6 and cyclin D3 protein levels in primary, patient-derived melanomas (prior to implantation into mice). Three tumors that, upon implantation into mice, underwent long-term regression in response to ribociclib are marked “Tumor regression”. g, Analysis of the levels of cyclin D3-CDK6 complexes in tumors shown in f. Tumor lysates from primary melanomas were immunoprecipitated with an anti-CDK6 antibody, the immunoblots were probed with the indicated antibodies. HC, Ponceau staining for immunoglobulin heavy chains. h, CDK6 and cyclin D3 protein levels in primary, patient-derived melanomas. Tumors shown here expressed low/moderate CDK6 and D3 levels, and none underwent regression upon ribociclib treatment of recipient mice (see a, b). For comparison, CDK6 and cyclin D3 levels in a primary melanoma that underwent long-term regression upon palbociclib treatment of recipient mice (“Tumor regression”) and in T-ALL KOPTK1 cells are shown. i, Analysis of three tumors (1906, 3483, 4339) which expressed high cyclin D3 and CDK6 levels (see f, g), and which underwent long-term regression upon ribociclib treatment (see c–e). In this experiment, mice bearing xenografts of melanomas (n=3 recipient mice per tumor, marked 1–3) were treated with ribociclib or vehicle. Tumors were collected 4 h after the last dose, and PFKP and PKM2 phosphorylation analyzed as in Extended Data Fig. 2e. Arrows point to PKM2; stars, immunoglobulin heavy chain. Tumor lysates were also immunoblotted. Quantification is shown in Fig. 5a, b (see D3/CDK6 high). j, similar analysis as in i of three tumors (1655, 3746, 4644) which expressed relatively low levels of cyclin D3 and/or CDK6 (see f–h), and which did not undergo regression upon ribociclib treatment (see a, b). Quantification is shown in Fig. 5a, b (see D3/CDK6 low). a–e, one set of experiments, f–j representative experiments (out of 3). Supplementary Fig. 1 shows gel source data, Source data for Extended Fig. 10 shows PDX tumor growths.
Figure 1
Figure 1. Cyclin D3-CDK6 regulates PFK1 and PKM2
a, Enrichment of GO terms among CDK6-interactors identified in all T-ALL cell lines. p-values, Benjamini-Hochberg-test. b, In vitro kinase reactions using immunoprecipitated endogenous CDK6 and recombinant PFKP or PKM2 ±palbociclib (PALBO). 32P-PFKP/PKM2 denotes phosphorylated proteins, IB, immunoblotting. c, Phosphorylation of PFKP and PKM2 (from Extended Data Fig. 2e). d, PFKP and PKM2 activity in cells transfected with empty vector (Vec), D3/CDK6, or kinase-dead CDK6 (D3/CDK6-KD). e, PFKP and PKM2 activity after palbociclib-treatment. Data are mean ±s.d. *P<0.05; **P<0.01 (two-tailed t-test). b,c, representative experiments, out of 2 independent experiments (b), or 3 independent experiments (c, error bars from technical replicates). d,e, n=3 biological replicates. See Supplementary Fig. 1 for gel source data.
Figure 2
Figure 2. Metabolic changes in T-ALL cells upon inhibition of cyclin D3-CDK6
Flow of glucose-derived carbon into PPP (a), and serine pathway (b) following D3-CDK6 inhibition in T-ALL KOPTK1 cells expressing wild-type PFKP and PKM2 (KOPTK1-WT), or PFKP-S679E and PKM2-S37E mutants (KOPTK1-EE). Levels of NADPH (c), GSH (d), ROS (e) in T-ALL cell lines upon palbociclib-treatment. f, Apoptosis of cells treated with palbociclib and NAC. g, Apoptosis in KOPTK1-WT and KOPTK1-EE cells upon palbociclib-treatment, or following knockdown of CDK6 (h). i,j, In vivo apoptosis of T-ALL cells (in peripheral blood and bone marrow, gated on human CD45+cells) in mice xenografted with KOPTK1-WT or KOPTK1-EE cells. Data are mean ±s.d. *P<0.05; **P<0.01, ***P<0.001 (two-tailed t-test). a,b, n=4, c-h, n=3, i,j, n=5 biological replicates. See Source data for Fig. 2 for T-ALL xenograft experiments.
Figure 3
Figure 3
A model proposing how cyclin D3-CDK6 impacts tumor cell metabolism.
Figure 4
Figure 4. Analyses of human tumor cell lines expressing high cyclin D3-CDK6 levels
a,b, Phosphorylation of PFKP and PKM2 (from Extended Data Fig. 9i), PFKP and PKM2 activity (c,d), levels of NADPH (e), GSH (f), ROS (g) in palbociclib-treated D3/CDK6-high cells. h, Apoptosis of D3/CDK6-high EBC1 cells expressing wild-type PFKP and PKM2 (EBC1-WT), or PFKP-S679E and PKM2-S37E mutants (EBC1-EE). Data are mean ±s.d. *P<0.05; **P<0.01, ***P<0.001 (two-tailed t-test). a,b, representative experiments (out of 3 independent experiments, error bars from technical replicates), c-h, n=3 biological replicates.
Figure 5
Figure 5. Response of human tumor xenografts to CDK4/6-inhibition
PFKP and PKM2 phosphorylation (a,b, from Extended Data Fig. 10i, j), PFKP and PKM2 activity (c,d), GSH (e) and ROS (f) levels in D3/CDK6-high (regressing) and D3/CDK6-low (non-regressing) tumors from ribociclib-treated mice. Data are mean ±s.d. P<0.05; **P<0.01, ***P<0.001 (two-tailed t-test). n=3 biological replicates. See Source data for Fig. 5 for PDX drug treatment experiments.

Comment in

Similar articles

Cited by

References

    1. Malumbres M. Cyclin-dependent kinases. Genome Biol. 2014;15:122. - PMC - PubMed
    1. Sherr CJ, Beach D, Shapiro GI. Targeting CDK4 and CDK6: From Discovery to Therapy. Cancer Discov. 2015;6:353–367. - PMC - PubMed
    1. Deshpande A, Sicinski P, Hinds PW. Cyclins and cdks in development and cancer: a perspective. Oncogene. 2005;24:2909–2915. - PubMed
    1. Dean JL, Thangavel C, McClendon AK, Reed CA, Knudsen ES. Therapeutic CDK4/6 inhibition in breast cancer: key mechanisms of response and failure. Oncogene. 2010;29:4018–4032. - PubMed
    1. Puyol M, et al. A synthetic lethal interaction between K-Ras oncogenes and Cdk4 unveils a therapeutic strategy for non-small cell lung carcinoma. Cancer Cell. 2010;18:63–73. - PubMed

Publication types

MeSH terms