. 2018 Apr;18(2):319-330.
doi: 10.1038/tpj.2017.23. Epub 2017 Jun 13.

Genetic background influences susceptibility to chemotherapy-induced hematotoxicity

Affiliations

Genetic background influences susceptibility to chemotherapy-induced hematotoxicity

D M Gatti et al. Pharmacogenomics J. 2018 Apr.

Abstract

Hematotoxicity is a life-threatening side effect of many chemotherapy regimens. Although clinical factors influence patient responses, genetic factors may also play an important role. We sought to identify genomic loci that influence chemotherapy-induced hematotoxicity by dosing Diversity Outbred mice with one of three chemotherapy drugs; doxorubicin, cyclophosphamide or docetaxel. We observed that each drug had a distinct effect on both the changes in blood cell subpopulations and the underlying genetic architecture of hematotoxicity. For doxorubicin, we mapped the change in cell counts before and after dosing and found that alleles of ATP-binding cassette B1B (Abcb1b) on chromosome 5 influence all cell populations. For cyclophosphamide and docetaxel, we found that each cell population was influenced by distinct loci, none of which overlapped between drugs. These results suggest that susceptibility to chemotherapy-induced hematotoxicity is influenced by different genes for different chemotherapy drugs.


Conflict of interest statement

Conflict of Interest

DMG and GAC are employed by The Jackson Laboratory, which sells Diversity Outbred mice.

Figures

Figure 1
Figure 1
Changes in cell counts and body weight before and after dosing. The plots are organized with drugs in rows ((A) doxorubicin, (B) doxorubicin with CSF3, (C) cyclophosphamide and (D) docetaxel) and phenotypes in columns. Each panel plots the pre-dose (x-axis) value versus post-dose value (y-axis) for each mouse. Females are red and males are blue. Dashed lines plot the pre- and post-dose means for each sex. The black solid line along the diagonal shows where pre- and post-dose values would be equal. Points below the diagonal indicate a decrease in cell counts after dosing.
Figure 2
Figure 2
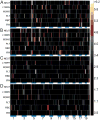
Heatmap of genetic mapping peaks shows that the hematotoxicity of each drug has a distinct genetic architecture. Each panel shows –log10(p-value) from genetic mapping of the change in cell counts or body weight for (A) doxorubicin, (B) doxorubicin + CSF3, (C) cyclophosphamide and (D) docetaxel. Brighter colors indicate greater significance. Values above –log10(p-value) = 6.2, which is equal to the pGW of 0.05, were set equal to 6.2 to reduce the effects of highly significant peaks.
Figure 3
Figure 3
Genome-wide association mapping plots of change in NEUT for (A) doxorubicin, (B) doxorubicin +CSF3, (C) cyclophosphamide, (D) docetaxel and (E) pre-dose NEUT. Each point plots the –log10(p-value) for the association between one SNP and the change in NEUT. Red lines show the pGW= 0.05 significance threshold. Orange triangles plot the locations of genes reported in the literature as being involved in the metabolism or transport of each drug. The peaks on distal chromosome 4 in Figures 3D and 3E are 20 Mb apart and do not overlap.
Figure 4
Figure 4
Association mapping of DOX-induced change in NEUT on chromosome 5 reveals two distinct loci with opposing effects. (A) X-axis shows the location in Mb on chromosome 5. Each colored line shows the effects for each founder allele as the log2-ratio of change in NEUT (see Methods). Founder allele effects on chromosome 5 for change in NEUT show that DO mice carrying the NOD (blue) or PWK (red) alleles have higher post-dose NEUT and mice carrying the CAST (green) allele have lower post-dose NEUT. (B) Estimated log2-ratio of the change in NEUT for each founder allele at 6.29 Mb on chromosome 5. Each bar and whisker shows the mean log2-ratio NEUT +/− standard error. Adding one NOD allele increases the log2-ratio NEUT by 1.3-fold and adding one CAST allele decreases log2-ratio NEUT by 0.61-fold. (C) Association mapping of the change in NEUT on proximal chromosome 5 reveals a set of significant SNPs for which NOD and PWK contribute the minor allele that is associated with higher post-dose NEUT. Each dot shows the –log10(p-value) for the association between change in NEUT and one SNP. SNPs above the dashed black line are highlighted in black and their minor allele is plotted in the top panel. The dotted line is the p = 0.05 significance threshold. The arrow denotes the most significant SNPs at which the effects are shown in panel D. (D) Log2-ratio of the change in NEUT versus the genotype at the most significant SNP in panel C (6.51 Mb on chromosome 5). Each dot represents one mouse. Red line show the least-squares fit and shaded region shows the 95% confidence interval. Dashed lines show the mean in each genotype group. Adding one NOD or PWK allele increases the log2-ratio NEUT by 1.3, which is the same as the increase in Figure 4B. (E) Association mapping of the change in NEUT after regressing out the first peak on proximal chromosome 5 reveals a set of significant SNPs for which CAST and PWK carry the minor allele that is associated with lower post-dose NEUT. Each dot shows the –log10(p-value) for the association between change in NEUT and one SNP. SNPs above the dashed black line are highlighted in black and their minor allele is plotted in the top panel. The dotted line is the p = 0.05 significance threshold. The arrow denotes the most significant SNPs at which the effects are shown in panel F. (F) Log2-ratio of the change in NEUT versus the genotype at the most significant SNP in panel E. (7.90 Mb on chromosome 5). Each dot represents one mouse. Red line show the least-squares fit and shaded region shows the 95% confidence interval. Adding one CAST or PWK allele decreases the log2-ratio NEUT by 0.44-fold, which is close to the values of 0.36 and 0.61 in Figure 4B.
Figure 5
Figure 5
Effect of knocking out ATP-binding cassette transporters on neutropenia. (A) The knockout alleles of Abcb1a are plotted on the x-axis versus the log2-ratio of post-dose over pre-dose NEUT. Each point represents one mouse. The red line is the least-squares fit and the pink shading is the 95% prediction interval for the fit. The p-value indicates whether the slope differs from zero. (B) Same as A, but for the Abcb1a and Abcb1b combined knockout. Each functional allele of Abcb1b produces a 2.2-fold increase in log2-ratio NEUT. (C) Same as A, but for the Abcb4 knockout. Each functional allele of Abcb4 produces a 1.2-fold increase in log2-ratio NEUT.
Figure 6
Figure 6
DO founder allele effects for NEUT and BW on Chr 5. The x-axis shows the position in Mb on chromosome 5. The y-axis plots the centered founder allele effects in standard deviations for (A) NEUT in mice dosed with DOX, (B) NEUT in mice dosed with DOX+CSF3, (C) BW in mice dosed with DOX, (D) BW in mice dosed with DOX+CSF3. The high NOD allele effects (dark blue) in A and B indicate that the NOD allele is protective for neutropenia. The low NOD allele effects in C and D indicate that the NOD allele is deleterious for BW. The CAST allele (green) also shows reversed allele effects between NEUT and BW.
Figure 7
Figure 7
Association mapping plots for (A) CYC on chromosome 11 and (B) TAX on chromosome 4. The top panel in each plot shows the minor allele for the SNPs that are highlighted in red in the middle panel. SNPs in the middle panel are highlighted in red if they are above the pGW = 0.05 significance threshold. Trp53 is highlighted in panel A as a candidate gene.

References

    1. Smallwood TL, Gatti DM, Quizon P, Weinstock GM, Jung KC, Zhao L, et al. High-resolution genetic mapping in the diversity outbred mouse population identifies Apobec1 as a candidate gene for atherosclerosis. G3 (Bethesda) 2014;4(12):2353–2363. - PMC - PubMed
    1. Callens C, Debled M, Delord M, Turbiez-Stalain I, Veyret C, Bieche I, et al. High-throughput pharmacogenetics identifies SLCO1A2 polymorphisms as candidates to elucidate the risk of febrile neutropenia in the breast cancer RAPP-01 trial. Breast Cancer Res Treat. 2015;153(2):383–389. - PubMed
    1. van der Slot AJ, Zuurmond AM, Bardoel AF, Wijmenga C, Pruijs HE, Sillence DO, et al. Identification of PLOD2 as telopeptide lysyl hydroxylase, an important enzyme in fibrosis. The Journal of biological chemistry. 2003;278(42):40967–40972. - PubMed
    1. Venkatareddy M, Wang S, Yang Y, Patel S, Wickman L, Nishizono R, et al. Estimating podocyte number and density using a single histologic section. J Am Soc Nephrol. 2014;25(5):1118–1129. - PMC - PubMed
    1. Schinkel AH, Mayer U, Wagenaar E, Mol CA, van Deemter L, Smit JJ, et al. Normal viability and altered pharmacokinetics in mice lacking mdr1-type (drug-transporting) P-glycoproteins. Proc Natl Acad Sci U S A. 1997;94(8):4028–4033. - PMC - PubMed

Publication types