. 2017 May 30;5(5):e1351.
doi: 10.1097/GOX.0000000000001351. eCollection 2017 May.

Prevention of Surgical Site Infections and Biofilms: Pharmacokinetics of Subcutaneous Cefazolin and Metronidazole in a Tumescent Lidocaine Solution

Affiliations

Prevention of Surgical Site Infections and Biofilms: Pharmacokinetics of Subcutaneous Cefazolin and Metronidazole in a Tumescent Lidocaine Solution

Jeffrey A Klein et al. Plast Reconstr Surg Glob Open. .

Abstract

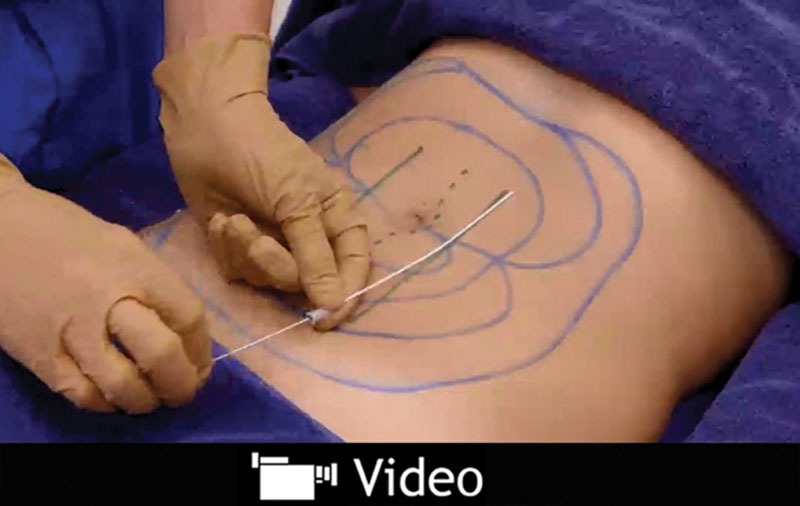
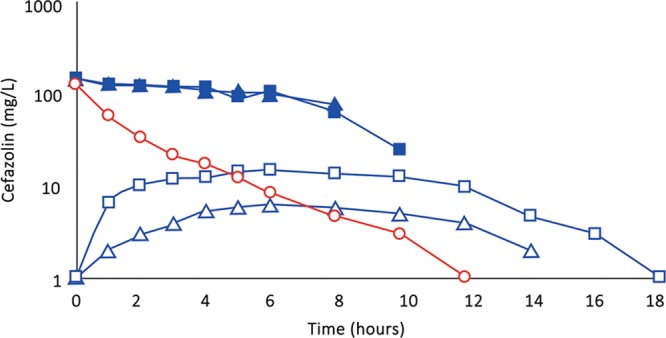
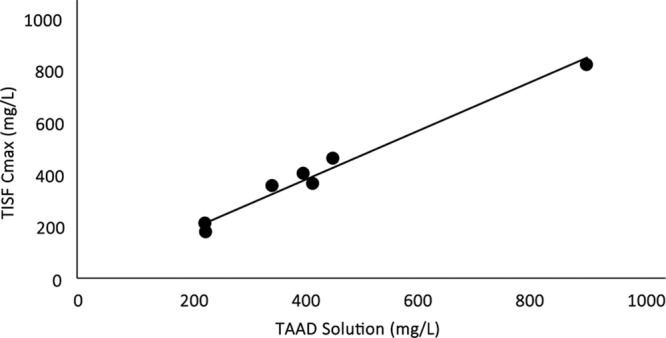
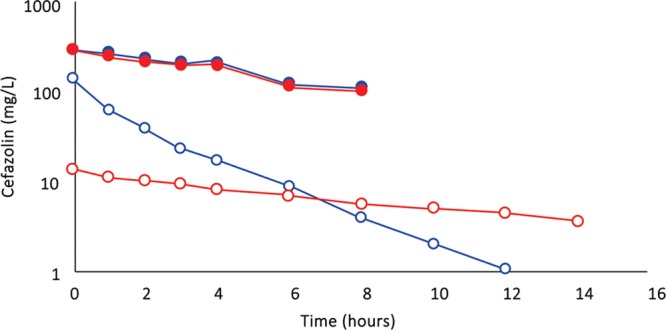
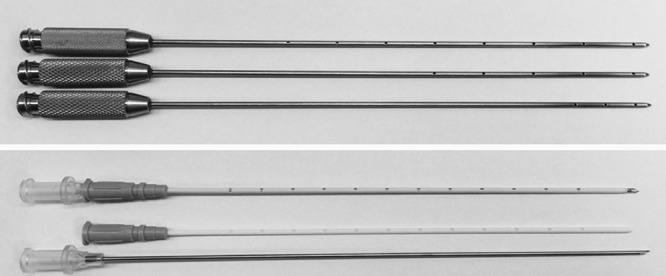
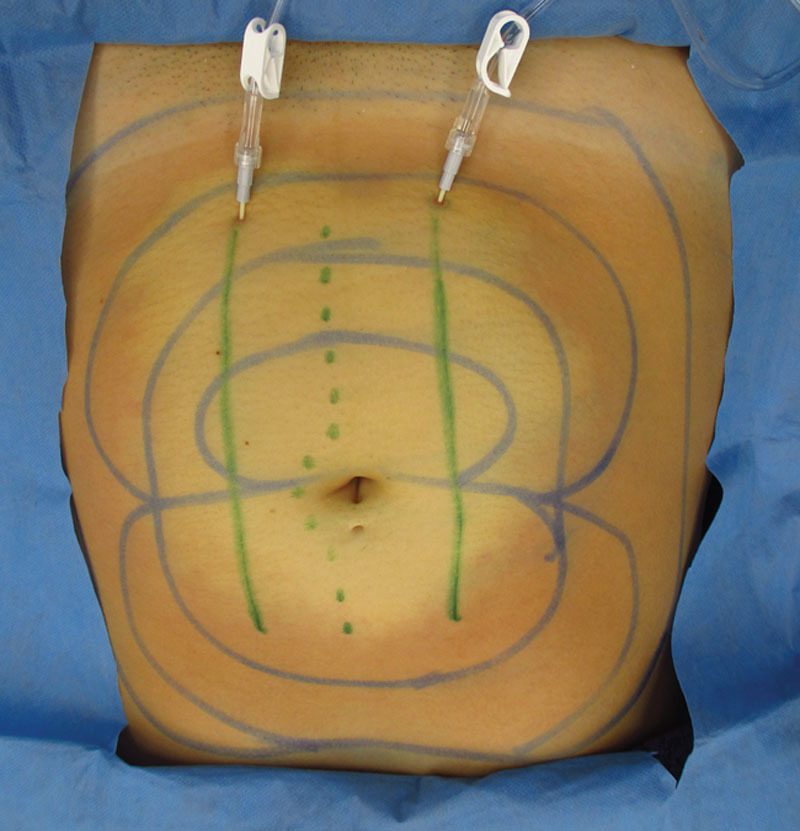
Background: Tumescent anesthesia antibiotic delivery (TAAD) consists of subcutaneous infiltration of antibiotic(s) dissolved tumescent lidocaine anesthesia. Tumescent lidocaine anesthesia contains lidocaine (≤ 1 g/L), epinephrine (≤ 1 mg/L), sodium bicarbonate (10 mEq/L) in 0.9% saline. Our aim was to measure cefazolin and metronidazole concentrations over time in subcutaneous tumescent interstitial fluid (TISF) after TAAD, in serum after TAAD and after intravenous antibiotic delivery (IVAD). We hypothesize that the pharmacokinetic/pharmacodynamic profiles of TAAD + IVAD are superior to IVAD alone for the prevention of surgical site infections and biofilms.

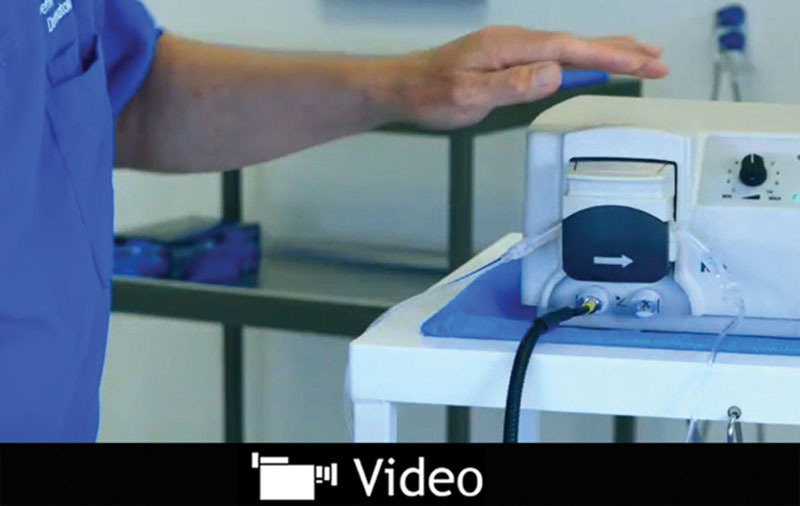
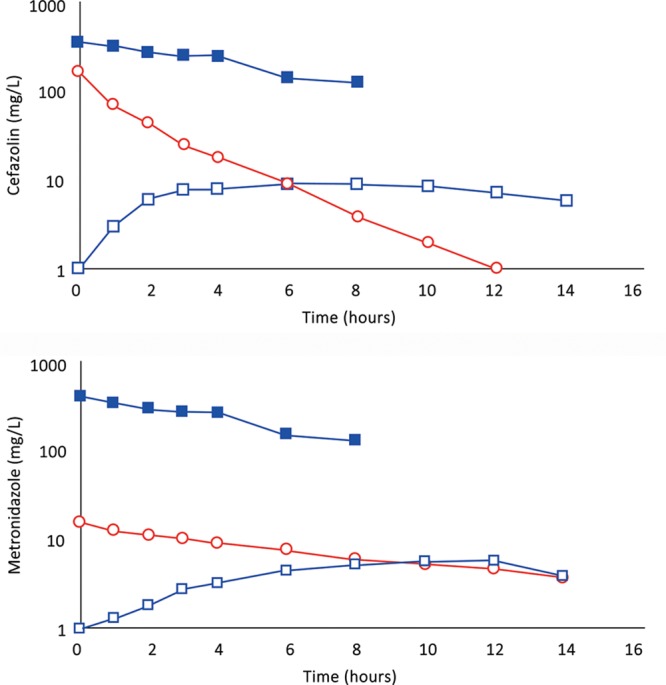
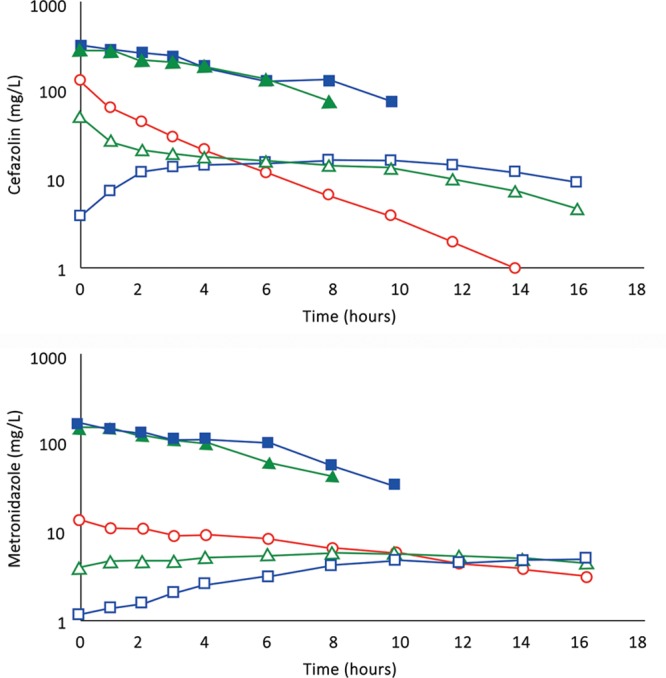
Methods: Concentrations of cefazolin and metronidazole in TISF and serum following TAAD and in serum following IVAD were compared in 5 female volunteers. Subjects received cefazolin or cefazolin plus metronidazole by IVAD alone and by TAAD alone. One subject also received concomitant IVAD and TAAD of these 2 antibiotics. Sequential samples of serum or subcutaneous TISF were assayed for antibiotic concentration.

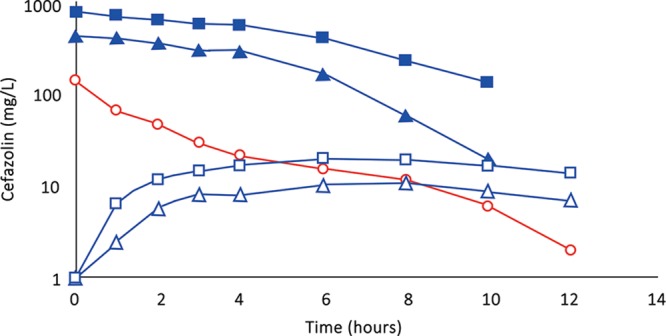
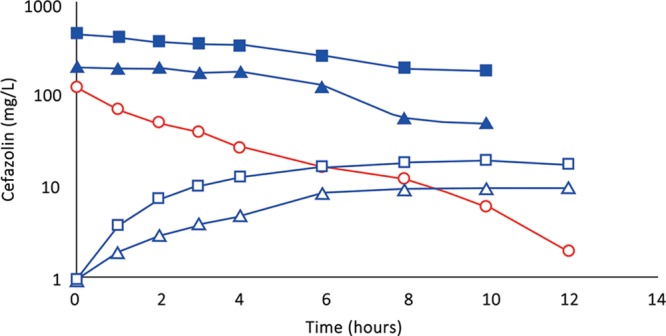
Results: Cefazolin (1 g) by TAAD resulted in an area under the curve of the concentration-time profile and a maximum concentration (Cmax) in subcutaneous tissue that were 16.5 and 5.6 times greater than in serum following 1 g by IVAD. Metronidazole (500 mg) by TAAD resulted in an area under the curve and Cmax that were 8.1 and 24.7 times greater in TISF, than in serum after 500 mg by intravenous delivery. IVAD + TAAD resulted in superior antibiotic concentrations to IVAD alone.

Conclusions: TAAD + IVAD produced superior antibiotic bioavailability in both subcutaneous interstitial fluid and serum compared with IVAD alone. There was no evidence that TAAD of cefazolin and metronidazole poses a significant risk of harm to patients.


Figures

Video Graphic 1.
Video Graphic 1.
See video, Supplemental Digital Content 10, which demonstrates the preferred technique for subcutaneous infiltration of TAAD solution using a multiholed plastic subcutaneous catheter, HK SubQKath. This video is available in the Related Videos section of the Full-Text article on PRSGlobalOpen.com or available at http://links.lww.com/PRSGO/A443.
Video Graphic 2.
Video Graphic 2.
See video, Supplemental Digital Content 11, which demonstrates the technique for painless subcutaneous infiltration of large volumes of TLA using multiholed stainless steel cannulas. This video is available in the Related Videos section of the Full-Text article on PRSGlobalOpen.com or available at http://links.lww.com/PRSGO/A444.
Fig. 1.
Fig. 1.
(Subject 1): Comparison of concentration–time profiles of cefazolin by IVAD (red) and TAAD (blue) into subcutaneous abdominal fat of a 74.3-kg female. Square symbols represent 1,000 mg by TAAD1 in a 900 mg/L solution. Triangle symbols represent 1,000 mg by TAAD2 in a 450 mg/L solution. Round red symbols show 1,000 mg by IVAD. Closed symbols represent concentrations in TISF, and open symbols are concentrations in serum.
Fig. 2.
Fig. 2.
(Subject 2): Comparison of concentration–time profiles of cefazolin by IVAD (red) and TAAD (blue) in the breasts of a 76.4-kg female. Square symbols represent 500 mg by TAAD1 in a 450 mg/L solution (one breast). Triangle symbols represent 500 mg by TAAD2 in a 225 mg/L solution (bilateral breasts). Round red symbols show 1,000 mg by IVAD. Closed symbols represent concentrations in TISF, and open symbols are concentrations in serum.
Fig. 3.
Fig. 3.
(Subject 3): Comparison of concentration–time profiles of cefazolin by IVAD (red) and TAAD (blue) into the hips and outer thighs of a 66.4-kg female. Square symbols represent 870 mg by TAAD1 in a 228 mg/L solution (bilateral). Triangle symbols represent 435 mg by TAAD2 in a 228 mg/L solution (one side). Round symbols show 1,000 mg by IVAD. Closed symbols represent concentrations in TISF, and open symbols are concentrations in serum.
Fig. 4.
Fig. 4.
A, (Subject 4): Comparison of cefazolin concentration–time profiles after 500 mg by IVAD (red, round symbols) and 500 mg by TAAD (blue, square symbols) in 413 mg/L solutions into subcutaneous abdominal fat of a 66.3-kg female. Closed symbols represent concentrations in TISF, and open symbols are concentrations in serum. B, (Subject 4): Comparison of metronidazole concentration–time profiles after 500 mg by IVAD (red, round symbols) and 500 mg by TAAD (blue, square symbols) in 413 mg/L solutions into subcutaneous abdominal fat of a 66.3-kg female. Closed symbols represent concentrations in TISF, and open symbols are concentrations in serum.
Fig. 5.
Fig. 5.
A, (Subject 5): Comparison of concentration–time profiles following 1,200 mg of cefazolin by IVAD1, by TAAD1, and by concomitant IVAD2 + TAAD2. Square blue symbols represent TAAD1 of a 1,200 mg/L solution. Triangle green symbols represent 800 mg by TAAD2 in a 800 mg/L solution with concomitant 400 mg by IVAD2. Round red symbols show 1,200 mg by IVAD1. Closed symbols represent concentrations in TISF, and open symbols are concentrations in serum. B, (Subject 5): Comparison of concentration–time profiles following 600 mg of metronidazole by IVAD1, TAAD1, and IVAD2 + TAAD2. Square blue symbols represent TAAD1 of a 600 mg/L solution. Triangle green symbols represent 400 mg by TAAD2 in a 400 mg/L solution with simultaneous 200 mg by IVAD2. Round red symbols show 600 mg by IVAD1. Closed symbols represent concentrations in TISF, and open symbols are concentrations in serum.
Fig. 6.
Fig. 6.
Following TAAD, there is a close correlation between the cefazolin concentration (mg/L) in the TAAD solution and the resulting peak (Cmax) cefazolin (mg/L) concentration in the TISF, with a coefficient of determination of R2 = 0.975.
Fig. 7.
Fig. 7.
(Subject 4): Comparison of cefazolin 500 mg (blue) and metronidazole 500 mg (red) concentration–time profiles in TISF (closed symbols) by TAAD in 413 mg/L solutions and in serum (open symbols) after 500 mg by IVAD. The pharmacokinetic profiles are distinctly different in serum after IVAD but virtually identical in TISF after TAAD.
Fig. 8.
Fig. 8.
A, There are 3 different types of stainless steel tumescent Monty infiltration cannulas. The Full Monty has holes distributed along nearly its entire length. The Half Monty has holes distributed along the distal half of the cannula. The Tip Monty has holes confined to the distal 2.5 cm of the cannula. The Monty cannulas can be inserted into subcutaneous fat, then withdrawn and reinserted in another direction. B, Over-the-needle subcutaneous catheter for TAAD consists of a 15 cm flexible plastic catheter, with holes distributed longitudinally along the distal 90% of the catheter length, and a sharp-tipped hollow stainless steel stylet, shown assembled and disassembled. The subcutaneous catheters are inserted into subcutaneous tissue and remain in one place throughout the entire process of TAAD infiltration.
Fig. 9.
Fig. 9.
Female abdomen demonstrating the visible blanching and tumescence following TAAD with bilateral tumescent infiltration catheters (solid green lines) inserted into subcutaneous fat parallel to a proposed midline abdominal incision (dotted green line).

Similar articles

Cited by

References

    1. Boehm O, Baumgarten G, Hoeft A. Epidemiology of the high-risk population: perioperative risk and mortality after surgery. Curr Opin Crit Care. 2015;21:322–327.. - PubMed
    1. Aiken AM, Karuri DM, Wanyoro AK, et al. Interventional studies for preventing surgical site infections in sub-Saharan Africa—a systematic review. Int J Surg. 2012;10:242–249.. - PMC - PubMed
    1. Viet Hung N, Anh Thu T, Rosenthal VD, et al. Surgical site infection rates in seven cities in Vietnam: findings of the International Nosocomial Infection Control Consortium. Surg Infect (Larchmt). 2016;17:243–249.. - PubMed
    1. Toma O, Suntrup P, Stefanescu A, et al. Pharmacokinetics and tissue penetration of cefoxitin in obesity: implications for risk of surgical site infection. Anesth Analg. 2011;113:730–737.. - PubMed
    1. Hu H, Johani K, Almatroudi A, et al. Bacterial biofilm infection detected in breast implant-associated anaplastic large-cell lymphoma. Plast Reconstr Surg. 2016;137:1659–1669.. - PubMed

LinkOut - more resources