

Diffusion-weighted imaging for assessment of synovial inflammation in juvenile idiopathic arthritis: a promising imaging biomarker as an alternative to gadolinium-based contrast agents
- PMID: 28608162
- PMCID: PMC5635098
- DOI: 10.1007/s00330-017-4876-y
Diffusion-weighted imaging for assessment of synovial inflammation in juvenile idiopathic arthritis: a promising imaging biomarker as an alternative to gadolinium-based contrast agents
Erratum in
-
Correction to: Diffusion-weighted imaging for assessment of synovial inflammation in juvenile idiopathic arthritis: a promising imaging biomarker as an alternative to gadolinium-based contrast agents.Eur Radiol. 2019 Jun;29(6):3319-3320. doi: 10.1007/s00330-018-5881-5. Eur Radiol. 2019. PMID: 30506215 Free PMC article.
Abstract
Objectives: To compare dynamic-contrast-enhanced MRI (DCE) and diffusion-weighted imaging (DWI) in quantifying synovial inflammation in juvenile idiopathic arthritis (JIA).
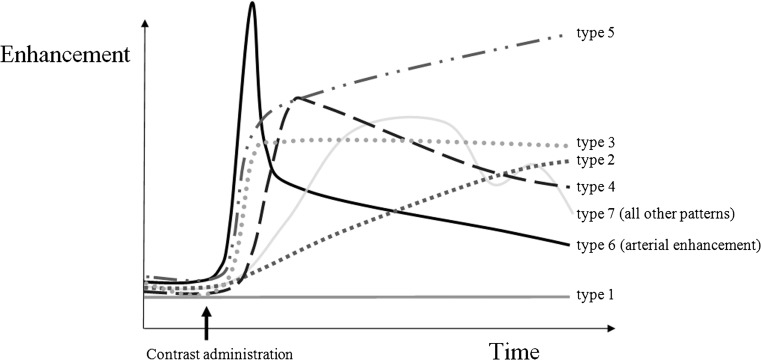
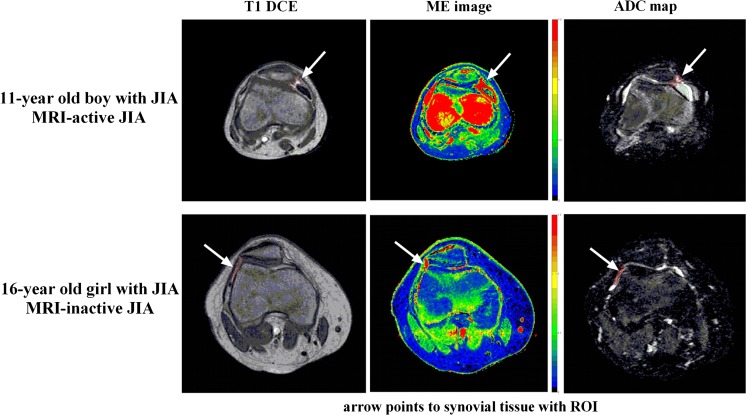
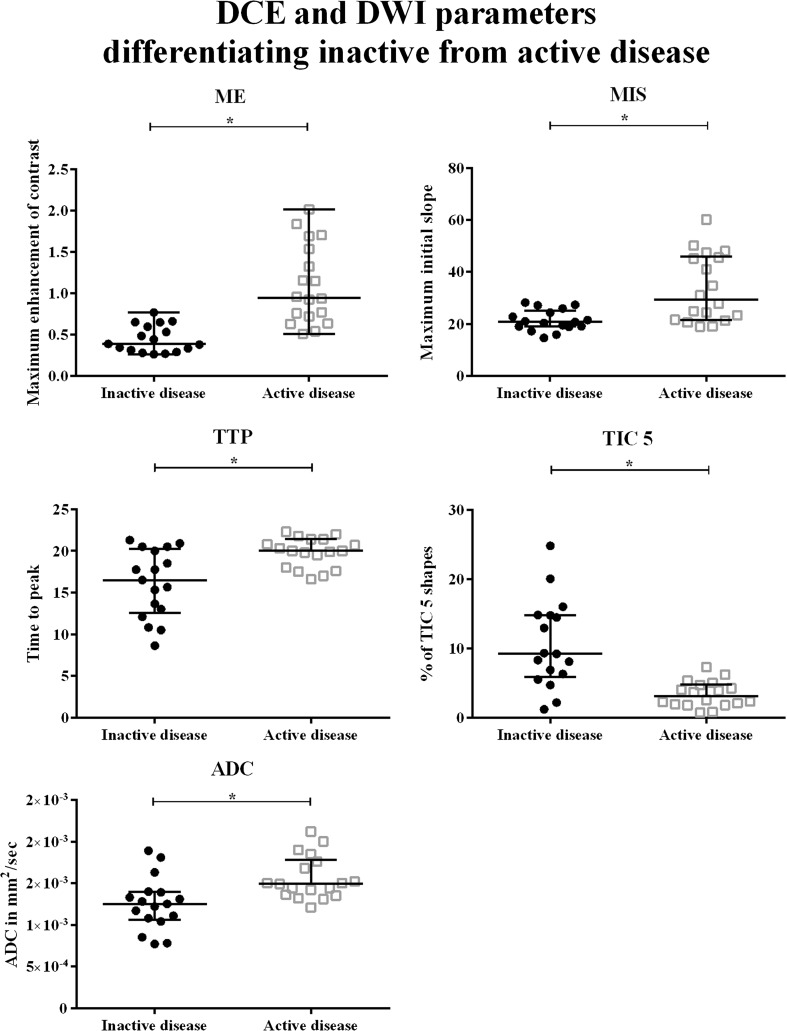
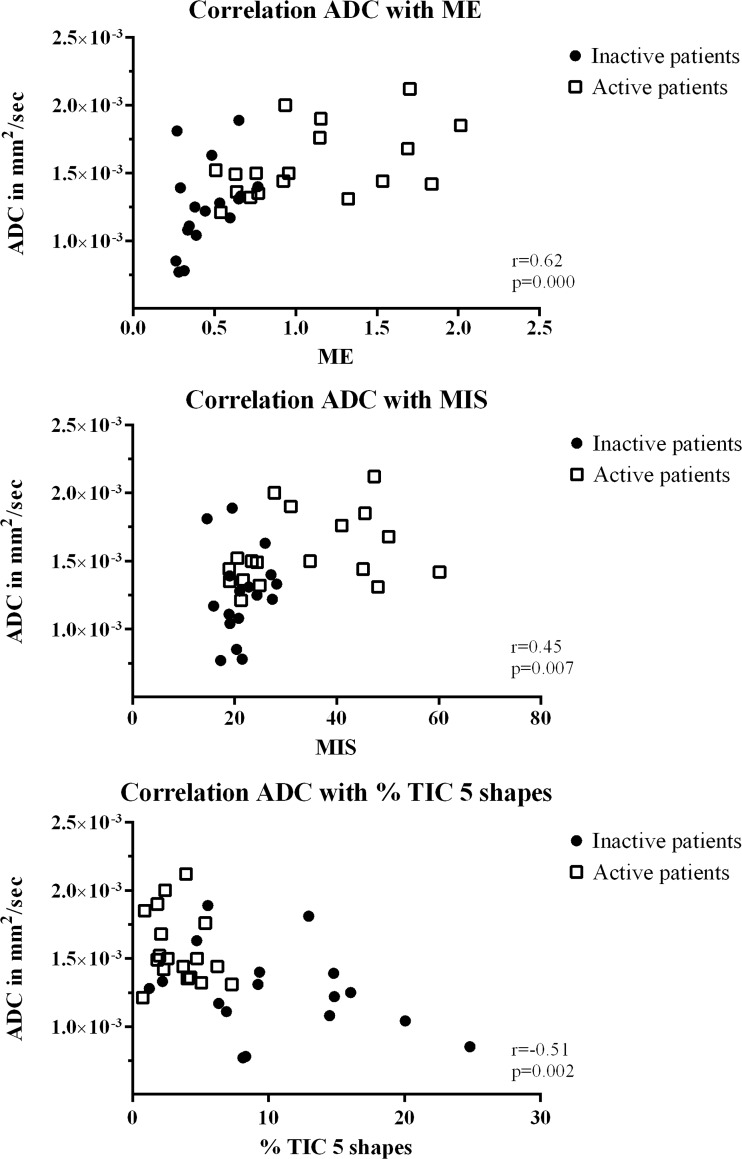
Methods: Regions of interest (ROI) were drawn in the synovium of JIA patients on T1 DCE and T2 DWI, followed by extraction of the maximum enhancement (ME), maximum initial slope (MIS), time to peak (TTP), % of different time intensity curve shapes (TIC) and apparent diffusion coefficient (ADC) of the ROIs. Mann-Whitney-U test was used for comparing parameters between MRI-active and -inactive patients (defined by the juvenile arthritis MRI scoring system). Spearman's rank was used to analyse the correlation between DCE and DWI.
Results: Thirty-five JIA patients (18 MRI active and 17 MRI inactive) were included. Median age was 13.1 years and 71% were female. ME, MIS, TTP, % TIC 5 and ADC were significantly different in MRI-active versus MRI-inactive JIA with median ADC 1.49 × 10⁻³mm2/s in MRI-active and 1.25 × 10⁻³mm2/s in MRI-inactive JIA, p = 0.001, 95% confidence interval of difference in medians =0.11-0.53 × 10⁻³mm2/s. ADC correlated to ME, MIS and TIC 5 shapes (r = 0.62, r = 0.45, r = -0.51, respectively, all p < 0.05).
Conclusions: Similar to DCE parameters, DWI-derived ADC is significantly different in MRI-active JIA as compared to MRI-inactive JIA. The non-invasiveness of DWI combined with its possibility to detect synovial inflammation shows the potential of DWI.
Key points: • MRI can quantify: dynamic contrast-enhanced and diffusion-weighted MRI can quantify synovitis • Both DWI and DCE can differentiate active from inactive JIA • The DWI-derived apparent diffusion coefficient (ADC) is higher in active JIA • DWI is non-invasive and thus safer and more patient-friendly • DWI is a potentially powerful and non-invasive imaging biomarker for JIA.
Keywords: Arthritis; Diffusion magnetic resonance imaging; Juvenile arthritis; Knee joint; Magnetic resonance imaging.
Conflict of interest statement
The authors of this manuscript declare no relationships with any companies, whose products or services may be related to the subject matter of the article.
Figures

Similar articles
-
Readout-segmented multi-shot diffusion-weighted MRI of the knee joint in patients with juvenile idiopathic arthritis.Pediatr Rheumatol Online J. 2017 Oct 12;15(1):73. doi: 10.1186/s12969-017-0203-z. Pediatr Rheumatol Online J. 2017. PMID: 29025422 Free PMC article.
-
Intravoxel incoherent motion magnetic resonance imaging of the knee joint in children with juvenile idiopathic arthritis.Pediatr Radiol. 2017 May;47(6):681-690. doi: 10.1007/s00247-017-3800-6. Epub 2017 Mar 10. Pediatr Radiol. 2017. PMID: 28283723
-
Feasibility of diffusion-weighted magnetic resonance imaging in patients with juvenile idiopathic arthritis on 1.0-T open-bore MRI.Skeletal Radiol. 2015 Dec;44(12):1805-11. doi: 10.1007/s00256-015-2208-3. Epub 2015 Jul 24. Skeletal Radiol. 2015. PMID: 26205760 Free PMC article.
-
Current status of MR imaging of juvenile idiopathic arthritis.Best Pract Res Clin Rheumatol. 2020 Dec;34(6):101629. doi: 10.1016/j.berh.2020.101629. Epub 2020 Dec 3. Best Pract Res Clin Rheumatol. 2020. PMID: 33281052 Review.
-
Diagnosing osteomyelitis in diabetic foot by diffusion-weighted imaging and dynamic contrast material-enhanced magnetic resonance imaging: a systematic review and meta-analysis.Clin Radiol. 2024 Nov;79(11):805-817. doi: 10.1016/j.crad.2024.07.015. Epub 2024 Jul 26. Clin Radiol. 2024. PMID: 39168784
Cited by
-
Fluid-Attenuated Inversion Recovery Sequence with Fat Suppression for Assessment of Ankle Synovitis without Contrast Enhancement: Comparison with Contrast-Enhanced MRI.Diagnostics (Basel). 2023 Jun 4;13(11):1960. doi: 10.3390/diagnostics13111960. Diagnostics (Basel). 2023. PMID: 37296812 Free PMC article.
-
What's New for Clinical Whole-body MRI (WB-MRI) in the 21st Century.Br J Radiol. 2020 Nov 1;93(1115):20200562. doi: 10.1259/bjr.20200562. Epub 2020 Sep 9. Br J Radiol. 2020. PMID: 32822545 Free PMC article. Review.
-
Keeping up with the progress in the diagnosis and management of pediatric rheumatic diseases.World J Pediatr. 2020 Feb;16(1):1-4. doi: 10.1007/s12519-020-00340-w. World J Pediatr. 2020. PMID: 32026149 No abstract available.
-
Advanced Magnetic Resonance Imaging and Molecular Imaging of the Painful Knee.Semin Musculoskelet Radiol. 2023 Dec;27(6):618-631. doi: 10.1055/s-0043-1775741. Epub 2023 Nov 7. Semin Musculoskelet Radiol. 2023. PMID: 37935208 Free PMC article. Review.
-
Imaging update in inflammatory arthritis.J Clin Orthop Trauma. 2021 Jun 30;20:101491. doi: 10.1016/j.jcot.2021.101491. eCollection 2021 Sep. J Clin Orthop Trauma. 2021. PMID: 34290958 Free PMC article.
References
-
- Hemke R, Doria AS, Tzaribachev N, Maas M, van der Heijde DM, van Rossum MA. Selecting magnetic resonance imaging (MRI) outcome measures for juvenile idiopathic arthritis (JIA) clinical trials: first report of the MRI in JIA special interest group. J Rheumatol. 2014;41:354–358. doi: 10.3899/jrheum.131081. - DOI - PubMed
Publication types
MeSH terms
Substances
LinkOut - more resources
Full Text Sources
Other Literature Sources
Medical
