. 2017 Jun 13:8:15691.
doi: 10.1038/ncomms15691.

Cellular senescence drives age-dependent hepatic steatosis

Affiliations

Cellular senescence drives age-dependent hepatic steatosis

Mikolaj Ogrodnik et al. Nat Commun. .

Abstract

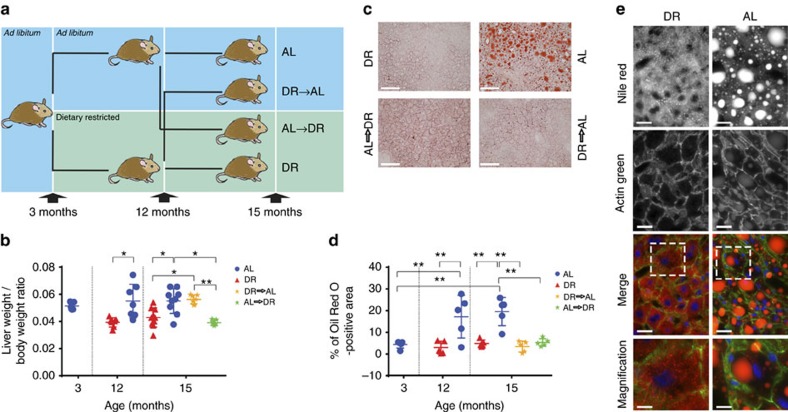
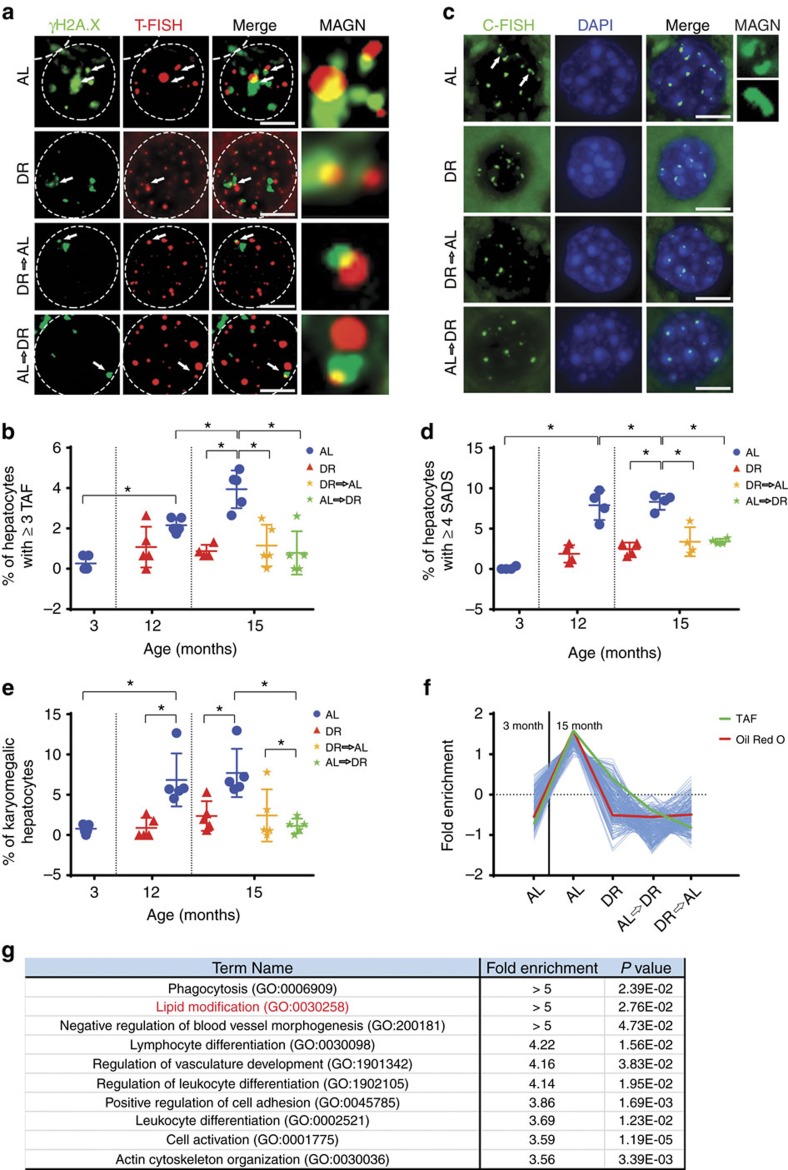
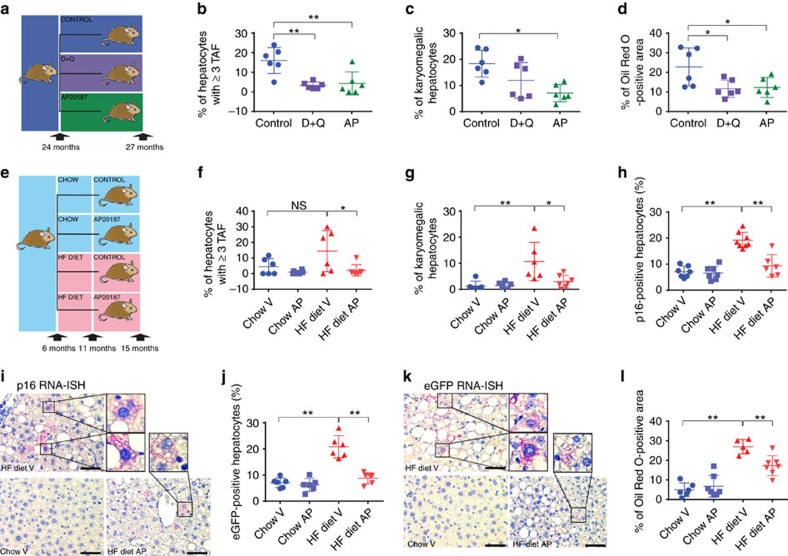
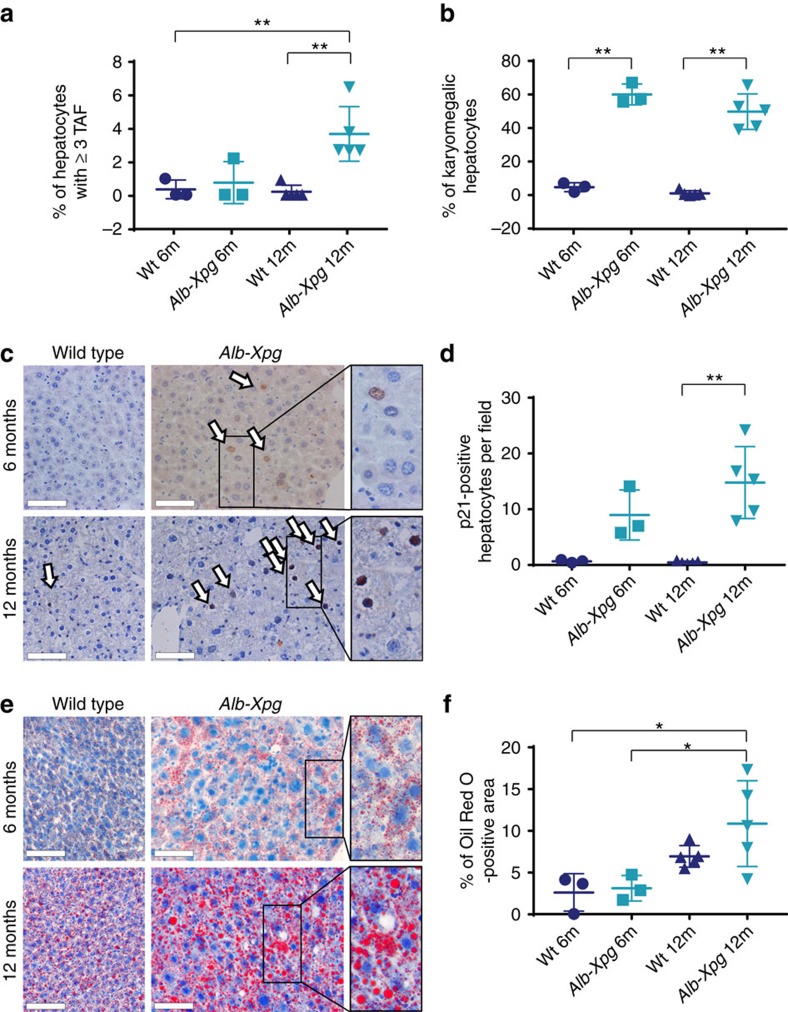
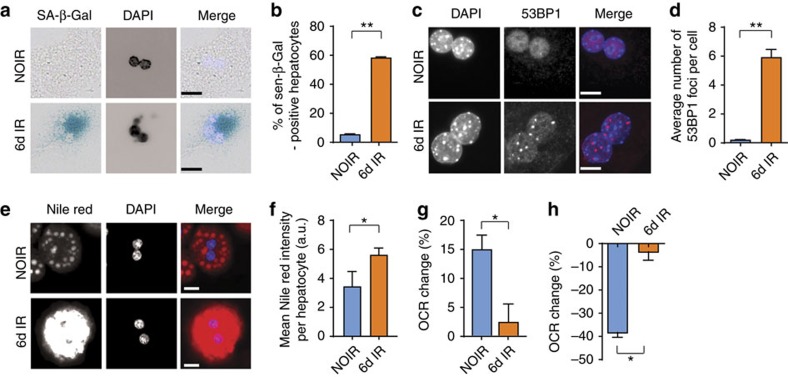
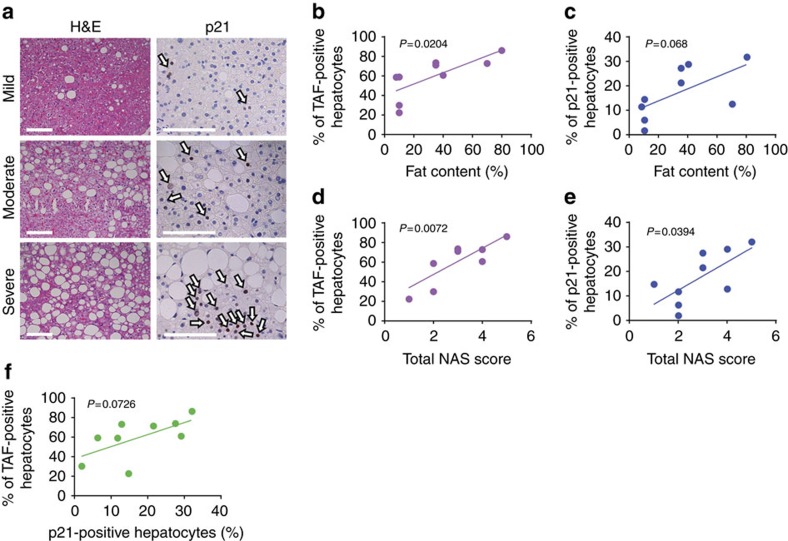
The incidence of non-alcoholic fatty liver disease (NAFLD) increases with age. Cellular senescence refers to a state of irreversible cell-cycle arrest combined with the secretion of proinflammatory cytokines and mitochondrial dysfunction. Senescent cells contribute to age-related tissue degeneration. Here we show that the accumulation of senescent cells promotes hepatic fat accumulation and steatosis. We report a close correlation between hepatic fat accumulation and markers of hepatocyte senescence. The elimination of senescent cells by suicide gene-meditated ablation of p16Ink4a-expressing senescent cells in INK-ATTAC mice or by treatment with a combination of the senolytic drugs dasatinib and quercetin (D+Q) reduces overall hepatic steatosis. Conversely, inducing hepatocyte senescence promotes fat accumulation in vitro and in vivo. Mechanistically, we show that mitochondria in senescent cells lose the ability to metabolize fatty acids efficiently. Our study demonstrates that cellular senescence drives hepatic steatosis and elimination of senescent cells may be a novel therapeutic strategy to reduce steatosis.


Conflict of interest statement

Patents on INK-ATTAC mice and senolytic drugs are held by Mayo Clinic and licensed to Unity Biotechnology. J.L.K., A.P. and T.T. may gain financially from these patents and licenses. This research has been reviewed by the Mayo Clinic Conflict of Interest Review Board and is being conducted in compliance with Mayo Clinic conflict of interest policies. The remaining authors declare no competing financial interests.

Figures

Figure 1
Figure 1. DR is protective against liver fat deposition.
(a) Three-month-old male mice were split into two groups and assigned to ad libitum (AL) or dietary restricted (DR) food supply (animals were matched by body mass and food intake). DR animals were offered 60% of AL intake as one food ration per day. After 9 months of diet (at the age of 12 months), mice were split into 4 groups liver-weight to body-weight: AL (remaining on AL feeding, n=9), DR (remaining on DR feeding, n=10), AL to DR (switching from AL to restricted food supply, n=7), and DR to AL (switching from restricted to AL food supply, n=7). Animals stayed on the assigned food regime for 3 months until killed at 15 months of age. (b) Liver-weight to body-weight ratios in all the experimental groups. Data per animal (dots) and means±s.d. are shown. (c) Micrographs showing Oil Red O staining on frozen liver sections in 15-month-old animals in the indicated groups (red=Oil Red O, blue=haematoxylin, scale bar 100 μm). (d) Percentage of Oil Red O staining was determined using ImageJ (n=5). (e) Representative micrographs showing decreased Nile red staining in DR in comparison to AL animals at 15 month of age (scale bar 20 μm, in Merge: blue=DAPI, red=Nile red, green=Actin green). Grade of steatosis was independently assessed by a liver pathologist who confirmed Oil Red O and Nile red results. All data are mean±s.d. with 5–10 animals per group. Significant differences (one-way analysis of variance) are indicated with *P≤0.05 and **P≤0.001.
Figure 2
Figure 2. DR is protective against cellular senescence.
(a) Representative images showing γH2A.X (green) and telomere fluorescent in situ hybridization (FISH; red) in hepatocyte nuclei of the indicated animals at 15 months of age. White arrows indicate TAF. Panel ‘MAGN’ shows co-localization of γH2A.X and telomeres at higher magnification. (10 images per liver are taken containing 15–20 hepatocytes each, scale bar 4 μm). (b) Percentage of hepatocytes with ≥3 TAF (n=5, 100–150 hepatocytes per n). (c) Representative images showing peri/centromeric satellite DNA signals (SADS). These signals are tightly compacted in cycling cells but distant in senescent cells. Micrographs showing single hepatocyte nuclei with centromere FISH (green) and DAPI staining (blue) in the indicated groups at 15 months of age. White arrows indicate SADS, which are shown in higher magnification at the right. (10 images per liver are taken containing 10–20 hepatocytes each, scale bar 4 μm). (d) Percentage of hepatocytes with ≥4 SADS (n=4, 100–150 hepatocytes per n). (e) Percentage of karyomegalic hepatocytes in all experimental groups (n=5, 100–140 hepatocytes per n). (f) Cluster analysis of RNA abundance as analysed by RNA-seq analysis identified 709 transcripts that follow the pattern of Oil Red O and TAF. (g) Transcripts identified in f were subjected to GO-term analysis for biological process using PANTHER. Ten pathways were over-represented (false discovery rate ≤5%), including lipid modification and inflammatory/immune system response. All data are mean±s.d. with 4–5 animals per group. Significant differences (one-way analysis of variance) are indicated with *P≤0.05 and **P≤0.001.
Figure 3
Figure 3. Elimination of senescent cells decreases fat accumulation in the liver.
(a) Twenty-four-month-old C57Bl/6(INK-ATTAC) male mice were split into three groups and assigned to control (n=6), AP20187 (n=6) or senolytic (D+Q, n=6) treatment for 3 months. Percentage (b) of hepatocytes positive for TAF, (c) of karyomegalic hepatocytes and (d) of Oil Red O staining per area was decreased in animals treated with AP20187 and senolytic drugs at 27 months of age. (e) Six-month-old C57Bl/6(INK-ATTAC) male mice were split into four groups and assigned to chow (n=8) or high fat (HF, n=8) diet and treated at 11 months of age with vehicle (n=8) or AP20187(n=8) treatment until 15 months of age. (f) Percentage of hepatocytes positive for ≥3 TAF (n=6) and (g) percentage of karyomegalic hepatocytes area were significantly increased in animals fed a HF diet and significantly decreased in animals treated with AP20187 (n=6–7). RNA-ISH for (h,i) p16 and (j,k) eGFP shows a significant increase in p16- and eGFP-positive hepatocytes in HF-fed mice and a significant decrease after treatment with AP20187. (i,k) Representative images of IHC RNA-ISH staining for eGFP and p16 in mouse liver (red/pink=p16/eGFP, blue=haematoxylin, n=6–8, 10–20 images per liver). Scale bars, 100 μm. (l) Percentage of Oil Red O staining per area increases significantly in mice on HF diet and decreases after treatment with AP20187 (n=6–7). All data are mean±s.d. with 6–8 animals per group. Significant differences (one-way analysis of variance) are indicated with *P≤0.05 and **P≤0.001.
Figure 4
Figure 4. Hepatocyte-specific senescence leads to fat accumulation in the liver.
(a) Six (n=3) and 12 month (n=5) old Alb-Xpg mice show increased numbers of hepatocytes positive for TAF. (b) Alb-Xpg mice display increased percentage of karyomegalic hepatocytes. (c) Representative images of p21 IHC staining in mouse liver. (arrows indicate positive cells and area in rectangle can be seen magnified at the right, scale bar=100 μm, brown=p21, blue=haematoxylin) (d) Immunohistochemistry staining shows significantly increased levels of p21-positive hepatocytes in 12-month-old Alb-Xpg mice. (e) Representative images of Oil Red O staining in the mouse liver (area in rectangle can be seen magnified at the right, scale bar=100 μm, red=Oil Red O, blue=haematoxylin). (f) Percentage of Oil Red O staining per area is significantly increased in Alb-Xpg mice at 12 months of age. All data are mean±s.d. with 3–5 animals per group. Significant differences (one-way analysis of variance) are indicated with *P≤0.05 and **P≤0.001.
Figure 5
Figure 5. Induction of senescence in hepatocytes causes mitochondrial dysfunction and reduces fatty acid oxidation capacity.
Hepatocytes isolated from wild-type C57Bl/6 mice acquire a senescent phenotype 6 days after 10 Gy X-ray irradiation: (a) representative images showing SA-β-Gal in non-irradiated cells (NOIR) and 6 days after irradiation, Merge: light blue=DAPI, dark blue=SA-β-Gal, scale bar, 20 μm; (b) frequencies of SA-β-Gal-positive hepatocytes and (c) representative images showing 53BP1 staining in NOIR and 6 days after irradiation. Merge: blue=DAPI, red=53BP1, scale bar 10 μm; (d) average number of 53BP1 foci per cell are significantly increased 6 days after irradiation. (e) Representative images showing Nile red staining in NOIR and 6 days after IR. Merge: blue=DAPI, red=Nile red, scale bar scale bar 20 μm. (f) Average fluorescence intensity of Nile red staining in senescent or non-senescent hepatocytes. (g) Change in OCR in senescent or non-senescent hepatocytes after addition of the fatty acid palmitate as substrate; (h) change in OCR in senescent or non-senescent hepatocytes after inhibition of fatty acid oxidation by etomoxir. Data in b,g,h are mean±s.e.m. and in d,f are mean±s.d. with 3–4 animals per group. Significant differences (t-test) are indicated with *P≤0.05 and **P≤0.001.
Figure 6
Figure 6. Markers of hepatocyte senescence correlate with severity of NAFLD.
(a) Representative images showing H&E and p21 immunohistochemistry in patients with mild, moderate and severe NAFLD (arrows indicate p21-positive cells (brown), blue=haematoxylin, scale bar, 100 μm). Mean frequencies of (b) TAF (R2=0.5596) and (c) p21-positive hepatocytes per patient increase with the liver fat content in NAFLD patients (R2=0.3991). Frequencies of (d) TAF (R2=0.6668) and (e) p21-positive hepatocytes correlate with the NAS score of NAFLD patients (R2=0.4769). (f) Frequencies of TAF-positive hepatocytes correlate weakly with the frequencies of p21-positive hepatocytes per patient (R2=0.3893). All data are means (frequencies of TAF+ and p21+ cells, fat content) or scores per patient, n=9.

Comment in

References

    1. Hardy T., Oakley F., Anstee Q. M. & Day C. P. Nonalcoholic fatty liver disease: pathogenesis and disease spectrum. Annu. Rev. Pathol. 11, 451–496 (2016). - PubMed
    1. Duval C. et al.. Adipose tissue dysfunction signals progression of hepatic steatosis towards nonalcoholic steatohepatitis in C57Bl/6 mice. Diabetes 59, 3181–3191 (2010). - PMC - PubMed
    1. González-Rodríguez Á. et al.. Impaired autophagic flux is associated with increased endoplasmic reticulum stress during the development of NAFLD. Cell Death Dis. 5, e1179 (2014). - PMC - PubMed
    1. Kumar A. et al.. Patients with nonalcoholic fatty liver disease (NAFLD) have higher oxidative stress in comparison to chronic viral hepatitis. J. Clin. Exp. Hepatol. 3, 12–18 (2013). - PMC - PubMed
    1. Passos J. F., Saretzki G. & von Zglinicki T. DNA damage in telomeres and mitochondria during cellular senescence: is there a connection? Nucleic Acids Res. 35, 7505–7513 (2007). - PMC - PubMed

Publication types

MeSH terms