Detection of precancerous lesions in the oral cavity using oblique polarized reflectance spectroscopy: a clinical feasibility study
- PMID: 28609512
- PMCID: PMC5469421
- DOI: 10.1117/1.JBO.22.6.065002
Detection of precancerous lesions in the oral cavity using oblique polarized reflectance spectroscopy: a clinical feasibility study
Abstract
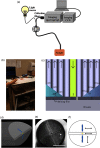
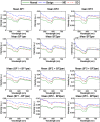
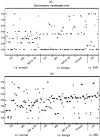
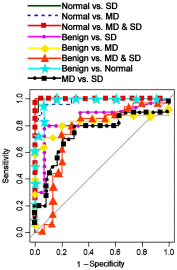
We developed a multifiber optical probe for oblique polarized reflectance spectroscopy (OPRS) in vivo and evaluated its performance in detection of dysplasia in the oral cavity. The probe design allows the implementation of a number of methods to enable depth resolved spectroscopic measurements including polarization gating, source–detector separation, and differential spectroscopy; this combination was evaluated in carrying out binary classification tasks between four major diagnostic categories: normal, benign, mild dysplasia (MD), and severe dysplasia (SD). Multifiber OPRS showed excellent performance in the discrimination of normal from benign, MD, SD, and MD plus SD yielding sensitivity/specificity values of 100%/93%, 96%/95%, 100%/98%, and 100%/100%, respectively. The classification of benign versus dysplastic lesions was more challenging with sensitivity and specificity values of 80%/93%, 71%/93%, and 74%/80% in discriminating benign from SD, MD, and SD plus MD categories, respectively; this challenge is most likely associated with a strong and highly variable scattering from a keratin layer that was found in these sites. Classification based on multiple fibers was significantly better than that based on any single detection pair for tasks dealing with benign versus dysplastic sites. This result indicates that the multifiber probe can perform better in the detection of dysplasia in keratinized tissues.
Figures





Similar articles
-
Probing local tissue changes in the oral cavity for early detection of cancer using oblique polarized reflectance spectroscopy: a pilot clinical trial.J Biomed Opt. 2008 Mar-Apr;13(2):024011. doi: 10.1117/1.2907450. J Biomed Opt. 2008. PMID: 18465974 Clinical Trial.
-
Noninvasive evaluation of oral lesions using depth-sensitive optical spectroscopy.Cancer. 2009 Apr 15;115(8):1669-79. doi: 10.1002/cncr.24177. Cancer. 2009. PMID: 19170229 Free PMC article.
-
Autofluorescence and diffuse reflectance spectroscopy for oral oncology.Lasers Surg Med. 2005 Jun;36(5):356-64. doi: 10.1002/lsm.20122. Lasers Surg Med. 2005. PMID: 15856507 Clinical Trial.
-
The use of optical spectroscopy for in vivo detection of cervical pre-cancer.Lasers Med Sci. 2014 Mar;29(2):831-45. doi: 10.1007/s10103-013-1288-3. Epub 2013 Mar 7. Lasers Med Sci. 2014. PMID: 23467754 Review.
-
The status of in vivo autofluorescence spectroscopy and imaging for oral oncology.Oral Oncol. 2005 Feb;41(2):117-31. doi: 10.1016/j.oraloncology.2004.07.007. Oral Oncol. 2005. PMID: 15695112 Review.
Cited by
-
Optical Biopsy of the Upper GI Tract Using Fluorescence Lifetime and Spectra.Front Physiol. 2020 May 13;11:339. doi: 10.3389/fphys.2020.00339. eCollection 2020. Front Physiol. 2020. PMID: 32477151 Free PMC article.
-
A Sensitive Fibre Optic Probe for Autofluorescence Spectroscopy of Oral Tongue Cancer: Monte Carlo Simulation Study.Biomed Res Int. 2020 Apr 8;2020:1936570. doi: 10.1155/2020/1936570. eCollection 2020. Biomed Res Int. 2020. PMID: 32337228 Free PMC article.
-
Bimodal multispectral imaging system with cloud-based machine learning algorithm for real-time screening and detection of oral potentially malignant lesions and biopsy guidance.J Biomed Opt. 2021 Aug;26(8):086003. doi: 10.1117/1.JBO.26.8.086003. J Biomed Opt. 2021. PMID: 34402266 Free PMC article.
References
-
- Howlader N. A., et al., Eds., “SEER cancer statistics review, 1975–2010,” National Cancer Institute, Bethesda, Maryland, 2012, http://seer.cancer.gov/csr/1975_2010/ (April 2013).
-
- Myers J., Oral Cancer Metastasis, Springer Science & Business Media, New York: (2009).
MeSH terms
Grants and funding
LinkOut - more resources
Full Text Sources
Other Literature Sources

