

Association Between Elevated Brain Amyloid and Subsequent Cognitive Decline Among Cognitively Normal Persons
- PMID: 28609533
- PMCID: PMC5736301
- DOI: 10.1001/jama.2017.6669
Association Between Elevated Brain Amyloid and Subsequent Cognitive Decline Among Cognitively Normal Persons
Abstract
Importance: Among cognitively normal individuals, elevated brain amyloid (defined by cerebrospinal fluid assays or positron emission tomography regional summaries) can be related to risk for later Alzheimer-related cognitive decline.
Objective: To characterize and quantify the risk for Alzheimer-related cognitive decline among cognitively normal individuals with elevated brain amyloid.
Design, setting, and participants: Exploratory analyses were conducted with longitudinal cognitive and biomarker data from 445 cognitively normal individuals in the United States and Canada. Participants were observed from August 23, 2005, to June 7, 2016, for a median of 3.1 years (interquartile range, 2.0-4.2 years; maximum follow-up, 10.3 years) as part of the Alzheimer's Disease Neuroimaging Initiative (ADNI).
Exposures: Individuals were classified at baseline as having normal (n = 243) or elevated (n = 202) brain amyloid using positron emission tomography amyloid imaging or a cerebrospinal fluid assay of amyloid β.
Main outcomes and measures: Outcomes included scores on the Preclinical Alzheimer Cognitive Composite (PACC; a sum of 4 baseline standardized z scores, which decreases with worse performance), Mini-Mental State Examination (MMSE; 0 [worst] to 30 [best] points), Clinical Dementia Rating Sum of Boxes (CDR-Sum of Boxes; 0 [best] to 18 [worst] points), and Logical Memory Delayed Recall (0 [worst] to 25 [best] story units).
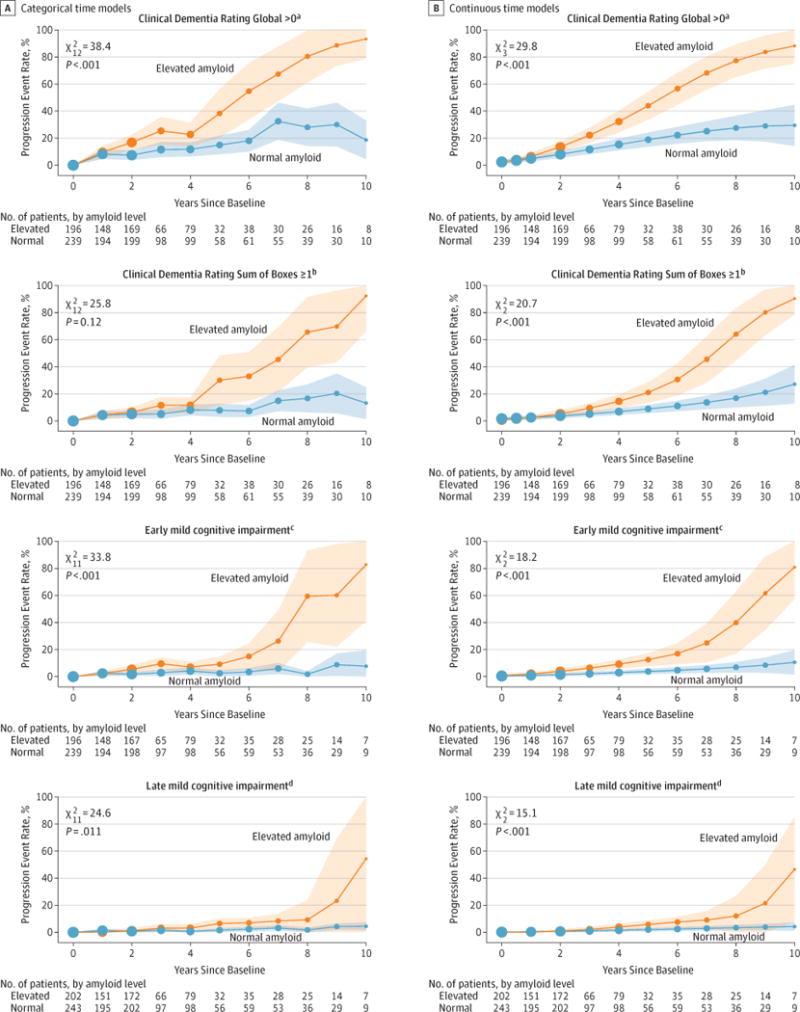
Results: Among the 445 participants (243 with normal amyloid, 202 with elevated amyloid), mean (SD) age was 74.0 (5.9) years, mean education was 16.4 (2.7) years, and 52% were women. The mean score for PACC at baseline was 0.00 (2.60); for MMSE, 29.0 (1.2); for CDR-Sum of Boxes, 0.04 (0.14); and for Logical Memory Delayed Recall, 13.1 (3.3). Compared with the group with normal amyloid, those with elevated amyloid had worse mean scores at 4 years on the PACC (mean difference, 1.51 points [95% CI, 0.94-2.10]; P < .001), MMSE (mean difference, 0.56 points [95% CI, 0.32-0.80]; P < .001), and CDR-Sum of Boxes (mean difference, 0.23 points [95% CI, 0.08-0.38]; P = .002). For Logical Memory Delayed Recall, between-group score was not statistically significant at 4 years (mean difference, 0.73 story units [95% CI, -0.02 to 1.48]; P = .056).
Conclusions and relevance: Exploratory analyses of a cognitively normal cohort followed up for a median of 3.1 years suggest that elevation in baseline brain amyloid level, compared with normal brain amyloid level, was associated with higher likelihood of cognitive decline, although the findings are of uncertain clinical significance. Further research is needed to assess the clinical importance of these differences and measure longer-term associations.
Conflict of interest statement
Figures


Comment in
-
Brain Amyloid Pathology and Cognitive Function: Alzheimer Disease Without Dementia?JAMA. 2017 Jun 13;317(22):2285-2287. doi: 10.1001/jama.2017.6895. JAMA. 2017. PMID: 28609518 No abstract available.
-
Elevated Brain Amyloid in Cognitively Normal Individuals.JAMA. 2017 Oct 10;318(14):1392-1393. doi: 10.1001/jama.2017.12951. JAMA. 2017. PMID: 29049580 No abstract available.
References
-
- Dubois B, Albert ML. Amnestic MCI or prodromal Alzheimer’s disease? Lancet Neurol. 2004;3(4):246–248. - PubMed
-
- Rowe CC, Ellis KA, Rimajova M, et al. Amyloid imaging results from the Australian Imaging, Biomarkers and Lifestyle (AIBL) study of aging. Neurobiol Aging. 2010;31(8):1275–1283. - PubMed
-
- Braak H, Braak E. Frequency of stages of Alzheimer-related lesions in different age categories. Neurobiol Aging. 1997;18(4):351–357. - PubMed
-
- Davies L, Wolska B, Hilbich C, et al. A4 amyloid protein deposition and the diagnosis of Alzheimer’s disease. Neurology. 1988;38(11):1688–1693. - PubMed
Publication types
MeSH terms
Substances
Grants and funding
LinkOut - more resources
Full Text Sources
Other Literature Sources
Medical
