. 2017 Jun 12;31(6):737-754.e6.
doi: 10.1016/j.ccell.2017.05.005.

Intertumoral Heterogeneity within Medulloblastoma Subgroups

Florence M G Cavalli  1 Marc Remke  2 Ladislav Rampasek  3 John Peacock  4 David J H Shih  4 Betty Luu  1 Livia Garzia  1 Jonathon Torchia  5 Carolina Nor  1 A Sorana Morrissy  1 Sameer Agnihotri  6 Yuan Yao Thompson  4 Claudia M Kuzan-Fischer  1 Hamza Farooq  4 Keren Isaev  7 Craig Daniels  1 Byung-Kyu Cho  8 Seung-Ki Kim  8 Kyu-Chang Wang  8 Ji Yeoun Lee  8 Wieslawa A Grajkowska  9 Marta Perek-Polnik  10 Alexandre Vasiljevic  11 Cecile Faure-Conter  12 Anne Jouvet  13 Caterina Giannini  14 Amulya A Nageswara Rao  15 Kay Ka Wai Li  16 Ho-Keung Ng  16 Charles G Eberhart  17 Ian F Pollack  18 Ronald L Hamilton  19 G Yancey Gillespie  20 James M Olson  21 Sarah Leary  22 William A Weiss  23 Boleslaw Lach  24 Lola B Chambless  25 Reid C Thompson  25 Michael K Cooper  26 Rajeev Vibhakar  27 Peter Hauser  28 Marie-Lise C van Veelen  29 Johan M Kros  30 Pim J French  31 Young Shin Ra  32 Toshihiro Kumabe  33 Enrique López-Aguilar  34 Karel Zitterbart  35 Jaroslav Sterba  35 Gaetano Finocchiaro  36 Maura Massimino  37 Erwin G Van Meir  38 Satoru Osuka  38 Tomoko Shofuda  39 Almos Klekner  40 Massimo Zollo  41 Jeffrey R Leonard  42 Joshua B Rubin  43 Nada Jabado  44 Steffen Albrecht  45 Jaume Mora  46 Timothy E Van Meter  47 Shin Jung  48 Andrew S Moore  49 Andrew R Hallahan  49 Jennifer A Chan  50 Daniela P C Tirapelli  51 Carlos G Carlotti  51 Maryam Fouladi  52 José Pimentel  53 Claudia C Faria  54 Ali G Saad  55 Luca Massimi  56 Linda M Liau  57 Helen Wheeler  58 Hideo Nakamura  59 Samer K Elbabaa  60 Mario Perezpeña-Diazconti  61 Fernando Chico Ponce de León  62 Shenandoah Robinson  63 Michal Zapotocky  64 Alvaro Lassaletta  64 Annie Huang  65 Cynthia E Hawkins  66 Uri Tabori  65 Eric Bouffet  65 Ute Bartels  64 Peter B Dirks  67 James T Rutka  68 Gary D Bader  69 Jüri Reimand  7 Anna Goldenberg  70 Vijay Ramaswamy  71 Michael D Taylor  72
Affiliations

Intertumoral Heterogeneity within Medulloblastoma Subgroups

Florence M G Cavalli et al. Cancer Cell. .

Abstract

While molecular subgrouping has revolutionized medulloblastoma classification, the extent of heterogeneity within subgroups is unknown. Similarity network fusion (SNF) applied to genome-wide DNA methylation and gene expression data across 763 primary samples identifies very homogeneous clusters of patients, supporting the presence of medulloblastoma subtypes. After integration of somatic copy-number alterations, and clinical features specific to each cluster, we identify 12 different subtypes of medulloblastoma. Integrative analysis using SNF further delineates group 3 from group 4 medulloblastoma, which is not as readily apparent through analyses of individual data types. Two clear subtypes of infants with Sonic Hedgehog medulloblastoma with disparate outcomes and biology are identified. Medulloblastoma subtypes identified through integrative clustering have important implications for stratification of future clinical trials.

Keywords: copy number; gene expression; integrative clustering; medulloblastoma; methylation; subgroups.


Figures

Figure 1
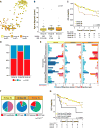
Figure 1. Clear Separation of the Four Medulloblastoma Subgroups through Integrative SNF Clustering
(A) Tumor clusters obtained by spectral clustering (for k = 2 to 8 groups) on the SNF network fused data obtained from both gene expression and DNA methylation data on 763 primary medulloblastomas. Relationships between tumors are indicated by the gray bars between columns. k = 4 (red box), defines the four recognized subgroups. (B) Network representation of the relationships between tumors (k = 4). The shorter the edge between samples (nodes) is the more similar the samples are (only edges with a similarity value above the median value of all patient to patient similarity values are displayed). (C) Heatmap representation of the sample-to-sample fused network data sorted by cluster for k = 4. Sample similarity is represented by red (less similar) to yellow (more similar) coloring inside the heatmap. (D) Venn diagram showing the number of samples intermediate between groups 3 and 4 when using k-means or NMF clustering method on just expression or just methylation datasets of group 3 and 4 tumors (n = 470) between k = 2 and 3. (E) Tumor clusters obtained through spectral clustering on the SNF network fused data of group 3 and 4 samples (n = 470). A small minority of samples (n = 13, 2.8%) that were initially classified as group 3 samples at k = 2, subsequently move to group 4 at k = 3. Only 3/470 (0.64%) samples remain in group 4 after k = 5. These samples are tracked up to k = 8 (orange). See also Figures S1, S3 and Table S1.
Figure 2
Figure 2. Differential Set of Associated Genes and Methylation Probes across the 12 Subtypes
(A and B) Heatmap of the top 1% most associated genes (A) and the top 1% most associated methylation probes (B) for the subtypes inside each subgroup (left side color bar), respectively. Top color bars indicate the subgroup and subtype sample affiliation. Samples are ordered by subtype. (C) Percentage of genes associated for each subgroup; (1) that have methylation probes in their promoter region, (2) for which those methylation probes are in the top 1% associated probes of the respective subgroup, and (3) for which an anti-correlation can be detected between the gene expression and methylation probes levels inside the subgroup. The numbers of genes in each category are indicated. See also Figure S2 and Tables S2 and S3.
Figure 3
Figure 3. Clinical and Genomic Characteristics between Four SHH Medulloblastoma Subtypes
(A) Network representation map of k = 4 SNF-derived subtypes. (B) Age at diagnosis for SHH subtypes at k = 4 (Kruskal-Wallis test). Boxplot center lines show data median; box limits indicate the 25th and 75th percentiles; lower and upper whiskers extend 1.5 times the interquartile range (IQR) from the 25th and 75th percentiles, respectively. Outliers are represented by individual points. (C) Overall survival of SHH subtypes (log rank test). + indicates censored cases. (D) Frequency and significance of broad cytogenetic events across the four SHH subtypes. Darker bars show significant arm-level copy-number event (q ≤ 0.1, chi-square test). * indicates key statistically significant arm gain or deletion. (E) Distribution of TP53 mutations across SHH subtypes (Pearson’s chi-square test). (F) Overall survival stratified by TP53 mutation within SHH α and non-SHH α (log rank test). + indicates censored cases. (G) Incidence of metastatic dissemination at diagnosis across the four SHH subtypes (chi-square test). (H) WHO histological classification at diagnosis across the four SHH subtypes (chi-square test). (I) Overall survival within SHH γ stratified by MBEN histology (log rank test). + indicates censored cases. (J) Distribution of TERT promoter mutations across SHH subtypes (Pearson’s chi-square test). See also Figures S4, S5; Tables S2, S4, and S5.
Figure 4
Figure 4. Clinical and Genomic Characteristics between Two WNT Medulloblastoma Subtypes
(A) Network representation map of k = 2 SNF-derived subtypes. (B) Age at diagnosis for WNT subtypes at k = 2 (Mann-Whitney U test). Boxplot center lines show data median; box limits indicate the 25th and 75th percentiles; lower and upper whiskers extend 1.5 times the interquartile range (IQR) from the 25th and 75th percentiles, respectively. Outliers are represented by individual points. (C) Overall survival comparing WNT α with WNT β (log rank test). + indicates censored cases. (D) Frequency and significance of broad cytogenetic events across the two WNT subtypes. Darker bars show significant arm-level copy-number events (q ≤ 0.1, chi-square test). * indicates key statistically significant arm gain or deletion. See also Figure S6.
Figure 5
Figure 5. Clinical and Genomic Characteristics between Three Group 3 Medulloblastoma Subtypes
(A) Network representation map of k = 3 SNF-derived subtypes. (B) Age at diagnosis of group 3 subtypes at k = 3 (Kruskal-Wallis test). Boxplot center lines show data median; box limits indicate the 25th and 75th percentiles; lower and upper whiskers extend 1.5 times the interquartile range (IQR) from the 25th and 75th percentiles, respectively. Outliers are represented by individual points. (C) Overall survival of group 3 subtypes (log rank test). + indicates censored cases. (D) Incidence of metastatic dissemination at diagnosis for the three group 3 subtypes (chi-square test). (E) Frequency and significance of broad cytogenetic events across the group 3 subtypes. Darker bars show significant arm-level events (q ≤ 0.1, chi-square test). * indicates key statistically significant arm gain or deletion. (F) Distribution of MYC amplifications across group 3 subtypes (Pearson’s chi-square test). (G) Overall survival of group 3 subtypes without MYC amplifications for each subtype compared with MYC-amplified tumors (log rank test). + indicates censored cases. See also Figures S6 and S7; Tables S2 and S4.
Figure 6
Figure 6. Clinical and Genomic Characteristics of the Three Group 4 Medulloblastoma Subtypes
(A) Network representation map of k = 3 SNF-derived subtypes. (B) Age at diagnosis of group 4 subtypes at k = 3 (Kruskal-Wallis test). Boxplot center lines show data median; box limits indicate the 25th and 75th percentiles; lower and upper whiskers extend 1.5 times the interquartile range (IQR) from the 25th and 75th percentiles, respectively. Outliers are represented by individual points. (C) Overall survival of group 4 subtypes (log rank test). + indicates censored cases. (D) Incidence of metastatic dissemination at diagnosis across the three group 4 subtypes (chi-square test). (E) Frequency and significance of broad cytogenetic events across the three group 4 subtypes. * indicates key statistically significant arm gain or deletion. Darker bars show significant arm-level events (q ≤ 0.1, chi-square test). See also Figure S8 and Tables S2, S4.
Figure 7
Figure 7. Subtype-Enriched Pathways
(A–D) Enrichment maps representing biological processes and pathways enriched in subtype-specific upregulated genes for SHH subtypes (A), group 3 subtypes (B), group 4 subtypes (C), and WNT subtypes (D). Each node represents a process or pathway; nodes with many shared genes are grouped and labeled by biological theme. Processes and pathways connected at edges have genes in common. Nodes are colored according to the subtype(s) in which the process is enriched; processes enriched in more than one subtype have multiple colors. Nodes sizes are proportional to the number of genes in each process, in each subgroup. Enriched processes were determined with g:Profiler (FDR-corrected q value < 0.05) and visualized with the Enrichment Map app in Cytoscape. Connected nodes and unconnected but actionable nodes are shown.
Figure 8
Figure 8. Graphical Summary of the 12 Medulloblastoma Subtypes
Schematic representation of key clinical data, copy-number events, and relationship between the subtypes inside each of the four medulloblastoma subgroups. The percentages of patients presenting with metastases and the 5-year survival percentages are presented. The age groups are: infant 0–3 years, child >3–10 years, adolescent >10–17 years, and adult >17 years.

Comment in

Similar articles

  • Second-generation molecular subgrouping of medulloblastoma: an international meta-analysis of Group 3 and Group 4 subtypes.
    Sharma T, Schwalbe EC, Williamson D, Sill M, Hovestadt V, Mynarek M, Rutkowski S, Robinson GW, Gajjar A, Cavalli F, Ramaswamy V, Taylor MD, Lindsey JC, Hill RM, Jäger N, Korshunov A, Hicks D, Bailey S, Kool M, Chavez L, Northcott PA, Pfister SM, Clifford SC. Sharma T, et al. Acta Neuropathol. 2019 Aug;138(2):309-326. doi: 10.1007/s00401-019-02020-0. Epub 2019 May 10. Acta Neuropathol. 2019. PMID: 31076851 Free PMC article.
  • Molecular Subgrouping of Medulloblastoma: Impact Upon Research and Clinical Practice.
    Gupta T, Shirsat N, Jalali R. Gupta T, et al. Curr Pediatr Rev. 2015;11(2):106-19. doi: 10.2174/1573396311666150702104030. Curr Pediatr Rev. 2015. PMID: 26133181 Review.
  • Multi-omics analysis of intertumoral heterogeneity within medulloblastoma uncharted-pathway subtypes.
    Li Z, Wei Y, Shao Y, Tang L, Gong J. Li Z, et al. Brain Tumor Pathol. 2021 Jul;38(3):234-242. doi: 10.1007/s10014-021-00400-7. Epub 2021 Jun 28. Brain Tumor Pathol. 2021. PMID: 34180021
  • The whole-genome landscape of medulloblastoma subtypes.
    Northcott PA, Buchhalter I, Morrissy AS, Hovestadt V, Weischenfeldt J, Ehrenberger T, Gröbner S, Segura-Wang M, Zichner T, Rudneva VA, Warnatz HJ, Sidiropoulos N, Phillips AH, Schumacher S, Kleinheinz K, Waszak SM, Erkek S, Jones DTW, Worst BC, Kool M, Zapatka M, Jäger N, Chavez L, Hutter B, Bieg M, Paramasivam N, Heinold M, Gu Z, Ishaque N, Jäger-Schmidt C, Imbusch CD, Jugold A, Hübschmann D, Risch T, Amstislavskiy V, Gonzalez FGR, Weber UD, Wolf S, Robinson GW, Zhou X, Wu G, Finkelstein D, Liu Y, Cavalli FMG, Luu B, Ramaswamy V, Wu X, Koster J, Ryzhova M, Cho YJ, Pomeroy SL, Herold-Mende C, Schuhmann M, Ebinger M, Liau LM, Mora J, McLendon RE, Jabado N, Kumabe T, Chuah E, Ma Y, Moore RA, Mungall AJ, Mungall KL, Thiessen N, Tse K, Wong T, Jones SJM, Witt O, Milde T, Von Deimling A, Capper D, Korshunov A, Yaspo ML, Kriwacki R, Gajjar A, Zhang J, Beroukhim R, Fraenkel E, Korbel JO, Brors B, Schlesner M, Eils R, Marra MA, Pfister SM, Taylor MD, Lichter P. Northcott PA, et al. Nature. 2017 Jul 19;547(7663):311-317. doi: 10.1038/nature22973. Nature. 2017. PMID: 28726821 Free PMC article.
  • Medulloblastoma: Molecular Classification-Based Personal Therapeutics.
    Archer TC, Mahoney EL, Pomeroy SL. Archer TC, et al. Neurotherapeutics. 2017 Apr;14(2):265-273. doi: 10.1007/s13311-017-0526-y. Neurotherapeutics. 2017. PMID: 28386677 Free PMC article. Review.

Cited by

References

    1. Aryee MJ, Jaffe AE, Corrada-Bravo H, Ladd-Acosta C, Feinberg AP, Hansen KD, Irizarry RA. Minfi: a flexible and comprehensive Bioconductor package for the analysis of Infinium DNA Methylation microarrays. Bioinformatics. 2014;30:1363–1369. - PMC - PubMed
    1. Brat DJ, Verhaak RG, Aldape KD, Yung WK, Salama SR, Cooper LA, Rheinbay E, Miller CR, Vitucci M, Morozova O, et al. Comprehensive, integrative genomic analysis of diffuse lower-grade gliomas. N Engl J Med. 2015;372:2481–2498. - PMC - PubMed
    1. Cho YJ, Tsherniak A, Tamayo P, Santagata S, Ligon A, Greulich H, Berhoukim R, Amani V, Goumnerova L, Eberhart CG, et al. Integrative genomic analysis of medulloblastoma identifies a molecular subgroup that drives poor clinical outcome. J Clin Oncol. 2011;29:1424–1430. - PMC - PubMed
    1. Collisson EA, Campbell JD, Brooks AN, Berger AH, Lee W, Chmielecki J, Beer DG, Cope L, Creighton CJ, Danilova L, et al. Comprehensive molecular profiling of lung adenocarcinoma. Nature. 2014;511:543–550. - PMC - PubMed
    1. Dai M, Wang P, Boyd AD, Kostov G, Athey B, Jones EG, Bunney WE, Myers RM, Speed TP, Akil H, et al. Evolving gene/transcript definitions significantly alter the interpretation of genechip data. Nucleic Acids Res. 2005;33:e175. - PMC - PubMed

Publication types