. 2017 Jun 12;31(6):804-819.e7.
doi: 10.1016/j.ccell.2017.05.007.

A Systems Biology Approach Identifies FUT8 as a Driver of Melanoma Metastasis

Affiliations

A Systems Biology Approach Identifies FUT8 as a Driver of Melanoma Metastasis

Praveen Agrawal et al. Cancer Cell. .

Abstract

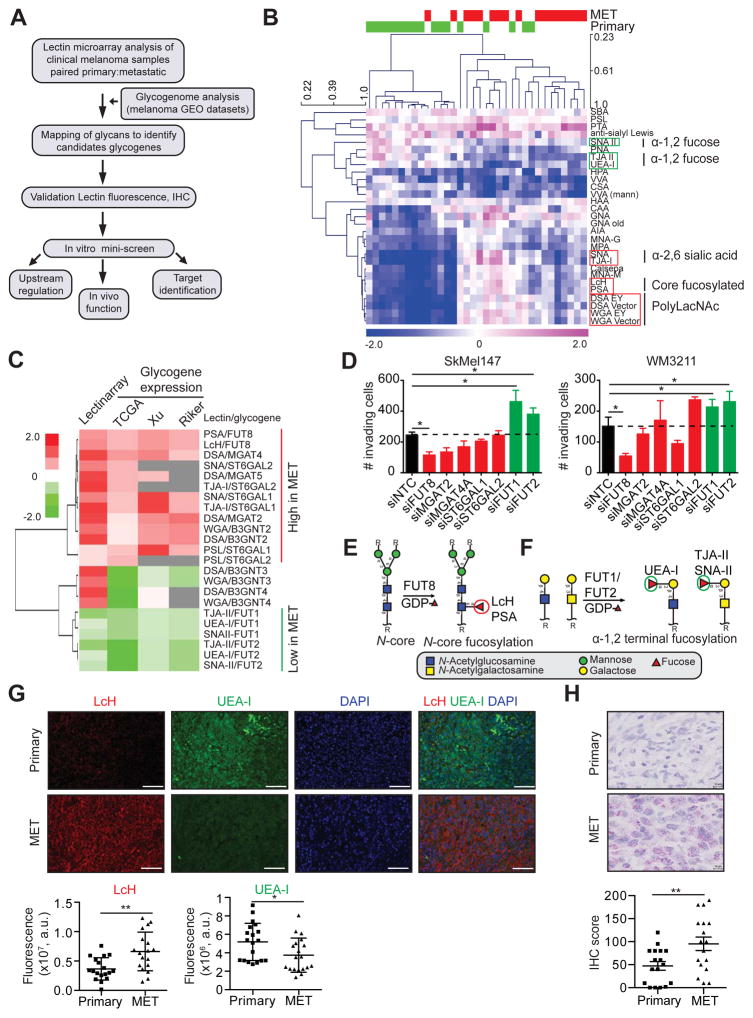
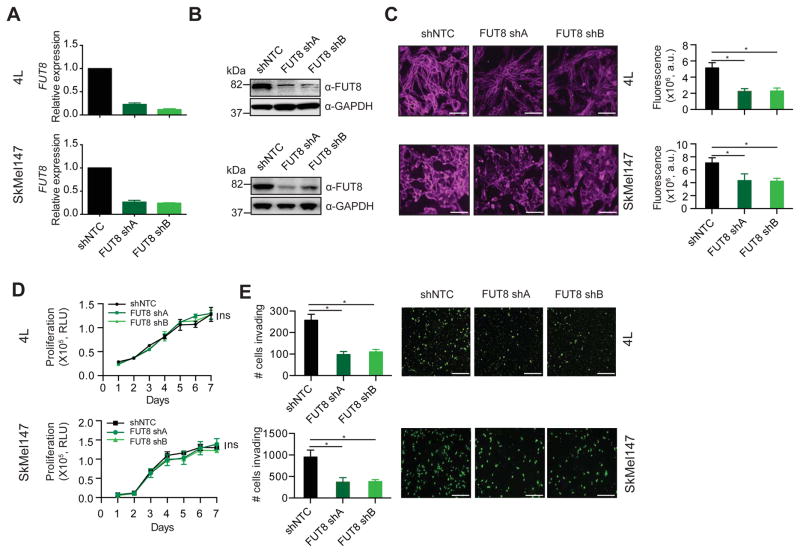
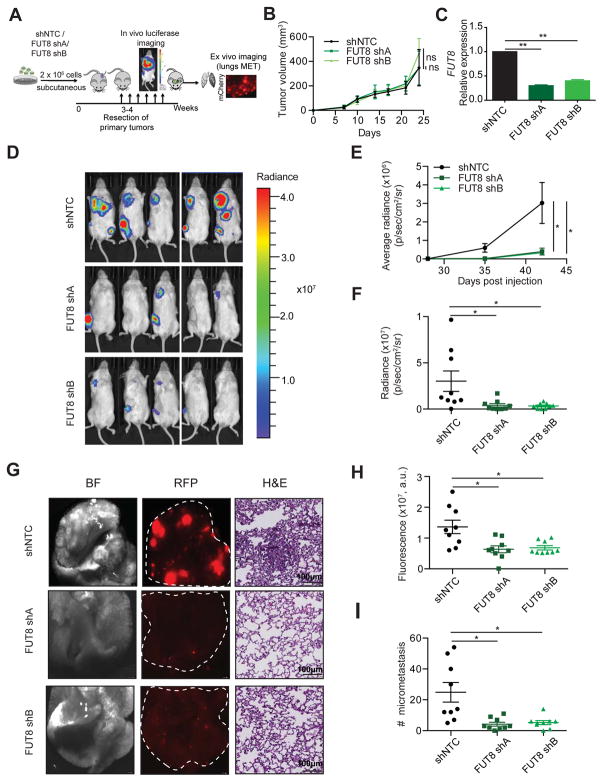
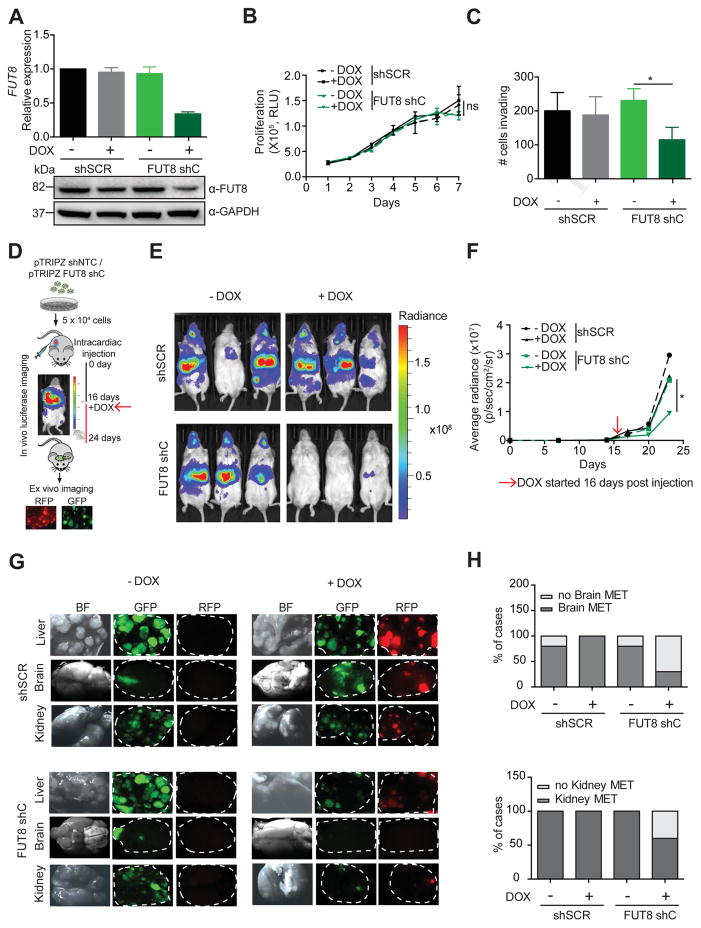
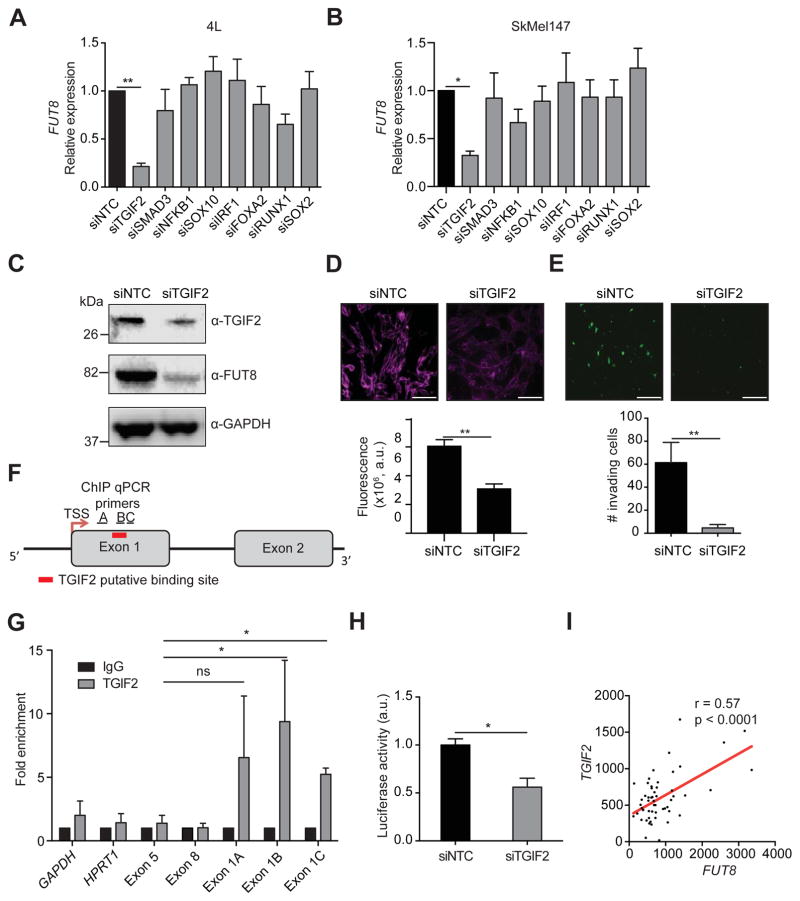
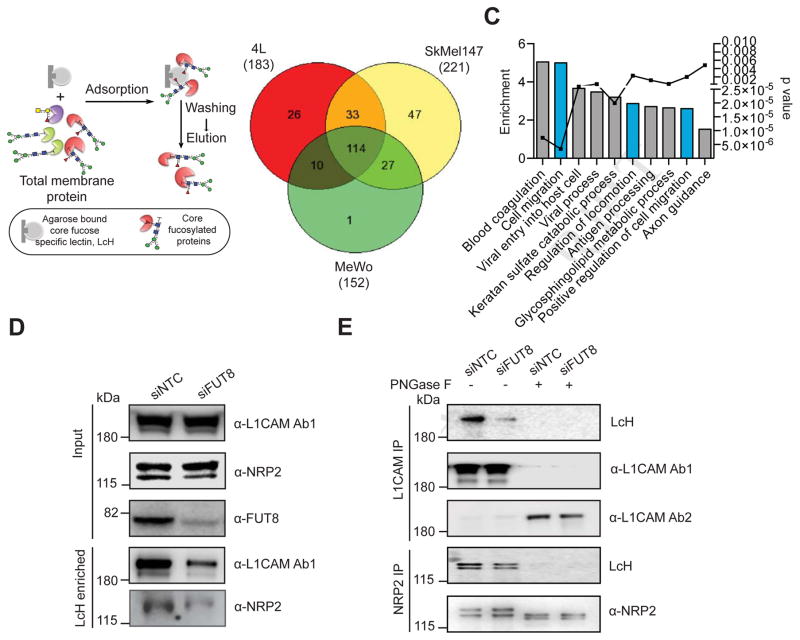
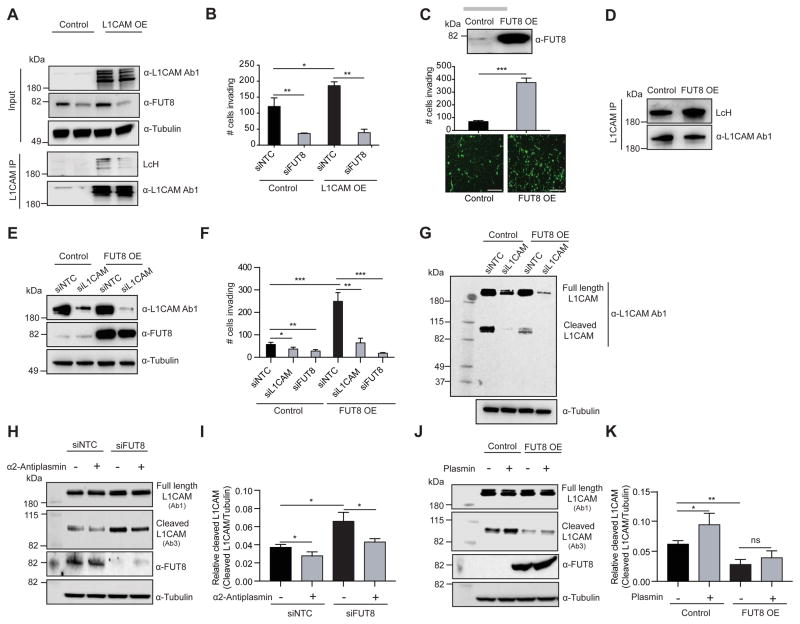
Association of aberrant glycosylation with melanoma progression is based mainly on analyses of cell lines. Here we present a systems-based study of glycomic changes and corresponding enzymes associated with melanoma metastasis in patient samples. Upregulation of core fucosylation (FUT8) and downregulation of α-1,2 fucosylation (FUT1, FUT2) were identified as features of metastatic melanoma. Using both in vitro and in vivo studies, we demonstrate FUT8 is a driver of melanoma metastasis which, when silenced, suppresses invasion and tumor dissemination. Glycoprotein targets of FUT8 were enriched in cell migration proteins including the adhesion molecule L1CAM. Core fucosylation impacted L1CAM cleavage and the ability of L1CAM to support melanoma invasion. FUT8 and its targets represent therapeutic targets in melanoma metastasis.

Keywords: FUT8; L1CAM; core fucosylation; glycomics; glycosylation; lectin array; lectin microarray; metastasis; metastatic melanoma; primary melanoma.


Figures

Figure 1
Figure 1. Systematic dissection of the melanoma glycome and associated glycogenes in clinical samples reveals altered protein fucosylation linked to metastatic behavior
(A) Schematic illustration of our systems biology approach to identify glycosylation enzymes involved in melanoma metastasis and their corresponding targets. (B) Heat map of lectin clustering of patient-matched primary and metastatic (MET) melanoma FFPE tissues (n=17 pairs) by ratiometric lectin microarray, p<0.05. Pink, log2(S/R) > log2(Smedian/Rmedian); blue, log2(Smedian/Rmedian) > log2(S/R). (C) Correlation of lectin data with glycogene expression. Fold change in selected lectin binding in melanoma metastasis vs. primary tissues using lectin microarray is shown. Fold change in expression of corresponding glycogenes is also shown, p<0.05. (D) Trans-well invasion assay on SkMel147 and WM3211 cells transfected with non-targeting control (NTC) or smart pool siRNAs (50 nM) against selected glycogenes (mean ± SD of 3 replicates), p<0.05. (E) N-linked α-1,6 core fucosylated glycan structure generated by FUT8 and recognized by LcH and PSA lectins. (F) α-1,2 terminal fucosylated glycan structure generated by FUT1 and FUT2 and recognized by UEA-I, TJA-II and SNA-II lectins. (G) Representative images of LcH and UEA-I lectin multiplex fluorescence microscopy of primary and metastatic melanomas (n=18 for LcH, n=19 for UEA-I). Biotinylated LcH- DY-647-Streptavidin (red), FITC-UEA-I (green) and DAPI stained sections, scale bar, 100 μm. Dot plots represent the average fluorescence intensity of 5 fields per image for each lectin. (H) Representative images of IHC staining with α-FUT8 antibody in 17 paired primary and metastatic melanoma show peri-nuclear staining pattern (FastRed counterstaining). IHC score was calculated combining the signal intensity and percentage of positive cells within the section. Dot plot shows distribution of FUT8 IHC score in primary and metastatic melanoma, scale bar, 10 μm. Two-tailed paired (B and H), and unpaired (C, D and G) t test. *p=0.01 to 0.05, **p=0.001 to 0.01. See also Figure S1.
Figure 2
Figure 2. FUT8 silencing reduces melanoma cells invasiveness in vitro
(A–B) FUT8 levels in 4L and SkMel147 cells stably expressing shRNA targeting FUT8 (FUT8 shA or FUT8 shB) or shNTC were assessed by real-time qPCR (A) and Western blotting (B). QPCR graph shows average relative expression normalized to GAPDH, 3 replicates per condition. QPCR data and Western blot images are representative of three independent experiments. (C) LcH fluorescence microscopy of 4L and SkMel147 cells transduced with FUT8 shA or FUT8 shB or shNTC. Right panel shows quantitation of fluorescent intensity of representative images. Data from 5 random areas of 2 biological replicates were averaged to generate graphs, scale bar, 100 μm. (D) Cell proliferation assay of 4L and SkMel147 cells transduced with FUT8 shA or FUT8 shB or shNTC and analyzed by Cell Titer Glo, 3 replicates per condition. Data shown is representative of two independent experiments. (E) Trans-well matrigel invasion by 4L and SkMel147 cells transduced with FUT8 shA or FUT8 shB or shNTC. Invading cells were quantified by counting the number of 4L and SkMel147 cells that invaded into the basal side of matrigel-coated trans-well inserts after 36 hr and 12 hr respectively, n=5 fields per replicate; 3 replicates per condition, data shown is representative of three independent experiments. Scale bar, 100 μm. *p=0.01 to 0.05. Data are presented as mean ± SD. Two-tailed unpaired t test. See also Figure S2.
Figure 3
Figure 3. FUT8 silencing decreases in vivo melanoma metastasis
(A) Schematic representation of the in vivo xenograft experiment. (B) Primary tumor growth of 4L cells transduced with FUT8 shA, FUT8 shB or shNTC following subcutaneous injection into NSG mice (n=9 mice per condition; ns: not significant). Data is presented as mean ± SD. (C) Real-time qPCR of FUT8 expression in flank tumors resected at day 25 post-injection. Data shown is representative of flank tumors from 2 mice, mean ± SD. (D) Representative images of whole-body in vivo BLI of mice injected with 4L cells transduced with FUT8 shA, FUT8 shB or shNTC at day 42 post-injection (17 days post-resection of lateral tumors). (E) Average radiance as measured by in vivo BLI at 27, 35 and 42 days post-injection of flank tumors (n=9 mice per condition). (F) Quantitation of BLI at day 42 (n=9). (G) Ex vivo brightfield (BF) and fluorescent (RFP) microscopic images of mouse lungs at termination of the experiment and corresponding H&E-stained sections, scale bar, 100 μm. White dotted ovals mark whole organ. (H) Average fluorescent intensity of macrometastases per lung. Fluorescence intensity of whole lung was measured (n=9/group). (I) Dot plots show the distribution of the number of metastases per section of lung (2 sections per lung). Two-tailed unpaired t test. *p=0.01 to 0.05 and **p=0.001 to 0.01. See also Figure S3.
Figure 4
Figure 4. FUT8 silencing impairs the growth of established metastasis in vivo
(A) Real-time qPCR and Western blot of FUT8 levels in 4L melanoma cells stably transduced with DOX inducible pTRIPZ-shSCR or pTRIPZ-FUT8 shC. QPCR graph shows average relative expression normalized to GAPDH, 3 replicates per condition. Data shown is representative of three independent experiments. (B) Cell proliferation assay of FUT8 shC or shSCR-transduced 4L cells in the presence (1 μg/ml) or absence of DOX. Cell growth was analyzed by Cell Titer Glo, 3 replicates per condition. Data shown is representative of two independent experiments. (C) Number of FUT8 shC or shSCR-transduced 4L cells that invaded into the basal side of matrigel-coated trans-well inserts after 36 hr. n=5 fields per replicate; 3 replicates per condition. Data shown is representative of three independent experiments. (D) Schematic representation of the in vivo metastasis assay with 4L melanoma cells stably transduced with DOX inducible pTRIPZ-shSCR or pTRIPZ-FUT8 shC instilled by intracardiac injection into NSG mice (n=4 mice per group in –DOX and + DOX shSCR, n=9 mice per group in –DOX and + DOX FUT8 shC). (E) Representative images of whole-body in vivo imaging 12 days post DOX treatment. (F) Average radiance after intracardiac injection of 4L cells followed over time. DOX treatment was started 16 days post injection. (G) Ex vivo fluorescent microscopic images of mouse liver, kidney and brain metastases at termination of the experiment. White dotted ovals mark organs. (H) Histogram shows the percentage of mice that developed brain or kidney metastases in each group of mice. Data are presented as mean ± SD in A, B and C. Two-tailed unpaired t test. *p=0.01 to 0.05, ns: not significant.
Figure 5
Figure 5. TGIF2 regulates FUT8 transcription
Real-time qPCR of FUT8 mRNA levels after silencing of candidate transcription factors in 4L (A) and SkMel147 (B) cell lines. QPCR graph shows average relative expression normalized to GAPDH, 3 replicates per condition. Data shown is representative of two independent experiments. (C) Silencing of TGIF2 decreases FUT8, as shown by Western blot. (D) LcH fluorescence microscopy of 4L cells transfected with NTC or TGIF2 siRNA (50 nM). Lower panel shows quantitation of fluorescent intensity of representative images. Data from 5 random images of 2 biological replicates were averaged to generate graphs, scale bar, 100 μm. (E) Trans-well matrigel invasion assay on 4L cells transfected with NTC or TGIF2 siRNA, scale bar, 100 μm. n=5 fields per replicate; 3 replicates per condition. Data shown is representative of three independent experiments. (F) Schematic of the FUT8 promoter indicating the MatInspector-predicted binding site of TGIF2, the regions flanked by ChIP qPCR primers (Exon 1A, 1B and 1C) and the transcription start site. (G) TGIF2 ChIP qPCR of the FUT8 promoter at the indicated A, B and C regions in 4L cells. IgG, immunoglobulin. GAPDH, HPRT1, FUT8 exon 5 and FUT8 exon 8 served as negative controls for ChIP qPCR (mean ± SD of 3 replicates). (H) Promoter luciferase reporter assay to show pLS-FUT8 activity. Activity of the human FUT8 promoter was examined by co-transfection of the luciferase reporter construct pLS-FUT8 (100 ng) containing a 1000 bp long region of the human FUT8 promoter with NTC or TGIF2 siRNA (50 nM) in HEK293T cells. Relative luciferase activities were measured 24 hr after transfection (mean ± SD of 3 replicates). (I) Scatter plot shows positive co-relation of TGIF2 and FUT8 mRNA levels in a melanoma dataset, r= 0.57, p<0.0001 (Riker et al., 2008). Data are presented as mean ± SD in A, B, D and E. Two-tailed unpaired t test, *p=0.01 to 0.05 and **p=0.001 to 0.01. See also Figure S4.
Figure 6
Figure 6. Identification of core fucosylated glycoproteins in melanoma reveals regulators of invasion and metastasis
(A) Schematic illustration of the experimental approach showing affinity enrichment of core fucosylated proteins by LcH lectin affinity chromatography. (B) Number of proteins identified by mass spectrometry analysis of the LcH enriched fractions of 4L, SkMel147 and MeWo membrane proteins. (C) GO enrichment analysis (category of biological processes) of common core-fucosylated proteins in three cell lines. Also see Table S2. (D) LcH affinity chromatography of whole cell lysate of 4L cells transfected with NTC or FUT8 siRNA followed by Western blot with α-L1CAM or α-NRP2 antibody. Input shows no effect of FUT8 knockdown on L1CAM or NRP2 expression. (E) L1CAM and NRP2 immunoprecipitation from whole cell lysates of 4L cells transfected with NTC or FUT8 siRNA. Anti-L1CAM or anti NRP2 immunoprecipitates were treated with or without PNGase F and blotted with biotinylated LcH or α-L1CAM Ab1 (also referred as α-L1CAM) or α-L1CAM Ab2 or α-NRP2. L1CAM Ab1 preferentially recognizes glycosylated L1CAM while Ab2 preferentially recognizes non-glycosylated L1CAM. Experiments in D and E were performed in triplicates and representative images are shown. See also Figure S5.
Figure 7
Figure 7. L1CAM is a mediator of the pro-invasive effects of FUT8
(A) Western blot of L1CAM or FUT8 in WM3248 cells stably overexpressing L1CAM or control vector and transfected with NTC or FUT8 siRNA. L1CAM IP on WM3248 cells lysates stably overexpressing L1CAM or control vector and transfected with NTC or FUT8 siRNA. Anti-L1CAM immunoprecipitates were blotted with biotinylated LcH or α-L1CAM Ab1. (B) Trans-well matrigel invasion assay on WM3248 melanoma cells stably overexpressing L1CAM or control vector and transfected with NTC or FUT8 siRNA. n=5 fields per replicate; 5 replicates per condition. Data shown is representative of three independent experiments. (C) Trans-well matrigel invasion by MeWo melanoma cells stably overexpressing FUT8 or control vector, scale bar, 100 μm. Western blot of FUT8 is also shown. n=5 fields per replicate; 5 replicates per condition. Data shown is representative of three independent experiments. (D) L1CAM IP on whole cell lysates of MeWo cells stably overexpressing FUT8 or control vector. Anti-L1CAM immunoprecipitates blotted with biotinylated LcH or α-L1CAM Ab1. (E) Western blot of FUT8 and L1CAM in MeWo cells stably overexpressing FUT8 or control vector and transfected with NTC or L1CAM siRNA. (F) Trans-well matrigel invasion by MeWo melanoma cells stably overexpressing FUT8 or control vector and transfected with NTC, L1CAM or FUT8 siRNA. n=5 fields per replicate; 5 replicates per condition. Data shown is representative of three independent experiments. (G) Western blot of L1CAM in MeWo cell line overexpressing FUT8 or control vector, and transfected with NTC or L1CAM siRNA. Samples were blotted with α-L1CAM Ab1. (H) Western blot of cleaved and full length L1CAM on SkMel147 cells transfected with NTC or FUT8 siRNA and treated with α2-antiplasmin. Cells were transfected with siRNAs for 48 hr then incubated with α2-antiplasmin (5 μg/ml) for 16 hr. L1CAM Ab3 preferentially recognizes cleaved L1CAM fragment while L1CAM Ab1 preferentially recognizes full length L1CAM. (I) Quantitation of cleaved L1CAM (~85 kDa) using ImageStudioLite software. Tubulin was used for normalization of loading (mean ± SD of 3 replicates). (J) Western blot of cleaved and full length L1CAM on lysates from MeWo cells stably overexpressing FUT8 or control vector and treated with plasmin. Cells were cultured for 24 hr then incubated with plasmin (3 μg/ml) for 24 hr. (K) Quantitation of cleaved L1CAM. Tubulin was used for normalization of loading (mean ± SD of 3 replicates). All experiments were performed in triplicates and representative images are shown. Data are presented as mean ± SD. Two-tailed unpaired t test. *p=0.01 to 0.05, **p=0.001 to 0.01 and *** p=0.0001 to 0.001, ns: not significant. See also Figure S6.

Comment in

References

    1. Abbott KL, Nairn AV, Hall EM, Horton MB, McDonald JF, Moremen KW, Dinulescu DM, Pierce M. Focused glycomic analysis of the N-linked glycan biosynthetic pathway in ovarian cancer. Proteomics. 2008;8:3210–3220. - PMC - PubMed
    1. Agrawal P, Kurcon T, Pilobello KT, Rakus JF, Koppolu S, Liu Z, Batista BS, Eng WS, Hsu KL, Liang Y, Mahal LK. Mapping posttranscriptional regulation of the human glycome uncovers microRNA defining the glycocode. Proc Natl Acad Sci U S A. 2014;111:4338–4343. - PMC - PubMed
    1. Agre P, Bertozzi C, Bissell M, Campbell KP, Cummings RD, Desai UR, Estes M, Flotte T, Fogleman G, Gage F, et al. Training the next generation of biomedical investigators in glycosciences. The Journal of clinical investigation. 2016;126:405–408. - PMC - PubMed
    1. Altevogt P, Doberstein K, Fogel M. L1CAM in human cancer. International journal of cancer. 2016;138:1565–1576. - PubMed
    1. Batista BS, Eng WS, Pilobello KT, Hendricks-Munoz K, Mahal LK. Identification of a Conserved Glycan Signature for Microvesicles. J Proteome Res. 2011;10:4624–4633. - PMC - PubMed

Publication types

Substances