. 2017 Jun 13;18(1):461.
doi: 10.1186/s12864-017-3834-z.

Relatively frequent switching of transcription start sites during cerebellar development

Affiliations

Relatively frequent switching of transcription start sites during cerebellar development

Peter Zhang et al. BMC Genomics. .

Erratum in

Abstract

Background: Alternative transcription start site (TSS) usage plays important roles in transcriptional control of mammalian gene expression. The growing interest in alternative TSSs and their role in genome diversification spawned many single-gene studies on differential usages of tissue-specific or temporal-specific alternative TSSs. However, exploration of the switching usage of alternative TSS usage on a genomic level, especially in the central nervous system, is largely lacking.

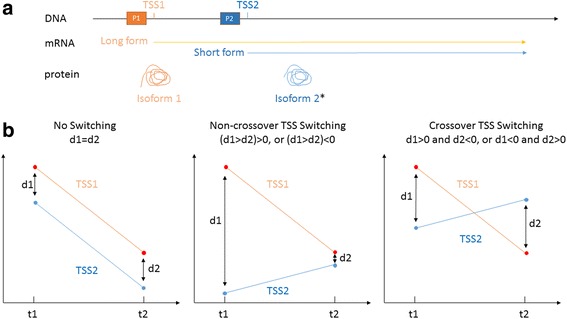
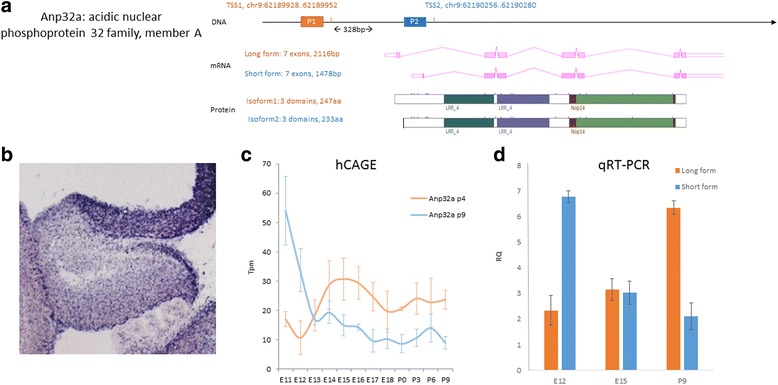
Results: In this study, We have prepared a unique set of time-course data for the developing cerebellum, as part of the FANTOM5 consortium ( http://fantom.gsc.riken.jp/5/ ) that uses their innovative capturing of 5' ends of all transcripts followed by Helicos next generation sequencing. We analyzed the usage of all transcription start sites (TSSs) at each time point during cerebellar development that provided information on multiple RNA isoforms that emerged from the same gene. We developed a mathematical method that systematically compares the expression of different TSSs of a gene to identify temporal crossover and non-crossover switching events. We identified 48,489 novel TSS switching events in 5433 genes during cerebellar development. This includes 9767 crossover TSS switching events in 1511 genes, where the dominant TSS shifts over time.

Conclusions: We observed a relatively high prevalence of TSS switching in cerebellar development where the resulting temporally-specific gene transcripts and protein products can play important regulatory and functional roles.

Keywords: Alternative promoters; Alternative splicing; Cerebellum; Developmental biology; HeliScopeCAGE; Promoter; Promoter switching; Transcription start site.


Figures

Fig. 1
Fig. 1
A schematic diagram of alternative transcription start sites (TSSs) and the classes of TSS switching. a Alternative TSSs can generate different splicing variants that can be translated into different protein isoforms. *the functional domains may be affected by alternative TSSs which results in functional diversity. b Different outcomes comparing alternative TSS usage at two time points – no TSS switching, non-crossover TSS switching or crossover TSS switching. Y-axis represents the quantitative measure of TSS usage measured by the expression level of its mRNA transcript. X-axis represents the two developmental time points used in the comparison (t1 vs. t2)
Fig. 2
Fig. 2
Overview of TSS switching events during cerebellar development. a Overview of 48,489 TSS switching events during cerebellar development. These events significantly deviate from the no-switching line (indicated by d1 = d2) (p < 0.05). b Overview of 38,722 non-crossover TSS switching events during cerebellar development. c Overview of 9767 crossover TSS switching events during cerebellar development. X-axis represents d1, which is the difference in expression between the two TSSs, measured in tags per million (tpm), at developmental time point 1 (t1), see Fig. 1b for a graphic illustration. Y-axis represents d2, which is the difference in expression between the two TSSs, measured in tag per million (tpm) at developmental time point 2 (t2), see Fig. 1b for a graphic illustration
Fig. 3
Fig. 3
Distribution TSS switching events in different genes during cerebellar development. a Distribution 48,489 TSS switching events in genes during cerebellar development. Arrow points to the two genes with more than 800 switching events. b Overview of 38,722 non-crossover TSS switching events in 5293 genes during cerebellar development. c Overview of 9767 crossover TSS switching events in 1511 genes during cerebellar development. x-axis – number of TSS events occurs within one gene (log2 scaled). y-axis – number of genes that have the number of TSS events indicated on the x-axis
Fig. 4
Fig. 4
GO Analysis for genes significant (p < 0.05) for crossover switching at all time points (left) and at three selected time points (right). a Top 20 terms from GO analysis of all 9767 crossover TSS switching events in 1509 genes For column heading: “Term” is the GO term, “Count” is the number of genes associated with the GO term and “%” is the fraction of the number of genes associated with the GO term divided by the total input of 1509 genes, “PValue” and “Bonferroni” represent the significance of the GO term. b A Venn diagram comparing the top 20 GO terms from crossover TSS switching events between all samples and either E13, E15 or P0 samples
Fig. 5
Fig. 5
Alternative TSSs in glypican 6 (Gpc6) and experimental validation of its non-crossover switching events with Real-time PCR. a Schematic DNA structure of Gpc6, alternative mRNA variants and un-altered protein structure. b in situ expression of Gpc6 in mouse cerebellum at E14.5 (from GenePaint). c HeliscopeCAGE expression data for the two alternative TSSs during cerebellar development. X-axis: time, from embryonic day 11 (E11) to postnatal day 9 (P9). Y-axis: expression level measured in tpm (tags per million). d qRT-PCR expression data demonstrating a non-crossover TSS switching event between E15 and P9. X-axis: time at E12, E15 and P9. Y-axis: expression level measured in RQ (relative quantity against H2O as negative control)
Fig. 6
Fig. 6
Alternative TSSs in Acidic nuclear phosphoprotein 32 family, member A (Anp32a) and experimental validation of its crossover switching events with Real-time PCR. a Schematic DNA structure of Anp32a, alternative mRNA variants and altered protein structure at the N-terminus. b in situ expression of Anp32a in mouse cerebellum at E14.5 (from GenePaint). c HeliscopeCAGE expression data for the two alternative TSSs during cerebellar development. X-axis: time, from embryonic day 11 (E11) to postnatal day 9 (P9). Y-axis: expression level measured in tpm (tags per million). d qRT-PCR expression data demonstrating a crossover TSS switching events between E12 and P9. X-axis: time at E12, E15 and P9 Y-axis: expression level measured in RQ (relative quantity against H2O as negative control)
Fig. 7
Fig. 7
Alternative TSSs in contactin associated protein-like 2 (Cntnap2) and experimental validation of its crossover switching events with Real-time PCR. a Schematic DNA structure of Cntnap2, alternative mRNA variants and truncated protein structure of the short isoform. b in situ expression of Cntnap2 in mouse cerebellum at E14.5 (from GenePaint). c HeliscopeCAGE expression data for the two alternative TSSs during cerebellar development. X-axis: time, from embryonic day 11 (E11) to postnatal day 9 (P9). Y-axis: expression level measured in tpm (tags per million). d qRT-PCR expression data demonstrating a crossover TSS switching events between E12 (as well as E15) and P9. X-axis: time at E12, E15 and P9. Y-axis: expression level measured in RQ (relative quantity against H2O as negative control)

References

    1. Schmutz J, et al. Quality assessment of the human genome sequence. Nature. 2004;429(6990):365–368. doi: 10.1038/nature02390. - DOI - PubMed
    1. Davuluri RV, et al. The functional consequences of alternative promoter use in mammalian genomes. Trends Genet. 2008;24(4):167–177. doi: 10.1016/j.tig.2008.01.008. - DOI - PubMed
    1. Consortium EP. An integrated encyclopedia of DNA elements in the human genome. Nature. 2012;489(7414):57–74. doi: 10.1038/nature11247. - DOI - PMC - PubMed
    1. Shiraki T, et al. Cap analysis gene expression for high-throughput analysis of transcriptional starting point and identification of promoter usage. Proc Natl Acad Sci. 2003;100(26):15776–15781. doi: 10.1073/pnas.2136655100. - DOI - PMC - PubMed
    1. Consortium TF. A promoter-level mammalian expression atlas. Nature. 2014;507(7493):462–470. doi: 10.1038/nature13182. - DOI - PMC - PubMed

Publication types