. 2017 Nov;14(11):1657-1664.
doi: 10.1016/j.hrthm.2017.06.012. Epub 2017 Jun 10.

Atrial-ventricular differences in rabbit cardiac voltage-gated Na+ currents: Basis for atrial-selective block by ranolazine

Affiliations

Atrial-ventricular differences in rabbit cardiac voltage-gated Na+ currents: Basis for atrial-selective block by ranolazine

Rachel E Caves et al. Heart Rhythm. 2017 Nov.

Abstract

Background: Class 1 antiarrhythmic drugs are highly effective in restoring and maintaining sinus rhythm in atrial fibrillation patients but carry a risk of ventricular tachyarrhythmia. The antianginal agent ranolazine is a prototypic atrial-selective voltage-gated Na+ channel blocker but the mechanisms underlying its atrial-selective action remain unclear.

Objective: The present study examined the mechanisms underlying the atrial-selective action of ranolazine.

Methods: Whole-cell voltage-gated Na+ currents (INa) were recorded at room temperature (∼22°C) from rabbit isolated left atrial and right ventricular myocytes.

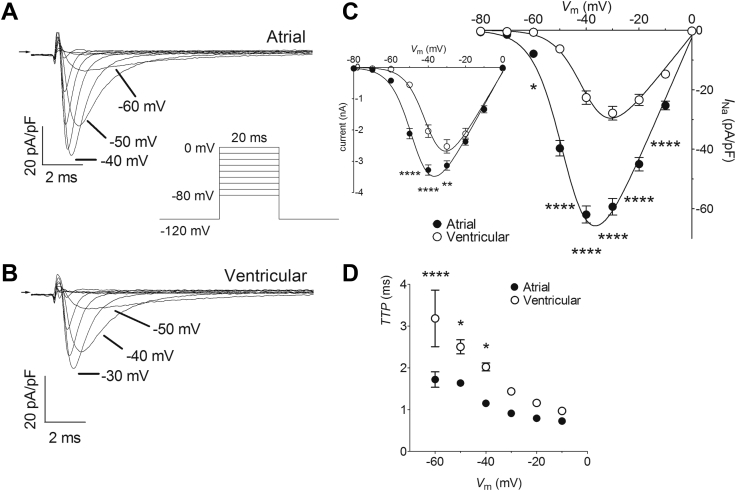
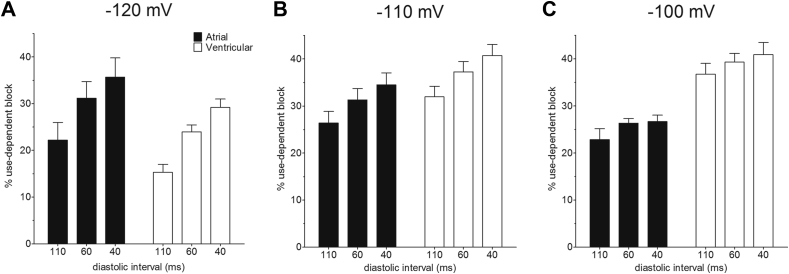
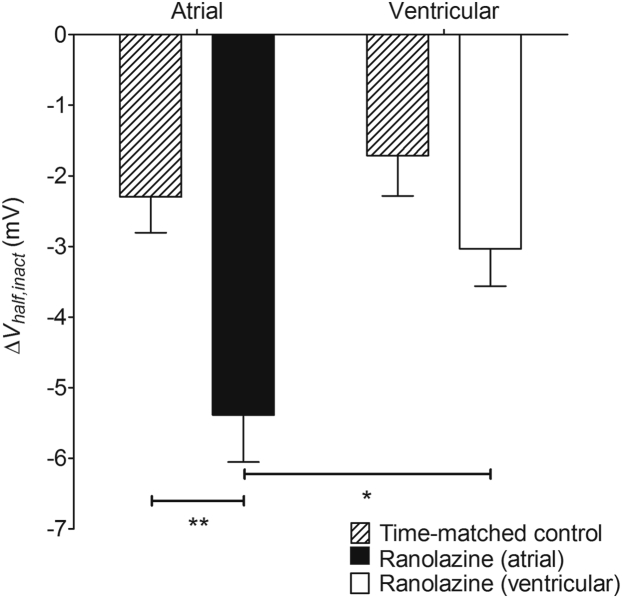
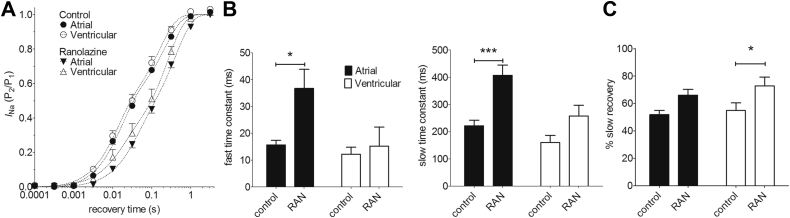
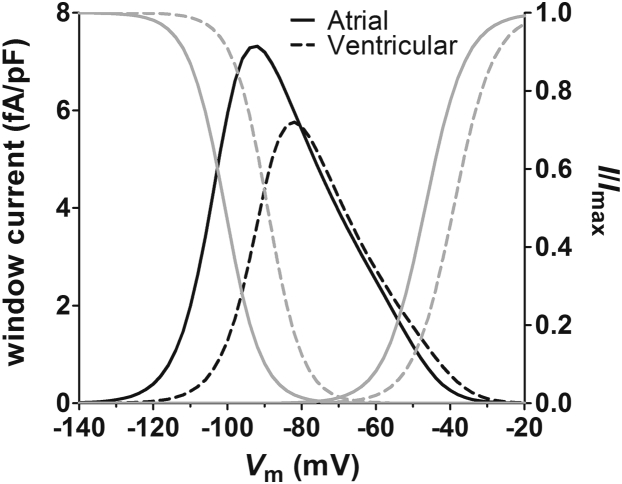
Results: INa conductance density was ∼1.8-fold greater in atrial than in ventricular cells. Atrial INa was activated at command potentials ∼7 mV more negative and inactivated at conditioning potentials ∼11 mV more negative than ventricular INa. The onset of inactivation of INa was faster in atrial cells than in ventricular myocytes. Ranolazine (30 μM) inhibited INa in atrial and ventricular myocytes in a use-dependent manner consistent with preferential activated/inactivated state block. Ranolazine caused a significantly greater negative shift in voltage of half-maximal inactivation in atrial cells than in ventricular cells, the recovery from inactivation of INa was slowed by ranolazine to a greater extent in atrial myocytes than in ventricular cells, and ranolazine produced an instantaneous block that showed marked voltage dependence in atrial cells.

Conclusion: Differences exist between rabbit atrial and ventricular myocytes in the biophysical properties of INa. The more negative voltage dependence of INa activation and inactivation, together with trapping of the drug in the inactivated channel, underlies an atrial-selective action of ranolazine.

Keywords: Antiarrhythmic drug; Atrial myocytes; Cardiac regional heterogeneity; Na(+) channel blocker; Ventricular myocytes.


Figures

Figure 1
Figure 1
Atrial-ventricular differences in fast-Na+ current (INa) density–voltage relations. A: Representative current traces recorded from an atrial myocyte on depolarization to a range of voltages. Arrow indicates zero current level. Insert shows voltage pulse protocol. B: Representative current traces recorded from a ventricular myocyte on depolarization to a range of voltages. Arrow indicates zero current level. Voltage pulse protocol as for A. C: Mean INa density–voltage relations for atrial (filled circles, n = 17) and ventricular (open circles, n = 17) myocytes. Solid lines represent fits to Supplemental Equation 1. Data were significantly different by both cell type (P < .0001) and voltage (P < .0001), with significant interaction (P < .0001; 2-way repeated measures analysis of variance [RM ANOVA]). *P < .05; ****P < .0001 vs ventricular; Bonferroni post hoc test. Inset shows the corresponding mean INa density–voltage relations without normalization to whole-cell capacitance. Data were significantly different by both cell type (P = .0002) and voltage (P < .0001), with significant interaction (P < .0001; 2-way RM ANOVA). **P < .01; ****P < .0001 vs ventricular; Bonferroni post hoc test. D: Voltage dependence of time-to-peak INa (TTP) for atrial (filled circles, n = 17) and ventricular (open circles, n = 17) myocytes. Data were significantly different by both cell type (P < .0001) and voltage (P < .0001), with significant interaction (P = .0355; 2-way RM ANOVA). *P < .05; ****P < .0001 vs ventricular; Bonferroni post hoc test. The membrane time constants were 0.168 ± 0.009 ms for atrial myocytes (n = 17) and 0.327 ± 0.026 ms for ventricular cells (n = 17; P < .0001, unpaired Student t test).
Figure 2
Figure 2
Atrial-ventricular differences in steady-state voltage-dependent inactivation of INa. A: Representative current traces recorded from an atrial myocyte on depolarization to −30 mV after conditioning at a range of voltages. Arrow indicates zero current level. Inserts show voltage pulse protocol and current trace elicited from a conditioning potential of −150 mV on an expanded time scale. Dashed line represents fits to Supplemental Equation 2. B: Representative current traces recorded from a ventricular myocyte on depolarization to −30 mV after conditioning at a range of voltages. Arrow indicates zero current level. Voltage pulse protocol as in A. Insert shows current trace elicited from a conditioning potential of −150 mV on an expanded time scale. Dashed line represents fits to Supplemental Equation 2. C: Mean INa steady-state voltage-dependent inactivation curves for atrial (filled circles, n = 29) and ventricular (open circles, n = 29) myocytes. INa were normalized to the amplitude from a conditioning potential of −150 mV. Dashed lines represent fits to Supplemental Equation 3. Data were significantly different by both cell type (P < .0001) and voltage (P < .0001), with significant interaction (P < .0001; 2-way repeated measures analysis of variance). ****P < .0001 vs ventricular; Bonferroni post hoc test.
Figure 3
Figure 3
Use-dependent block of INa by ranolazine (RAN, 30 μM). A: Mean normalized current amplitudes recorded by a series of 40 pulses to −30 mV at diastolic interval (DI) of 110 ms (circles), 60 ms (squares), and 40 ms (triangles) in atrial myocytes (filled symbols) from holding potentials (HPs) of (i) −120 mV (n = 6), (ii) −110 mV (n = 6), and (iii) −100 mV (n = 5) in the presence of RAN. Currents were normalized to the currents elicited in the absence of RAN by the corresponding pulse number. B: Mean normalized current amplitudes recorded using the same protocol as used in A from ventricular myocytes (open symbols) in the presence of RAN from HPs of (i) −120 mV (n = 5), (ii) −110 mV (n = 6), and (iii) −100 mV (n = 9). C: The mean percentage total block elicited by the 40th pulse at DIs of 110, 60, and 40 ms from atrial (filled columns) and ventricular (open columns) myocytes at HPs of (i) −120 mV, (ii) −110 mV, and (iii) −100 mV (sample sizes correspond to A and B). Total block was significantly different by factorial mixed analysis of variance (P < .001). Data were significantly different by DI (P < .001), HP (P < .001), and cell type (P < .001). There was a significant interaction between cell type and HP (P = .02). In Bonferroni post hoc tests, the effect of 110 ms DI was significantly different from 60 ms (P = .014) and 40 ms (P < .001) but there was no statistical confidence in the difference between DI of 60 ms and 40 ms (P = .558). Similarly, the effect of an HP of −120 mV was significantly different from both −110 mV (P < .001) and −100 mV (P < .001) and the effect of −110 mV was significantly different from −100 mV (P = .046).
Figure 4
Figure 4
Effect of holding potential (HP) on percentage use-dependent block by ranolazine. A: Mean percentage use-dependent block at diastolic interval (DI) of 110, 60, and 40 ms in atrial (filled columns, n = 6) and ventricular (open columns, n = 5) from an HP of −120 mV. B: Percentage use-dependent block at DI of 110, 60, and 40 ms in atrial (filled columns, n = 6) and ventricular (open columns, n = 6) from an HP of −110 mV. C: Percentage use-dependent block at DI of 110, 60, and 40 ms in atrial (filled columns, n = 5) and ventricular (open columns, n = 9) from an HP of −100 mV. Use-dependent block was significantly different by factorial mixed analysis of variance (P < .001). Data were significantly different by DI (P < .001), HP (P < .001), and cell type (P = .001). There was a significant interaction between cell type and HP (P < .001). In Bonferroni post hoc tests, the effect of 110 ms DI was significantly different from 60 ms (P = .001) and 40 ms (P < .001) but there was no statistical confidence in the difference between DI of 60 ms and 40 ms (P = .146). Similarly, the effect of an HP of −120 mV was significantly different from both −110 mV (P < .001) and −100 mV (P < .001) but the effect of −110 mV was not different from −100 mV (P = 1.000).
Figure 5
Figure 5
Effect of holding potential (HP) on instantaneous block by ranolazine. Data show mean percentage block on the first pulse to −30 mV at a diastolic interval of 110 ms from HPs of −120, −110, and −100 mV in atrial (filled columns; respectively, 6, 6, and 5 cells) and ventricular (open columns; respectively, 5, 6, and 9 cells) myocytes. **P < .01; ****P < .0001; 2-way analysis of variance with Bonferroni post hoc test vs atrial cells at the corresponding HP.
Figure 6
Figure 6
Effect of ranolazine (RAN) on half-maximal voltage of steady-state inactivation. Data shown are the mean changes in Vhalf,inact caused by 30 μM RAN for atrial (filled column, n = 7) and ventricular (open column, n = 5) myocytes. Hatched columns show corresponding time-matched controls in the absence of RAN for 6 atrial and 5 ventricular myocytes. *P < .05; **P < .01; 2-way analysis of variance with Bonferroni post hoc test.
Figure 7
Figure 7
Effect of ranolazine (RAN) on INa recovery from inactivation. A: Recovery of INa from inactivation in atrial (filled symbols, n = 6) and ventricular (open symbols, n = 5) myocytes. Dashed lines represent fits to Supplemental Equation 4. The holding potential during recovery was −120 mV. B: Fitted fast (left-hand panel) and slow (right-hand panel) time constants in control and in the presence of 30 μM RAN for atrial (filled columns) and ventricular (open columns) myocytes. *P < .05; ***P < .001; 2-way repeated measures analysis of variance (RM ANOVA) with Bonferroni post hoc test vs control. C: Mean amplitude of slow component in control and in the presence of 30 μM RAN for atrial (filled columns) and ventricular (open columns) myocytes. *P < .05; 2-way RM ANOVA with Bonferroni post hoc test vs control.
Figure 8
Figure 8
The window current in atrial and ventricular myocytes. Data plotted against the left-hand axis are window current densities calculated from the parameters presented in Supplemental Table 1 for atrial (solid black line) and ventricular (dashed black line) myocytes. Data plotted against the right-hand axis show steady-state voltage-dependent activation and inactivation curves (I/Imax) according to the fitted parameters presented in Supplemental Table 1 for atrial (solid gray lines) and ventricular (dashed gray lines) myocytes.

References

    1. Benjamin E.J., Chen P.-S., Bild D.E. Prevention of atrial fibrillation: report from a national heart, lung, and blood institute workshop. Circulation. 2009;119:606–618. - PMC - PubMed
    1. Workman A.J., Smith G.L., Rankin A.C. Mechanisms of termination and prevention of atrial fibrillation by drug therapy. Pharmacol Ther. 2011;131:221–241. - PMC - PubMed
    1. Carmeliet E., Vereecke J. 1st ed. Kluwer Academic Publishers; New York: 2002. Cardiac cellular electrophysiology.
    1. Lafuente-Lafuente C., Valembois L., Bergmann J.-F., Belmin J. Antiarrhythmics for maintaining sinus rhythm after cardioversion of atrial fibrillation. Cochrane Database Syst Rev. 2015;3:CD005049. - PubMed
    1. Camm A.J., Kirchhof P., Lip G.Y.H. Guidelines for the management of atrial fibrillation: The Task Force for the Management of Atrial Fibrillation of the European Society of Cardiology (ESC) Eur Heart J. 2010;31:2369–2429. - PubMed

Publication types