. 2017 Aug:58:302-311.
doi: 10.1016/j.actbio.2017.06.016. Epub 2017 Jun 10.

Chondrogenesis of human bone marrow mesenchymal stem cells in 3-dimensional, photocrosslinked hydrogel constructs: Effect of cell seeding density and material stiffness

Affiliations

Chondrogenesis of human bone marrow mesenchymal stem cells in 3-dimensional, photocrosslinked hydrogel constructs: Effect of cell seeding density and material stiffness

Aaron X Sun et al. Acta Biomater. 2017 Aug.

Abstract

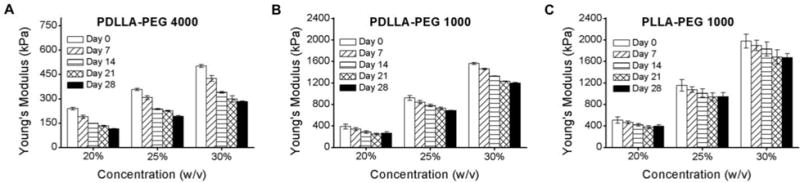
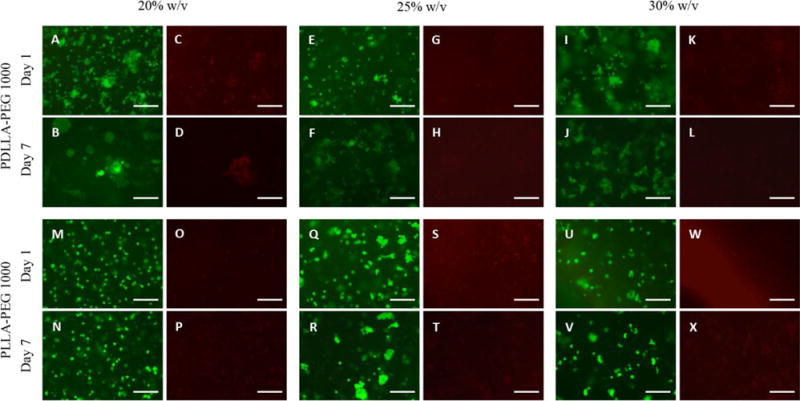
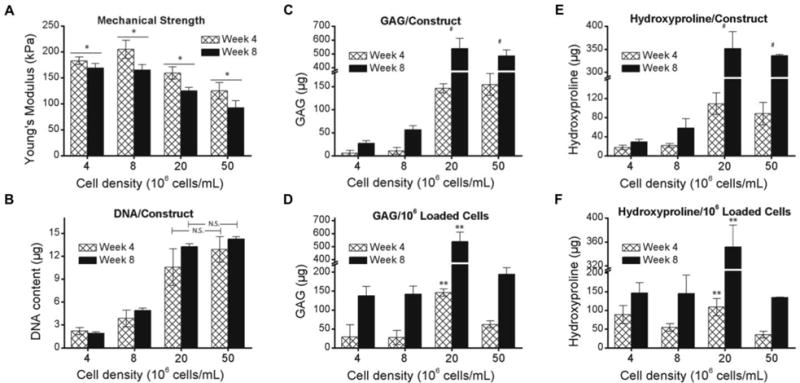
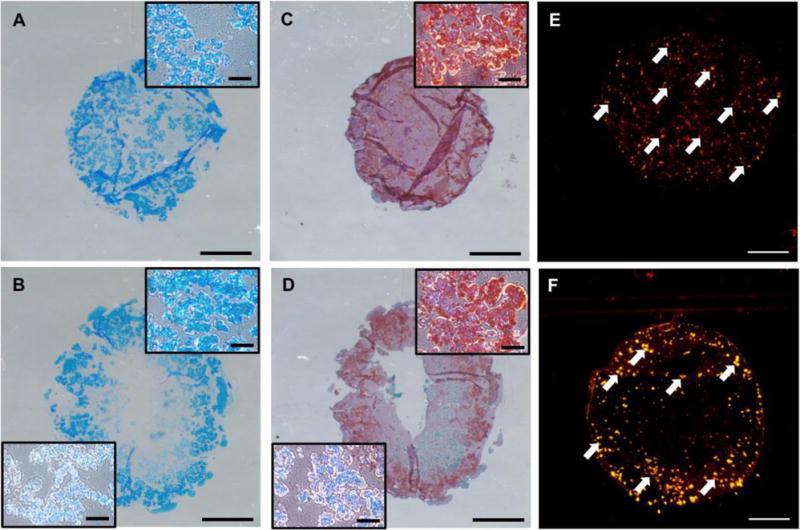
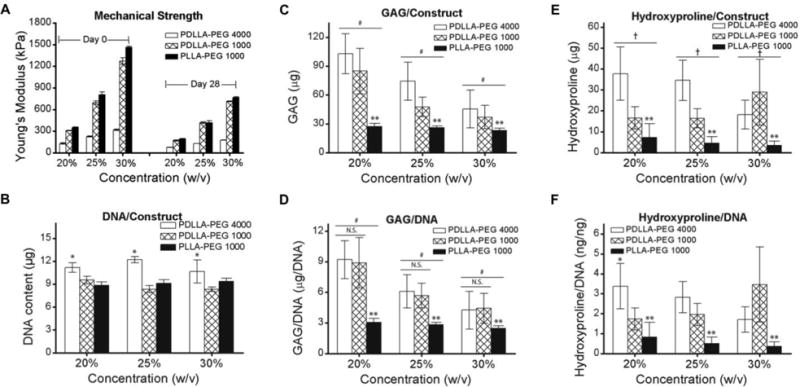
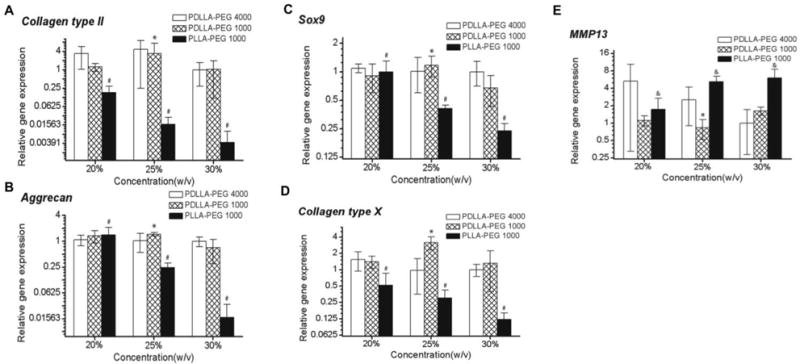
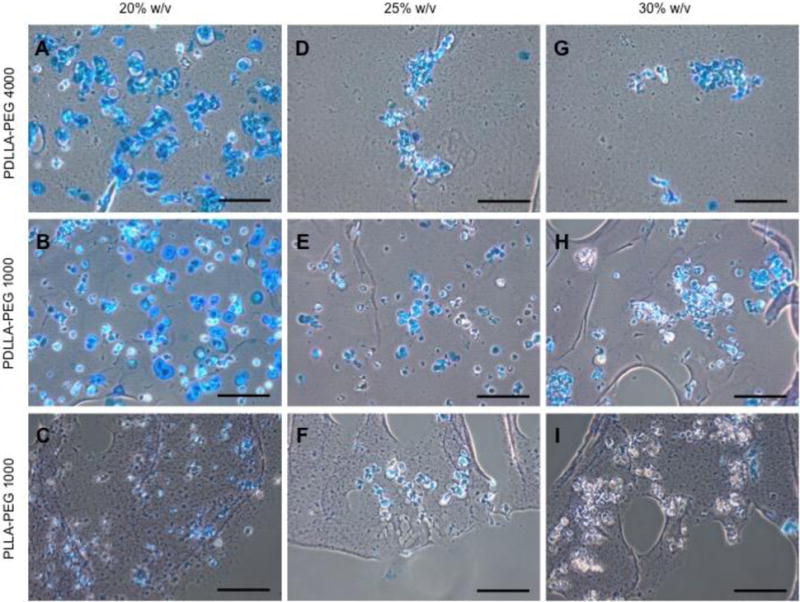
Three-dimensional hydrogel constructs incorporated with live stem cells that support chondrogenic differentiation and maintenance offer a promising regenerative route towards addressing the limited self-repair capabilities of articular cartilage. In particular, hydrogel scaffolds that augment chondrogenesis and recapitulate the native physical properties of cartilage, such as compressive strength, can potentially be applied in point-of-care procedures. We report here the synthesis of two new materials, [poly-l-lactic acid/polyethylene glycol/poly-l-lactic acid] (PLLA-PEG 1000) and [poly-d,l-lactic acid/polyethylene glycol/poly-d,l-lactic acid] (PDLLA-PEG 1000), that are biodegradable, biocompatible (>80% viability post fabrication), and possess high, physiologically relevant mechanical strength (∼1500 to 1800kPa). This study examined the effects of physiologically relevant cell densities (4, 8, 20, and 50×106/mL) and hydrogel stiffnesses (∼150kPa to∼1500kPa Young's moduli) on chondrogenesis of human bone marrow stem cells incorporated in hydrogel constructs fabricated with these materials and a previously characterized PDLLA-PEG 4000. Results showed that 20×106cells/mL, under a static culture condition, was the most efficient cell seeding density for extracellular matrix (ECM) production on the basis of hydroxyproline and glycosaminoglycan content. Interestingly, material stiffness did not significantly affect chondrogenesis, but rather material concentration was correlated to chondrogenesis with increasing levels at lower concentrations based on ECM production, chondrogenic gene expression, and histological analysis. These findings establish optimal cell densities for chondrogenesis within three-dimensional cell-incorporated hydrogels, inform hydrogel material development for cartilage tissue engineering, and demonstrate the efficacy and potential utility of PDLLA-PEG 1000 for point-of-care treatment of cartilage defects.

Statement of significance: Engineering cartilage with physiologically relevant mechanical properties for point-of-care applications represents a major challenge in orthopedics, given the generally low mechanical strengths of traditional hydrogels used in cartilage tissue engineering. In this study, we characterized a new material that possesses high mechanical strength similar to native cartilage, and determined the optimal cell density and scaffold stiffness to achieve the most efficient chondrogenic response from seeded human bone marrow stem cells. Results show robust chondrogenesis and strongly suggest the potential of this material to be applied clinically for point-of-care repair of cartilage defects.

Keywords: Biomaterial scaffold; Bone marrow stem cells; Cartilage tissue engineering; PDLLA-PEG; PLLA-PEG.


Figures

Figure 1
Figure 1. Mechanical properties and degradation of polymers as a function of polymer concentrations and incubation time
(A) PDLLA-PEG 4000; (B) PDLLA-PEG 1000; and (C) PLLA-PEG 1000. Statistically significant reductions in compressive moduli are seen at each increasing time point (p<0.001) and each concentration for all materials, except between days 21 and 28 where p > 0.5. In addition, the main effects of material type and material concentration are significantly different for these biomaterials (p<0.001 based on two-way independent ANOVA). n = 3 replicates for all groups.
Figure 2
Figure 2. Cell viability in hydrogel constructs
(A,B,E,F,I,J,M,N,Q,R,U,V) Calcein-AM staining (green, live cells) and (C,D,G,H,K,L,O,P,S,T,W,X) EthD-1 staining (red, dead cells) in cell-seeded scaffolds following fabrication at days 1 and 7 across 20%, 25%, and 30% w/v polymer concentrations. Cell viability at day 7 was >85% in all groups based on green count/ total count. Scale bar = 150 μm.
Figure 3
Figure 3. Effect of cell density on ECM synthesis
BMSCs were seeded in 30% PDLLA-PEG 4000 at densities ranging from 4 - 50 × 106 cells/mL. (A) Mechanical strength of constructs after 4 and 8 weeks of static culture. (B) Total cell number estimated from DNA content in constructs (C,E) Total ECM deposition measured by (C) GAG and (E) Hydroxyproline contents per construct. (D,F) ECM deposition normalized to initial cell loading number. *, p<0.05, between week 4 and week 8. #, p<0.001, for 20 and 50 × 106 cells/mL groups versus 4 and 8 × 10⁶ cells/mL groups at both timepoints, and no significant difference between 20 and 50 × 106 cells/mL. **, p<0.001, when compared to all other groups at the same time point. n = 6 replicates per group.
Figure 4
Figure 4. ECM deposition in high cell density constructs at 8 weeks
(A,C) Macroscopic view of (A) Alcian Blue/Fast Red staining and (C) Safranin O/fast green staining for GAG deposition in 20 × 106 cells/mL. Inset is a higher magnification representative region in the construct. (B,D) Macroscopic view of (B) Alcian Blue/Fast Red and (D) Safranin O/Fast Green staining at 50 × 106 cells/mL. Top right inset is higher magnification representative region in periphery of construct while bottom left shows higher magnification representative region in more central zone of the construct. (E,F) Cellular uptake of fluorescently labeled transferrin at 20 × 106 cells/mL and 50 × 106 cells/mL after 14 days of static culture, respectively. Scale bars = 1500 μm in macroscopic views, 150 μm in the insets.
Figure 5
Figure 5. Effect of material concentration and stiffness on ECM deposition
BMSCs were seeded at 20 × 106 cells/mL in scaffolds of different polymer concentrations and material properties. (A) Mechanical strength post fabrication and after 4 weeks of culture. Mechanical properties of PDLLA and PLLA-PEG 1000 were significantly higher at all polymer concentrations and timepoints than corresponding PDLLA-PEG 4000 (p<0.001). (B) Cell number measured on the basis of DNA content in constructs. (C,E) Total ECM deposition measured by (C) GAG and (E) Hydroxyproline production per construct. (D, F) ECM deposition normalized to DNA content. *, p<0.001, as compared to other materials at same concentration. **, p<0.001, for main effect of material as compared to others. #, p<0.05, for main effect of material concentration between concentrations and p<0.005 for main effect of PDLLA-PEG 4000 versus other groups. †, p<0.005, for main effect of PDLLA-PEG 4000 versus other groups. All effects were determined by Tukey’s HSD post-hoc testing following two-way independent ANOVA analysis. n = 6 replicates per group.
Figure 6
Figure 6. Real-time PCR analysis of gene expression in hBMSC seeded constructs (20 × 106 cells/mL) at day 28
Relative gene expression levels of (A) collagen type II, (B) Aggrecan, (C) Sox9, (D) collagen type X, and (E) MMP13, normalized to cell gene expression in PDLLA-PEG 4000 at 30% w/v polymer concentration. Overall, two-way independent MANOVA analysis of PDLLA-PEG 4000 versus 1000 revealed no significant differences across all genes except MMP13 (p=0.027). *, p<0.05, for PDLLA-PEG 1000 25% versus 30%. #, p< 0.005, between all concentrations for PLLA-PEG 1000 except collagen type X, where 20% versus 25% showed p=0.286. &, p<0.005, between 20% versus 25% and 30%. n = 6 replicates per group.
Figure 7
Figure 7. Glycosaminoglycan content in hBMSC-encapsulated constructs (20 × 106 cells/mL) visualized by Alcian Blue/Fast Green staining at day 28
(A,D,G) Staining of PDLLA-PEG 4000 group. (B,E,H) Staining of PDLLA-PEG 1000 group. (C,F,I) Staining of PLLA-PEG 1000. Scale bar = 150 μm. Center of scaffold is towards top left of images, and images were obtained between the center and edge of scaffold.

Similar articles

Cited by

References

    1. Tuan RS, Chen AF, Klatt BA. Cartilage regeneration. J Am Acad Orthop Surg. 2013;21(5):303–311. - PMC - PubMed
    1. Neogi T, Zhang Y. Epidemiology of osteoarthritis. Rheum Dis Clin North Am. 2013;39(1):1–19. - PMC - PubMed
    1. Bitton R. The economic burden of osteoarthritis. Am J Manag Care. 2009;15(8 Suppl):S230–S235. - PubMed
    1. Ye K, Di Bella C, Myers DE, Choong PFM. The osteochondral dilemma: Review of current management and future trends. ANZ J Surg. 2014;84(4):211–217. - PubMed
    1. Moran CG, Horton TC. Total knee replacement: the joint of the decade. A successful operation, for which there’s a large unmet need. BMJ. 2000;320(7238):820. - PMC - PubMed

LinkOut - more resources