. 2017 Jul;27(7):1207-1219.
doi: 10.1101/gr.218727.116.

Population genomics and the evolution of virulence in the fungal pathogen Cryptococcus neoformans

Affiliations

Population genomics and the evolution of virulence in the fungal pathogen Cryptococcus neoformans

Christopher A Desjardins et al. Genome Res. 2017 Jul.

Abstract

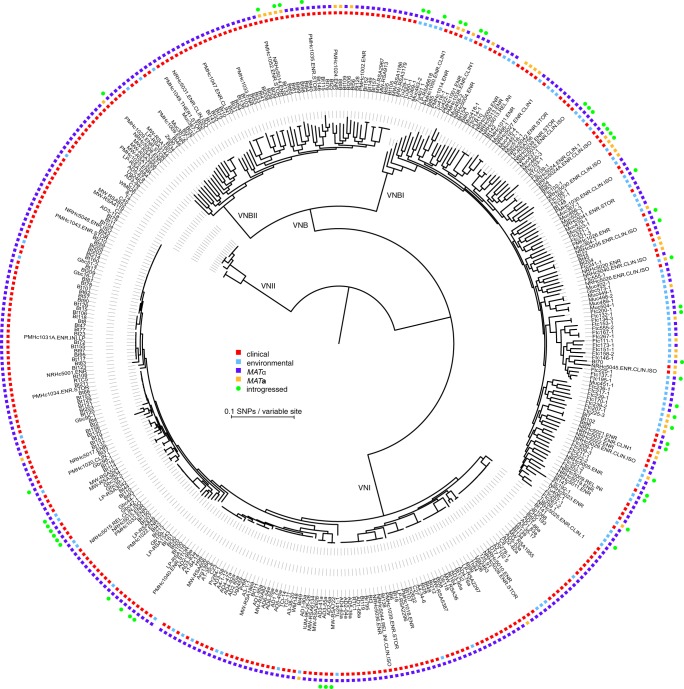
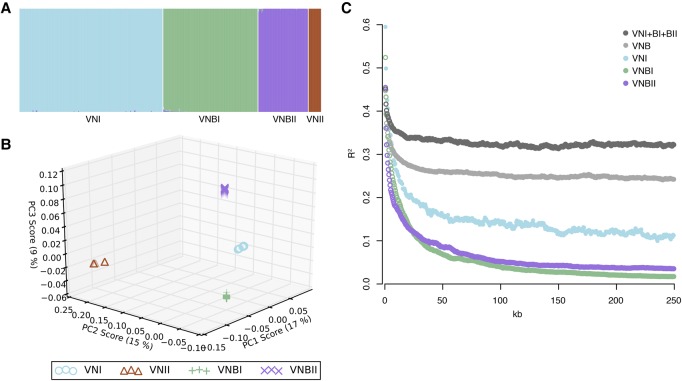
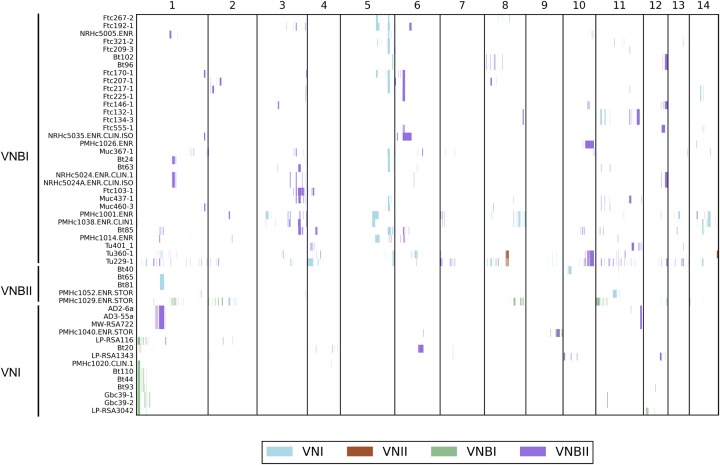
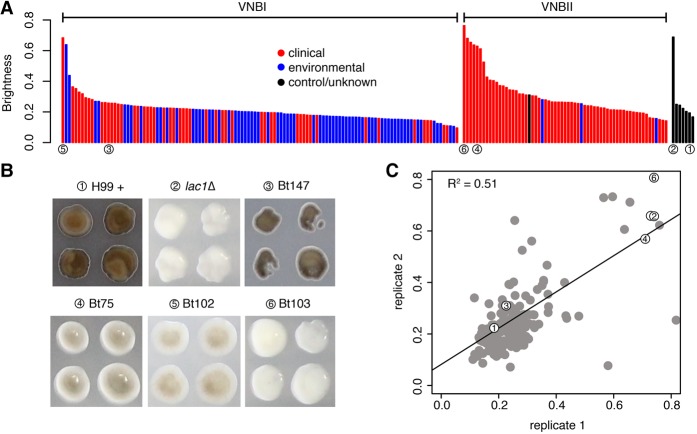
Cryptococcus neoformans is an opportunistic fungal pathogen that causes approximately 625,000 deaths per year from nervous system infections. Here, we leveraged a unique, genetically diverse population of C. neoformans from sub-Saharan Africa, commonly isolated from mopane trees, to determine how selective pressures in the environment coincidentally adapted C. neoformans for human virulence. Genome sequencing and phylogenetic analysis of 387 isolates, representing the global VNI and African VNB lineages, highlighted a deep, nonrecombining split in VNB (herein, VNBI and VNBII). VNBII was enriched for clinical samples relative to VNBI, while phenotypic profiling of 183 isolates demonstrated that VNBI isolates were significantly more resistant to oxidative stress and more heavily melanized than VNBII isolates. Lack of melanization in both lineages was associated with loss-of-function mutations in the BZP4 transcription factor. A genome-wide association study across all VNB isolates revealed sequence differences between clinical and environmental isolates in virulence factors and stress response genes. Inositol transporters and catabolism genes, which process sugars present in plants and the human nervous system, were identified as targets of selection in all three lineages. Further phylogenetic and population genomic analyses revealed extensive loss of genetic diversity in VNBI, suggestive of a history of population bottlenecks, along with unique evolutionary trajectories for mating type loci. These data highlight the complex evolutionary interplay between adaptation to natural environments and opportunistic infections, and that selection on specific pathways may predispose isolates to human virulence.


Figures

Figure 1.
Figure 1.
Phylogenomic analysis reveals a deep split within the VNB lineage. We propose that VNB be divided into two lineages: VNBI and VNBII. The phylogeny was estimated from 1,069,080 segregating sites using RAxML (Stamatakis 2014), and the tree was rooted with VNII as the outgroup. All lineages (VNI, VNII, VNBI, and VNBII) had 100% bootstrap support. Isolation source (clinical versus environmental), mating type (MATα and MATa), and presence of ≥50 kb of introgressions from other lineages are also shown. VNBI samples were enriched for environmental isolation sources relative to VNBII (P < 0.0001, Fisher's exact test).
Figure 2.
Figure 2.
C. neoformans var. grubii is separated into four distinct nonrecombining lineages: VNI, VNII, VNBI, and VNBII. (A) Results of STRUCTURE analysis (k = 4) shows separation of all four lineages. (B) Top three principal components from PCA. The third principal component clearly separates VNBI from VNBII. (C) Decay of linkage disequilibrium (LD) shows similar rates of recombination within groups and lack of recombination between groups. LD (R2) was calculated for all pairs of SNPs separated by 0–250 kb and then averaged for every 500 bp. LD values for each window were then calculated by averaging over all pairwise calculations in the window. The chromosome with the mating type locus was excluded from the calculations.
Figure 3.
Figure 3.
Small introgressions between VNI, VNII, VNBI, and VNBII are dispersed throughout the genome and phylogeny. Introgressions were detected by running STRUCTURE (k = 4) on 500-kb blocks, excluding the mating type locus, and the group ancestry of each 5 kb within each block was identified. Recipient genomes are shown on the y-axis, and genomic position is shown on the x-axis. White indicates non-introgressed regions, and colored blocks indicate introgressed regions. The color key shows the color that corresponds to each donor group.
Figure 4.
Figure 4.
Phenotypic and GWAS analyses demonstrate that VNBI isolates have a greater ability to melanize than VNBII isolates and identify BZP4-deficient isolates as having reduced melanization capacity. (A) Isolates were provided with L-DOPA, and colony brightness was assayed; isolates with the lowest brightness are the most melanized. Clinical isolates are shown in red, environmental isolates are shown in blue, control/unknown isolates are shown in black, and isolates described in B are underscored with numbered circles. VNBI clinical isolates were significantly more melanized than VNBII clinical isolates (P < 0.00017), and VNBI environmental isolates were significantly more melanized than VNBI clinical isolates (P < 0.00047). For the latter comparison, the least melanized (brightness ≥0.6) samples were excluded to prevent an effect of sampling bias. (B) GWAS analysis identified loss-of-function mutations in BZP4 as being associated with a lack of melanization. The four isolates with BZP4 loss-of-function mutations are shown here in the L-DOPA assay, along with the positive control H99 and the negative control lac1Δ. (C) A strong correlation of melanization was present between replicates. Isolates shown in B are indicated with numbered circles.
Figure 5.
Figure 5.
Population genomic analysis revealed long tracts of low genetic diversity and Tajima's D in VNI and VNBI. (A) Low diversity tracts are shown here in Chromosome 5. In VNBI, these tracts are interspersed between regions of high diversity. Vertical blue bars highlight these areas of reduced diversity and Tajima's D in VNBI, which are generally accompanied by high FST between populations. Statistics shown include π, Tajima's D, and FST. (B) Density distribution of Tajima's D across all 14 chromosomes for VNI, VNBI, and VNBII. VNI and VNBII show predominantly unimodal distributions for most chromosomes, and VNBI shows a bimodal distribution for all chromosomes except Chromosome 6.
Figure 6.
Figure 6.
Phylogenetic and linkage analyses reveal distinct evolutionary trajectories of the MAT locus alleles. (A) The topology of the whole-genome phylogeny and MATα phylogeny are compared as cladograms. VNBI isolates contain two distinct α alleles. (B) MATα phylogram showing branch lengths and bootstrap support for major clades. (C) Linkage disequilibrium (R2) and diversity (π) across the MATα locus. (D) Topology of the whole-genome phylogeny and MATa phylogeny are compared as cladograms. (E) MATa phylogram showing branch lengths and bootstrap support for major clades. VNI is a close sister group to VNBI, in contrast to the whole-genome phylogeny, and there is limited support for monophyly of the VNI MATa allele with respect to VNBI (bootstrap support: 68%). (F) Linkage disequilibrium (R2) and diversity (π) across the MATa locus.

Similar articles

Cited by

References

    1. Benjamini Y, Hochberg Y. 1995. Controlling the false discovery rate: a practical and powerful approach to multiple testing. J R Stat Soc Ser B Methodol 57: 289–300.
    1. Brown SP, Cornforth DM, Mideo N. 2012. Evolution of virulence in opportunistic pathogens: generalism, plasticity, and control. Trends Microbiol 20: 336–342. - PMC - PubMed
    1. Brown JC, Nelson J, VanderSluis B, Deshpande R, Butts A, Kagan S, Polacheck I, Krysan DJ, Myers CL, Madhani HD. 2014. Unraveling the biology of a fungal meningitis pathogen using chemical genetics. Cell 159: 1168–1187. - PMC - PubMed
    1. Bulmer GS, Sans MD, Gunn CM. 1967. Cryptococcus neoformans I. Nonencapsulated mutants. J Bacteriol 94: 1475–1479. - PMC - PubMed
    1. Chacko N, Zhao Y, Yang E, Wang L, Cai JJ, Lin X. 2015. The lncRNA RZE1 controls cryptococcal morphological transition. PLoS Genet 11: e1005692. - PMC - PubMed

MeSH terms