. 2017 Sep 15;23(18):5611-5621.
doi: 10.1158/1078-0432.CCR-16-3272. Epub 2017 Jun 13.

Role of Platelet-Derived Tgfβ1 in the Progression of Ovarian Cancer

Affiliations

Role of Platelet-Derived Tgfβ1 in the Progression of Ovarian Cancer

Qianghua Hu et al. Clin Cancer Res. .

Abstract

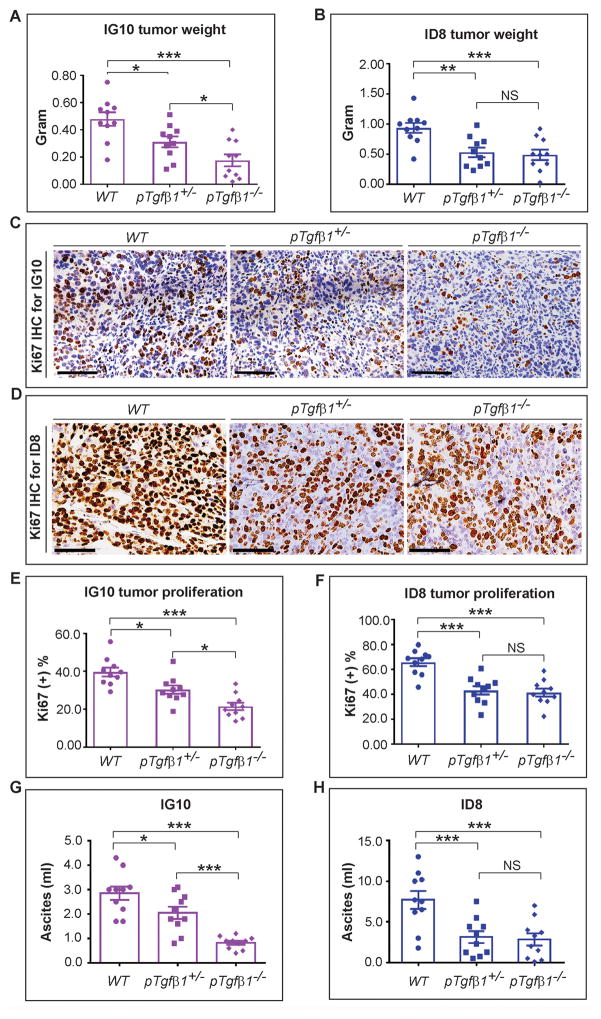
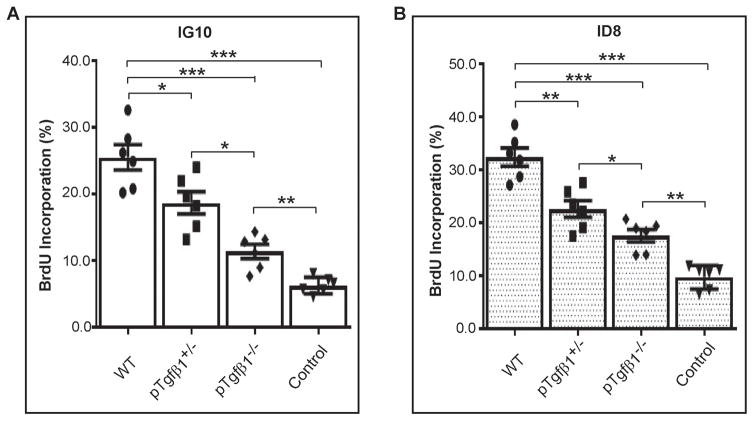
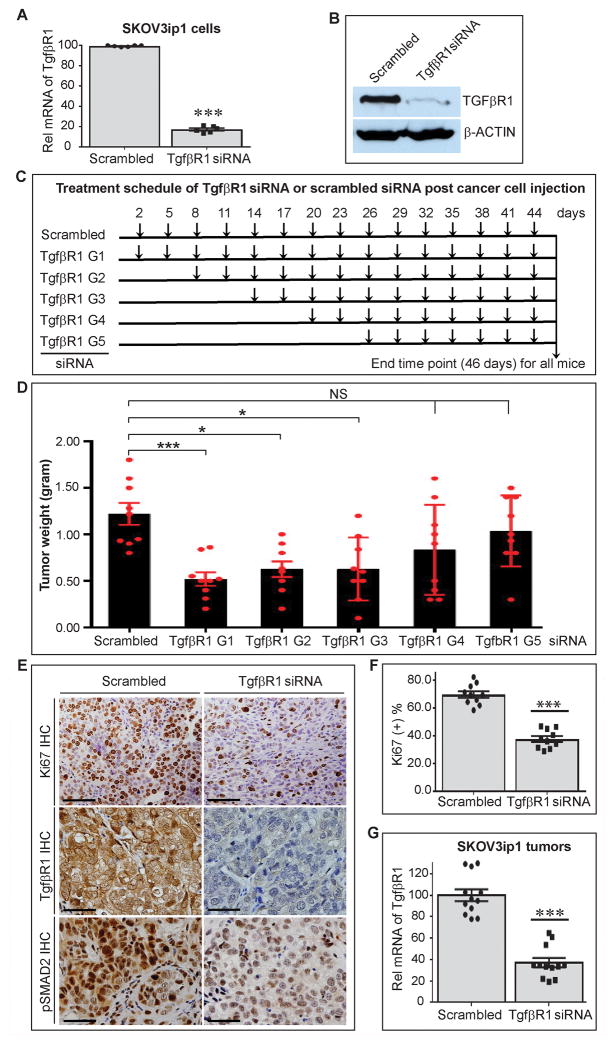
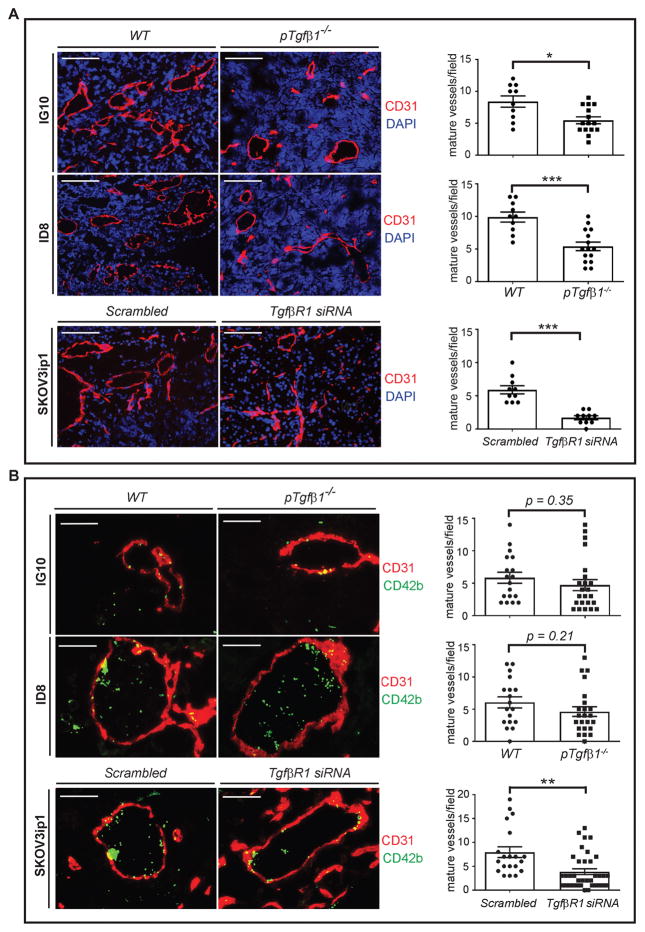
Purpose: Transforming growth factor β1 (Tgfβ1) plays an important role in cancer. Most of Tgfβ1 in plasma is from platelets; thus, we studied whether platelet Tgfβ1 has any role in the progression of ovarian cancer, and whether this role is limited to metastasis or also involves the growth of primary tumors.Experimental Design: We compared the growth of murine ovarian cancer cell-induced tumors in platelet-specific Tgfβ1-deficient mice and wild-type mice. Using resected tumor nodules, we studied the effect of platelet Tgfβ1 on neoangiogenesis and on platelet extravasation into tumors. To investigate the effect of Tgfβ1 at different stages of ovarian cancer, we reduced expression of Tgfβ1 receptor (its TgfβR1 component) in tumors at different time points after injection of cancer cells, and compared the final tumor size.Results: Lack of platelet Tgfβ1 in mice reduced tumor growth, neoangiogenesis, and platelet extravasation. Ovarian cancer tumors in platelet-specific Tgfβ1-deficient mice reached less than half of their size in wild-type littermates. Knockdown of TgfβR1 on cancer cells in the first 2 weeks after their injection reduced tumor growth, but was less effective if initiated after 3 weeks.Conclusions: We showed that platelet Tgfβ1 increased the growth of primary tumors in murine models of ovarian cancer. We also showed that inhibition of TgfβR1 is more effective in reducing the growth of ovarian cancer if initiated earlier. Our results supported a therapeutic benefit in preventing platelet activation, degranulation, and release of Tgfβ1 in ovarian cancer. Clin Cancer Res; 23(18); 5611-21. ©2017 AACR.


Conflict of interest statement

The authors declare no potential conflicts of interest

Figures

Figure 1
Figure 1
Platelet Tgfβ1 and growth of orthotopic murine ovarian cancer. 8–10 weeks after i.p. injection of murine ovarian cancer cells (IG10 and ID8) tumor nodules were resected from moribund mice. (A) Aggregate weight of IG10-induced tumor nodules in 3 groups of mice (n=10/group): WT, pTgfβ1+l−, and pTgfβ1−l−. (B) Aggregate weight of ID8-induced tumor nodules in 3 groups of mice (n=10/group): WT, pTgfβ1+l−, and pTgfβ1−l−. (C) Representation of Ki67 immunostaining of sections of IG10-induced tumor nodules. (D) Representation of Ki67 immunostaining of sections of ID8-induced tumor nodules. Scale bars in panels C & D are 200 μm. (E) Quantification of Ki67 positivity (proliferation index) in IG10-induced tumors (n=10). (F) Quantification of Ki67 positivity (proliferation index) in ID8-induced tumors (n=10). Ascites volume associated with (G) IG10 and (H) ID8 cell-induced tumors in WT, pTgfβ1+l−, and pTgfβ1−l− mice (n=10 mice/group). The ANOVA analysis was performed on the experimental results represented in A–H. The corresponding p values of the F-test were 0.002 (A), 0.001 (B), 0.00001 (E), 0.00001 (F), <0.00001 (G), and 0.007 (H). Student’s t-test was carried out for statistical analysis, and significance levels were as follows: p < 0.05 for *, p < 0.01 for **, p < 0.001 for ***. Averaged data are presented as the mean ± SEM.
Figure 2
Figure 2
Effect of platelet Tgfβ1 on cancer cell proliferation in vitro. Fresh platelets isolated from whole blood of mice were coincubated with murine ovarian cancer cells (IG10 and ID8) and the cell proliferation rate was measured by quantifying BrdU incorporations (A) Proliferation rate of IG10 cells coincubated with platelets isolated from WT, pTgfβ1+l−, or pTgfβ1−l− mice. IG10 cells incubated in buffer were used as controls. (B) Proliferation rate of ID8 cells coincubated with platelets from WT, pTgfβ1+l−, or pTgfβ1−l− mice. ID8 cells incubated in buffer were used as controls. n=3 mice per each genotype and each assay was performed in duplicate. The ANOVA analysis was performed on the results of both experiments. The corresponding p values of the F-test were 0.00006 (A), and < 0.00001 (B). Student’s t-test is carried out for statistical analysis and significance levels indicated are as follows: p < 0.05 for *, p < 0.01 for **, p < 0.001 for ***. Averaged data are presented as the mean ± SEM.
Figure 3
Figure 3
Expression of TgfβR1 on ovarian cancer and growth of orthotopic tumors in mice. Expression of TgfβR1 on human ovarian cancer cells (SKOV3ip1) after injection to mice was reduced using human (h) TgfβR1 siRNA at different time points, and final growth of orthotopic tumors was compared between different groups. (A) Quantification of TgfβR1 mRNA level in SKOV3ip1 cells incubated with scrambled siRNA or hTgfβR1 siRNA in vitro for 48 hours by qRT-PCR (n=6). (B) Effect of hTgfβR1 siRNA and scrambled siRNA on the expression of TgfβR1 at the protein level in SKOV3ip1 cells. A representative Western-blot is shown (n=3). (C) Experimental design for reducing expression of TgfβR1 on SKOV3ip1 cells in tumor-bearing nude mice at different time points using in vivo delivery of hTgfβR1 siRNA by DOPC-based liposomes. Each experimental group (n=9 mice/group) received i.p. injection of hTgfβR1 siRNA every 3 days, starting at day 2(G1), day 8 (G2), day 14 (G3), day 20 (G4), or day 26 (G5) after injection of cancer cells that continued until day 46. Tumor-bearing mice in control group (scrambled) received i.p. injection of scrambled siRNA every 3 days starting on day 2 until day 46. (D) Aggregate weight of SKOV3ip1-induced tumor nodules in different treatment and control groups. (E) Representation of Ki67, TgfβR1, and phosphorylated SMAD2 (pSMAD2) immunostaining of sections of SKOV3ip1-induced tumor nodules. Scale bars are 100 μm. (F) Quantification of Ki67 positivity (proliferation index) in SKOV3ip1-induced tumors (n=10, 5 mice per group, 1 nodule from each mouse, and 2 sections per nodule). Scale bars are 200 μm. (G) Quantification of TgfβR1 mRNA level in SKOV3ip1-induced tumors resected from mice treated with scrambled siRNA or hTgfβR1 siRNA. The ANOVA analysis was performed on the results in D and the p value was <0.00001. Student’s t-test was carried out for statistical analysis, and significance levels were as follows: p < 0.05 for *, p < 0.01 for **, p < 0.001 for ***. NS: no significance. Averaged data are presented as the mean ± SEM.
Figure 4
Figure 4
Effect of platelet’s Tgfβ1 and ovarian cancer cell’s TgfβR1 on neoangiogenesis and platelet extravasation. Sections of IG10, ID8, and SKOV3ip-induced tumor nodules were stained with DAPI (nuclei of cancer cells), CD31 (endothelial cells) and CD42b (platelets) and analyzed by immunofluorescence microscopy. (A) The left side panel shows representative of micrographs from sections of tumor nodules. Blood vessels were detected by lumens encircled with CD31+ cells. The right side panel shows quantification of blood vessel density in each group of mice (5 mice/group, at least 3 tumor nodules per mouse, 1 section per nodule, and 2 or more HPF per section). Scale bars are 200 μm. (B) The left side panel shows representative micrographs of sections of tumor nodules. Extravasated platelets were detected by intratumor and extravascular CD42b+ cells. The right side panel shows quantification of extravasated platelets in each group of mice (5 mice/group and at least 3 tumor nodules per mouse, 2 random sections per nodule and 2 or more HPF per section). Scale bars are 100 μm. Student’s t-test is carried out for statistical analysis and significance levels indicated are as follows: p < 0.05 for *, p < 0.001 for ***. Averaged data are presented as the mean ± SEM.

References

    1. Labelle M, Hynes RO. The initial hours of metastasis: the importance of cooperative host-tumor cell interactions during hematogenous dissemination. Cancer discovery. 2012;2(12):1091–9. doi: 10.1158/2159-8290.cd-12-0329. - DOI - PMC - PubMed
    1. Leblanc R, Peyruchaud O. Metastasis: new functional implications of platelets and megakaryocytes. Blood. 2016;128(1):24–31. doi: 10.1182/blood-2016-01-636399. - DOI - PubMed
    1. Labelle M, Begum S, Hynes RO. Direct signaling between platelets and cancer cells induces an epithelial-mesenchymal-like transition and promotes metastasis. Cancer Cell. 2011;20(5):576–90. - PMC - PubMed
    1. Kopp HG, Placke T, Salih HR. Platelet-derived transforming growth factor-beta down-regulates NKG2D thereby inhibiting natural killer cell antitumor reactivity. Cancer Res. 2009;69(19):7775–83. - PubMed
    1. Stone RL, Nick AM, McNeish IA, Balkwill F, Han HD, Bottsford-Miller J, et al. Paraneoplastic thrombocytosis in ovarian cancer. NEnglJMed. 2012;366(7):610–8. - PMC - PubMed

MeSH terms

Substances