

Clinical and Genome-Wide Analysis of Cisplatin-Induced Peripheral Neuropathy in Survivors of Adult-Onset Cancer
- PMID: 28611204
- PMCID: PMC5626588
- DOI: 10.1158/1078-0432.CCR-16-3224
Clinical and Genome-Wide Analysis of Cisplatin-Induced Peripheral Neuropathy in Survivors of Adult-Onset Cancer
Abstract
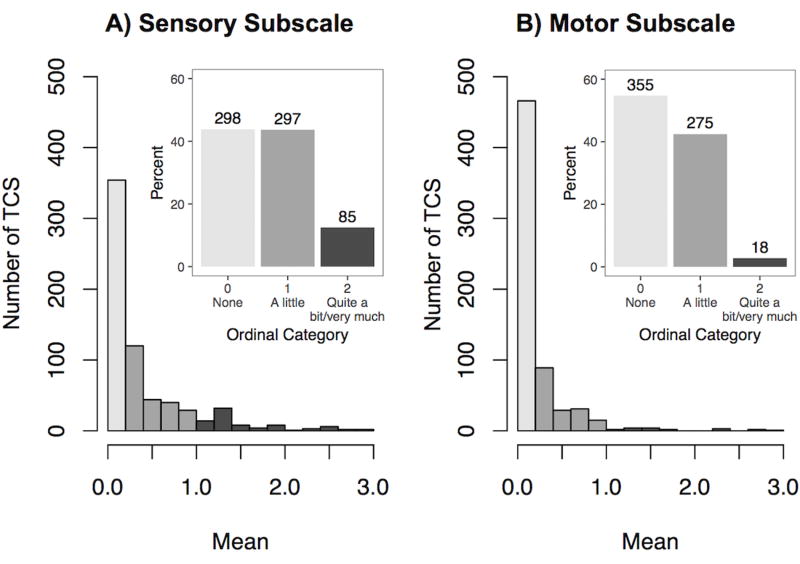
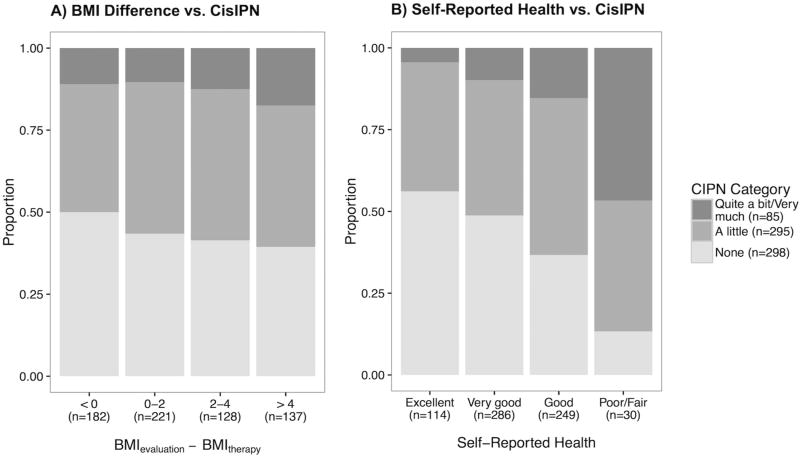
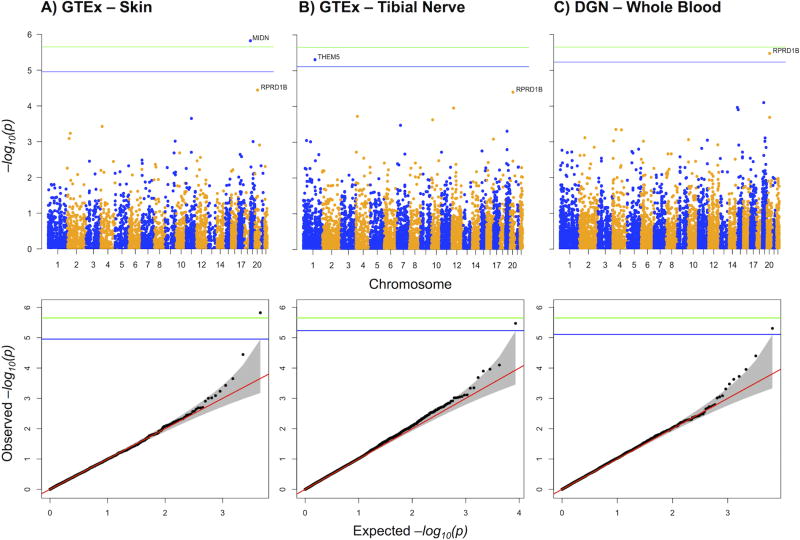
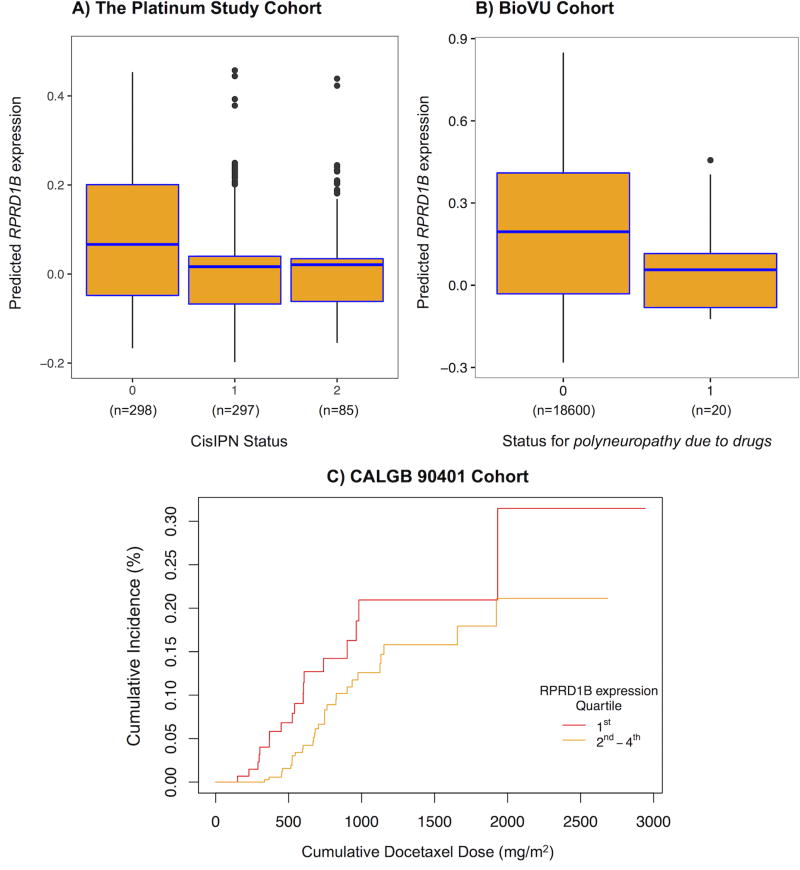
Purpose: Our purpose was to characterize the clinical influences, genetic risk factors, and gene mechanisms contributing to persistent cisplatin-induced peripheral neuropathy (CisIPN) in testicular cancer survivors (TCSs).Experimental Design: TCS given cisplatin-based therapy completed the validated EORTC QLQ-CIPN20 questionnaire. An ordinal CisIPN phenotype was derived, and associations with age, smoking, excess drinking, hypertension, body mass index, diabetes, hypercholesterolemia, cumulative cisplatin dose, and self-reported health were examined for 680 TCS. Genotyping was performed on the Illumina HumanOmniExpressExome chip. Following quality control and imputation, 5.1 million SNPs in 680 genetically European TCS formed the input set. GWAS and PrediXcan were used to identify genetic variation and genetically determined gene expression traits, respectively, contributing to CisIPN. We evaluated two independent datasets for replication: Vanderbilt's electronic health database (BioVU) and the CALGB 90401 trial.Results: Eight sensory items formed a subscale with good internal consistency (Cronbach α = 0.88). Variables significantly associated with CisIPN included age at diagnosis (OR per year, 1.06; P = 2 × 10⁻⁹), smoking (OR, 1.54; P = 0.004), excess drinking (OR, 1.83; P = 0.007), and hypertension (OR, 1.61; P = 0.03). CisIPN was correlated with lower self-reported health (OR, 0.56; P = 2.6 × 10⁻⁹) and weight gain adjusted for years since treatment (OR per Δkg/m2, 1.05; P = 0.004). PrediXcan identified lower expressions of MIDN and RPRD1B, and higher THEM5 expression as associated with CisIPN (P value for each < 5 × 10⁻⁶) with replication of RPRD1B meeting significance criteria (Fisher combined P = 0.0089).Conclusions: CisIPN is associated with age, modifiable risk factors, and genetically determined expression level of RPRD1B Further study of implicated genes could elucidate the pathophysiologic underpinnings of CisIPN. Clin Cancer Res; 23(19); 5757-68. ©2017 AACR.
©2017 American Association for Cancer Research.
Figures
References
-
- Argyriou AA, Bruna J, Marmiroli P, Cavaletti G. Chemotherapy-induced peripheral neurotoxicity (CIPN): an update. Crit Rev Oncol Hematol. 2012;82:51–77. - PubMed
-
- Kawakami K, Tunoda T, Takiguchi T, Shibata K, Ohtani T, Kizu J, et al. Factors exacerbating peripheral neuropathy induced by paclitaxel plus carboplatin in non-small cell lung cancer. Oncol Res. 2012;20:179–85. - PubMed
MeSH terms
Substances
Grants and funding
- R01 DA006227/DA/NIDA NIH HHS/United States
- R01 MH101782/MH/NIMH NIH HHS/United States
- R01 MH090936/MH/NIMH NIH HHS/United States
- R01 CA157823/CA/NCI NIH HHS/United States
- P30 CA008748/CA/NCI NIH HHS/United States
- R01 MH090951/MH/NIMH NIH HHS/United States
- R01 MH101820/MH/NIMH NIH HHS/United States
- R01 MH101822/MH/NIMH NIH HHS/United States
- R01 MH101810/MH/NIMH NIH HHS/United States
- P50 MH094267/MH/NIMH NIH HHS/United States
- R01 MH101819/MH/NIMH NIH HHS/United States
- U24 GM115370/GM/NIGMS NIH HHS/United States
- U10 CA180821/CA/NCI NIH HHS/United States
- R01 DA033684/DA/NIDA NIH HHS/United States
- R01 MH101825/MH/NIMH NIH HHS/United States
- R01 MH090948/MH/NIMH NIH HHS/United States
- R01 MH090941/MH/NIMH NIH HHS/United States
- HHSN261200800001C/RC/CCR NIH HHS/United States
- R01 MH090937/MH/NIMH NIH HHS/United States
- HHSN268201000029C/HL/NHLBI NIH HHS/United States
- HHSN261200800001E/CA/NCI NIH HHS/United States
- R01 MH101814/MH/NIMH NIH HHS/United States
LinkOut - more resources
Full Text Sources
Other Literature Sources
Medical
Molecular Biology Databases
