. 2017 Jun 13;7(1):3344.
doi: 10.1038/s41598-017-03132-x.

Variable thermal expansion of glass-ceramics containing Ba1-xSrxZn2Si2O7

Affiliations

Variable thermal expansion of glass-ceramics containing Ba1-xSrxZn2Si2O7

Christian Thieme et al. Sci Rep. .

Abstract

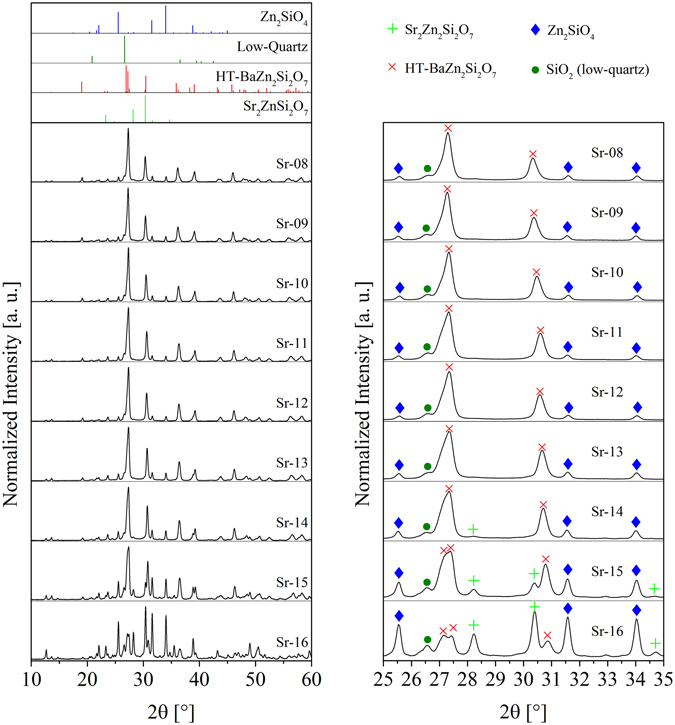
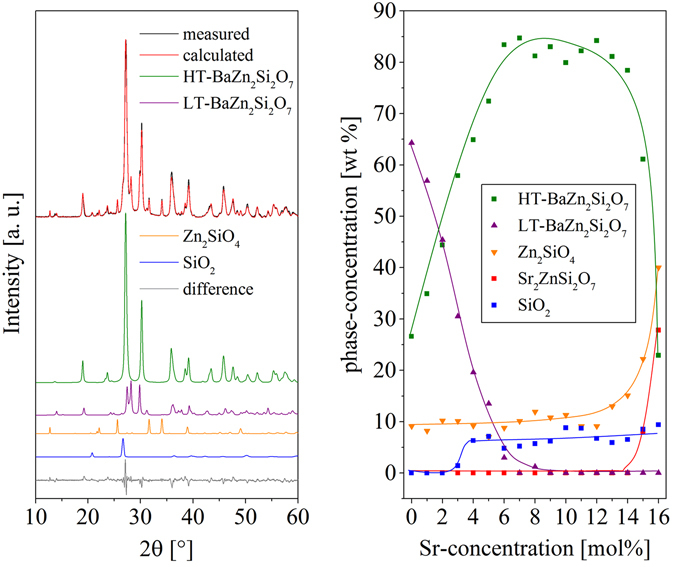
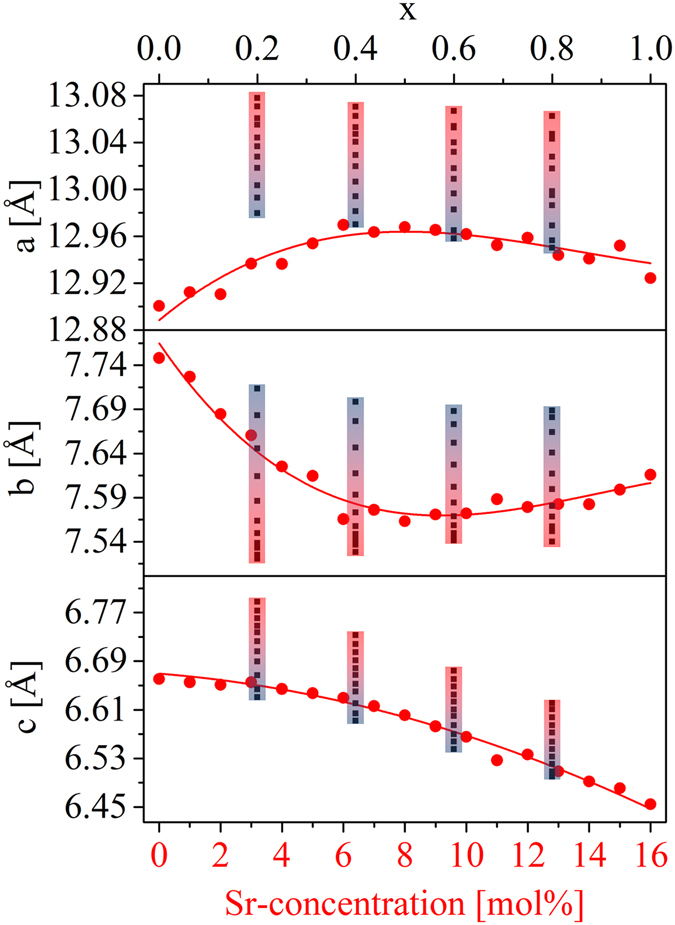
Up to now, the thermal expansion behavior of multiphase glass-ceramics cannot be predicted reliably because of the nescience about the formation of the type and concentration of crystalline phases. In the system BaO-SrO-ZnO-SiO2, recently a new phase based on Ba1-xSrxZn2Si2O7 solid solutions was found, which exhibits unexpected low and highly anisotropic thermal expansion, which can be used for an adjustment of the thermal expansion properties. In the case of sealing materials for high-temperature reactors, the formation of this phase should be avoided. Hence, in this manuscript the concentration thresholds in which these solid solutions precipitate from glasses were determined. The phase analysis was correlated with the thermal expansion behavior of the glass-ceramics. Depending on the Ba/Sr-ratio of the glasses and the considered temperature range, the coefficients of thermal expansion of the glass-ceramics vary between 19.4·10-6 K-1 and 4.8·10-6 K-1. The concentration thresholds in which the as mentioned phases form via crystallization of glasses differ strongly from the literature values obtained via conventional ceramic mixed oxide route.


Conflict of interest statement

The authors declare that they have no competing interests.

Figures

Figure 1
Figure 1
Thermal analysis of the glasses. On the left, DSC-curves of all samples are illustrated. The upper right graph shows the change of the crystallization temperature as a function of the Sr-concentration. The lower right part shows the glass transition temperature determined via dilatometry in dependence of the Sr-concentration.
Figure 2
Figure 2
Thermal analysis and pycnometric results. On the upper left, dilatometric curves of elevated samples are displayed. The upper right shows the coefficients of thermal expansion as a function of the Sr-concentration. The lower left Figure displays the dilatometric softening temperature as a function of the Sr-concentration. The lower right diagram shows the density in dependence of the Sr-concentration. The density was fitted by a linear regression. The respective formula is given inside the diagram, where x is the respective Sr-concentration in units of [mol%].
Figure 3
Figure 3
Results from dilatometry of pressed powder compacts, which were sintered and crystallized at 900 °C for 1 h. The upper and the lower left diagrams show the dilatation curves for different compositions. The upper right part shows the phase transition temperatures (TPT) of the transition from phases with the structure of LT-BaZn2Si2O7 to HT-BaZn2Si2O7. The linear regression is given inside the diagram, where the phase transition temperature in units of [°C] is given as a function of the Sr-concentration x in units of [mol%]. The lower right part shows technical coefficients of thermal expansion in dependence of the Sr-concentration calculated for different temperature ranges.
Figure 4
Figure 4
X-ray diffraction patterns of samples crystallized at 900 °C for 1 h with Sr-concentrations in the range from 0 to 8 mol%. On the left side, the full measuring range is illustrated together with the theoretical peak positions calculated from the respective ICSD entries or from the literature (LT-BaZn2Si2O7 , HT-BaZn2Si2O7 , Zn2SiO4 (willemite), SiO2 (low-quartz)). On the right side, the same patterns are illustrated in a narrower 2θ-range from 25–33° and the peaks are attributed to certain crystalline phases.
Figure 5
Figure 5
X-ray diffraction patterns of samples crystallized at 900 °C for 1 h with Sr-concentrations in the range from 8 to 16 mol%. On the left side, the full measuring range is illustrated together with the theoretical peak positions calculated from the respective ICSD entries or from the literature (HT-BaZn2Si2O7 , Zn2SiO4 (willemite), SiO2 (low-quartz), Sr2ZnSi2O7 ). On the right side, the same patterns are illustrated in a narrower 2θ-range from 25–35° and the peaks are attributed to certain crystalline phases.
Figure 6
Figure 6
Results from quantitative phase analysis. On the left side, the result from the refinement of the sample Sr-04 heat treated at 900 °C for 1 h is shown. On the right side, the concentration of the crystal phases is given as a function of the Sr-concentration of the glasses. The sum of all crystalline phases is 100%, i. e. the residual amorphous phase is not considered in this illustration. The inserted lines are just a guide for the eyes. Uncertainties are around ± 5 mol%.
Figure 7
Figure 7
Lattice parameters of Ba1−xSrxZn2Si2O7 solid solution phases with the crystal structure of HT-BaZn2Si2O7. The red circles belong to the lattice parameters determined from the glass-ceramics with different Sr-concentrations heat treated at 900 °C for 1 h. The black squares belong to the lattice parameters determined in ref. at room temperature and between 100 and 1000 °C in steps of 100 K. The temperature increase is marked by the colored rectangles, where the temperature increases from blue to red. These values belong to the upper x-axis. Both x-axes are the same in the case that all alkaline earth ions are solely incorporated into the Ba1−xSrxZn2Si2O7 solid solutions.

References

    1. Reddy AA, Tulyaganov DU, Kharton VV, Ferreira JMF. Development of bilayer glass-ceramic SOFC sealants via optimizing the chemical composition of glasses—a review. J. Solid State Electrochem. 2015;19:2899–2916. doi: 10.1007/s10008-015-2925-5. - DOI
    1. Wang X, Ou DR, Zhao Z, Cheng M. Stability of SrO–La2O3–Al2O3–SiO2 glass sealants in high-temperature air and steam. Ceram. Int. 2016;42:7514–7523. doi: 10.1016/j.ceramint.2016.01.158. - DOI
    1. Luo L, et al. Application of BaO–CaO–Al2O3–B2O3–SiO2 glass–ceramic seals in large size planar IT-SOFC. Ceram. Int. 2015;41:9239–9243. doi: 10.1016/j.ceramint.2015.01.091. - DOI
    1. Fakouri Hasanabadi M, Nemati A, Kokabi AH. Effect of intermediate nickel layer on seal strength and chemical compatibility of glass and ferritic stainless steel in oxidizing environment for solid oxide fuel cells. Int. J. Hydrogen Energy. 2015;40:16434–16442. doi: 10.1016/j.ijhydene.2015.10.023. - DOI
    1. Da Silva MJ, Bartolomé JF, De Aza AH, Mello-Castanho S. Glass ceramic sealants belonging to BAS (BaO–Al2O3–SiO2) ternary system modified with B2O3 addition: A different approach to access the SOFC seal issue. J. Eur. Ceram. Soc. 2016;36:631–644. doi: 10.1016/j.jeurceramsoc.2015.10.005. - DOI

Publication types