. 2017 May 30:11:152.
doi: 10.3389/fncel.2017.00152. eCollection 2017.

mTORC1 Is a Local, Postsynaptic Voltage Sensor Regulated by Positive and Negative Feedback Pathways

Affiliations

mTORC1 Is a Local, Postsynaptic Voltage Sensor Regulated by Positive and Negative Feedback Pathways

Farr Niere et al. Front Cell Neurosci. .

Abstract

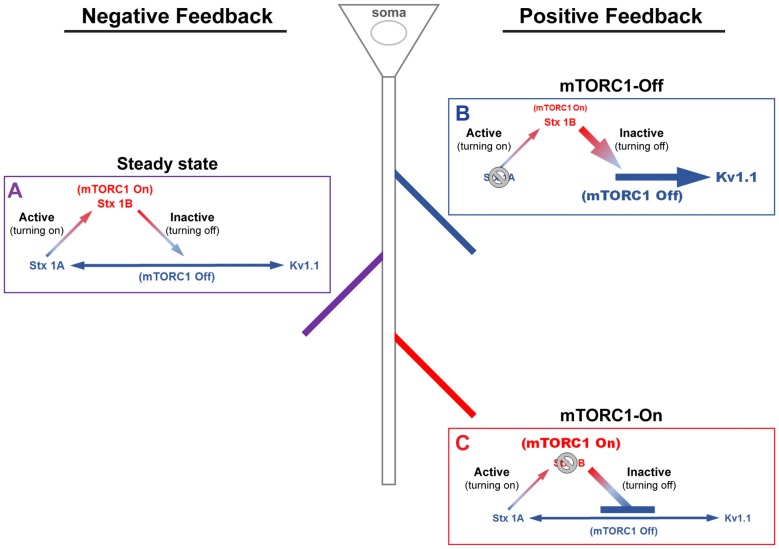
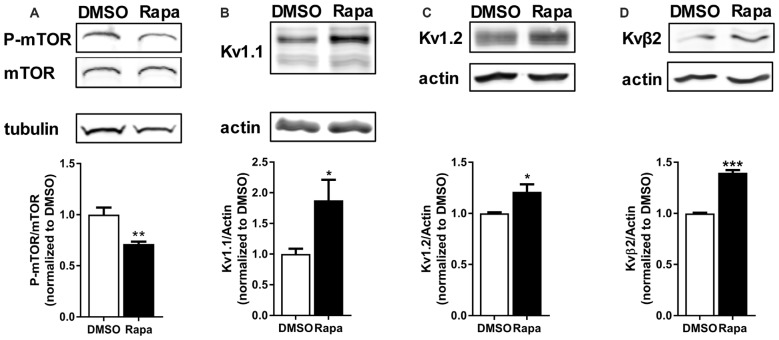
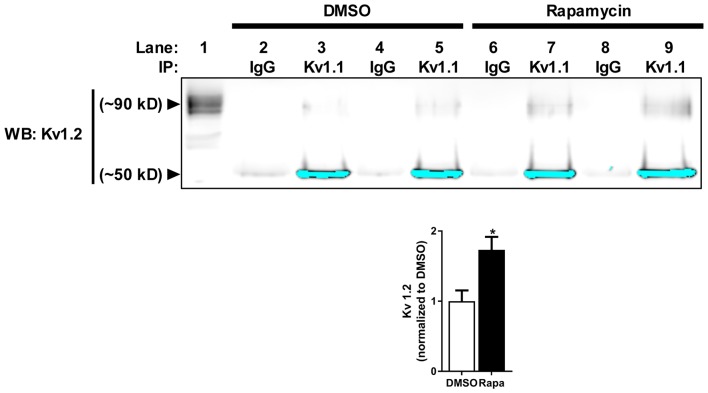
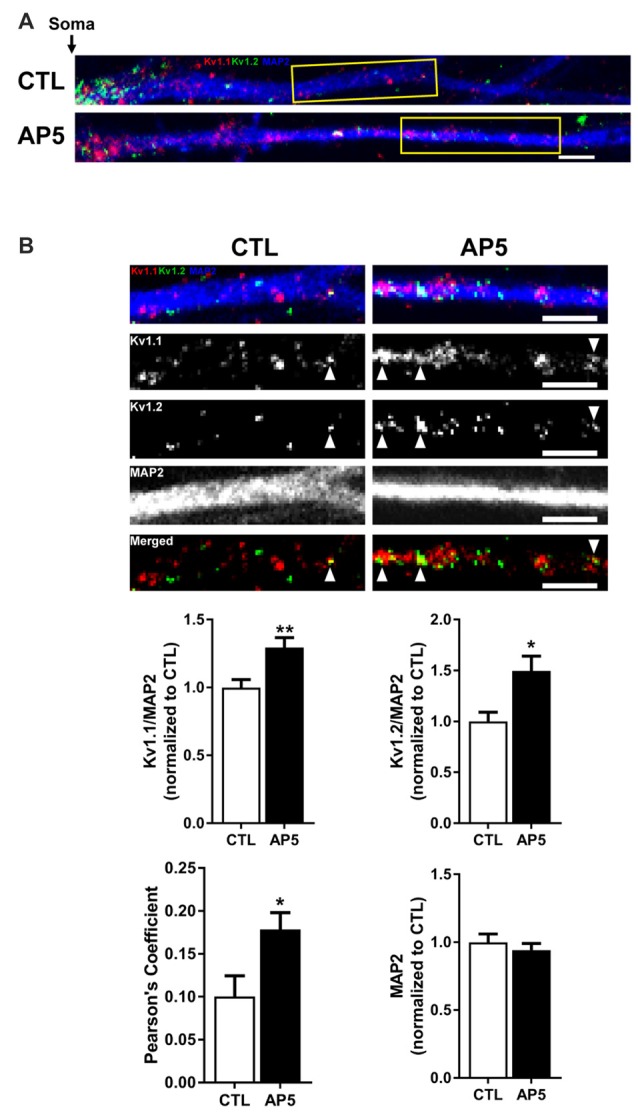
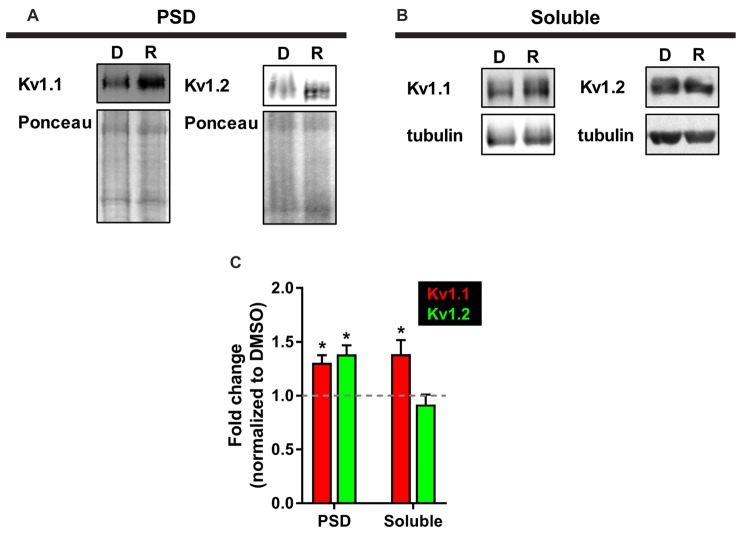
The mammalian/mechanistic target of rapamycin complex 1 (mTORC1) serves as a regulator of mRNA translation. Recent studies suggest that mTORC1 may also serve as a local, voltage sensor in the postsynaptic region of neurons. Considering biochemical, bioinformatics and imaging data, we hypothesize that the activity state of mTORC1 dynamically regulates local membrane potential by promoting and repressing protein synthesis of select mRNAs. Our hypothesis suggests that mTORC1 uses positive and negative feedback pathways, in a branch-specific manner, to maintain neuronal excitability within an optimal range. In some dendritic branches, mTORC1 activity oscillates between the "On" and "Off" states. We define this as negative feedback. In contrast, positive feedback is defined as the pathway that leads to a prolonged depolarized or hyperpolarized resting membrane potential, whereby mTORC1 activity is constitutively on or off, respectively. We propose that inactivation of mTORC1 increases the expression of voltage-gated potassium alpha (Kv1.1 and 1.2) and beta (Kvβ2) subunits, ensuring that the membrane resets to its resting membrane potential after experiencing increased synaptic activity. In turn, reduced mTORC1 activity increases the protein expression of syntaxin-1A and promotes the surface expression of the ionotropic glutamate receptor N-methyl-D-aspartate (NMDA)-type subunit 1 (GluN1) that facilitates increased calcium entry to turn mTORC1 back on. Under conditions such as learning and memory, mTORC1 activity is required to be high for longer periods of time. Thus, the arm of the pathway that promotes syntaxin-1A and Kv1 protein synthesis will be repressed. Moreover, dendritic branches that have low mTORC1 activity with increased Kv expression would balance dendrites with constitutively high mTORC1 activity, allowing for the neuron to maintain its overall activity level within an ideal operating range. Finally, such a model suggests that recruitment of more positive feedback dendritic branches within a neuron is likely to lead to neurodegenerative disorders.

Keywords: glutamate receptors; ion channels; mTOR; neurological disorders; syntaxin.


Figures

Figure 1
Figure 1
A model of mammalian/mechanistic target of rapamycin complex 1 (mTORC1)-mediated regulation of postsynaptic membrane excitability. mTORC1 regulates membrane excitability by coordinating the expression of mTORC1-On and Off proteins. (A) At steady-state, mTORC1 dynamically switches between On and Off forms in response to neuronal activity. Turning on mTORC1 (Active; ascending arrow) increases the level of syntaxin 1B (Stx1B), an mTORC1-On protein that promotes endocytosis of N-methyl-D-aspartate (NMDA) receptors (NMDARs). Removal of NMDARs reduces membrane excitability and turns off mTORC1 activity (Inactive; descending arrow). Turning off mTORC1 increases the expression of mTORC1-Off proteins, syntaxin 1A (Stx1A; bottom, left arrow) and voltage-gated potassium channel (Kv1.1, bottom, right arrow). Stx1A shuttles NMDARs to the membrane surface, which turns on mTORC1 and increases membrane excitability. Kv1.1, on the other hand, dampens synaptic input. The number of activated NMDARs at the surface, which turns on mTORC1, acts as a signal to stop Kv1.1 mRNA translation. (B) In the absence of Stx1A (or Stx1a mRNA), a positive feedback mechanism could be triggered, whereby mTORC1 remains turned off. The inability to reinsert NMDARs would further lower the membrane potential and support Kv1.1 protein synthesis, reducing the threshold for synaptic activation. (C) The absence of Stx1B (or Stx1b mRNA) could initiate another positive feedback mechanism, such that mTORC1 activity is constitutively on and the membrane remains potentiated. In postsynaptic regions that lack Stx1B, suppression of NMDAR exocytosis would cause mTORC1 to stay active and lower Kv1.1 expression. This state may be another mechanism that supports long-term potentiation.
Figure 2
Figure 2
Reduction of mTOR activity increased protein levels of potassium channels and their associated protein. Intraperitoneal (i.p.,) administration of rapamycin (Rapa; 1 mg/kg; 1 h), an mTOR inhibitor, in mice (A) reduced mTOR activity (DMSO = 1.00 ± 0.07; Rapa = 0.71 ± 0.02), but increased (B) Kv1.1 (DMSO = 1.00 ± 0.09; Rapa = 1.88 ± 0.33), (C) Kv1.2 (DMSO = 1.00 ± 0.01; Rapa = 1.21 ± 0.07), and (D) Kvβ2 (DMSO = 1.00 ± 0.01; Rapa = 1.40 ± 0.03) as measured by densitometry analysis. P-mTOR and mTOR denote phosphorylated mTOR and total mTOR, respectively. Representative images and quantification (average ± SEM) are shown. N = 4 (DMSO) and 3 (Rapa) animals. Statistics: Student’s t-test; *p < 0.05, **p < 0.01, ***p < 0.001.
Figure 3
Figure 3
Reduction of mTOR activity increases Kv1.1–1.2 association in vivo. Kv1.2 subunit co-immunoprecipitates with Kv1.1. The high molecular weight (~90 kD) Kv1.2 subunit assembles more with Kv1.1 in mice treated with rapamycin (1.73 ± 0.19) compared to DMSO (1.00 ± 0.15) as measured by densitomery analysis. IP denotes the antibody used to immunoprecipitate Kv1.1 from samples (1 mg/mL) in lanes 2–9. IgG serves as antibody control for immunoprecipiration (lanes 2, 4, 6 and 8). Kv1.2 is enriched in samples that contain Kv1.1 antibody-conjugated beads (lanes 3, 5, 7 and 9) compared to IgG-conjugated beads. The signals at ~50 kD are the low molecular Kv1.2 species and have been saturated to visualize Kv1.2 at ~90 kD. The high molecular weight is the extracellular fraction, and the low molecular is the intracellular fraction of Kv1.2 (Zhu et al., 2003). Lane 1 is the input lane, which is 1% (10 μL) of the total volume that was used to immunoprecipitate Kv1.1. Representative images and quantification (average ± SEM) are shown. N = 4 animals per condition. Statistics: Student’s t-test; *p < 0.05.
Figure 4
Figure 4
NMDA receptor blockade by AP5 elevates Kv1.1 and Kv1.2 protein in dendrites. (A) Representative dendrites starting from the edge of the soma (indicated by the black arrow) of dissociated hippocampal neurons treated with (top) water (CTL; control) or (bottom) AP5, an NMDA receptor blocker. The dendrites were immunostained with antibodies against Kv1.1 (red), Kv1.2 (green) and the dendritic marker MAP2 (blue). Dendrites outlined in yellow are magnified in (B). (B, Top) Kv1.1, Kv1.2 and MAP2 expression were measured in distal dendrites (at least 20 μm from the soma). White arrowhead indicates colocalized Kv1.1 and Kv1.2 signals. The bottom panel of dendrites show the merged Kv1.1 and Kv1.2 immunostaining. Colocalized Kv1.1 and Kv1.2 signals appear yellow and are quantified by Pearson’s Coefficient. (Below) Quantification (average ± SEM) of fluorescent signal normalized by MAP2 signal indicating more Kv1.1 and Kv1.2 in NMDA receptor blocker AP5 compared to control (CTL). Kv1.1 (CTL = 1.00 ± 0.06, N = 24 dendrites; AP5 = 1.29 ± 0.07, N = 30 dendrites). Kv1.2 (CTL = 1.00 ± 0.09, N = 11 dendrites; AP5 = 1.50 ± 0.15, N = 16 dendrites). MAP2 (CTL = 1.00 ± 0.06; AP5 = 0.94 ± 0.05). NMDA receptor blockade increases colocalization of Kv1.1 and Kv1.2 proteins (CTL = 0.10 ± 0.02, N = 18 dendrites; AP5 = 0.18 ± 0.02, N = 21 dendrites) Statistics: Student’s t-test; *p < 0.05, **p < 0.01.
Figure 5
Figure 5
More Kv1.1 and Kv1.2 cofractionate in the PSD with mTORC1 inhibition in vivo. (A) Representative Western blots depicting increased levels of Kv1.1 and Kv1.2 in the PSD fraction (Triton X-100 insoluble) of synaptoneurosomes with mTORC1 inhibition by rapamycin (R). DMSO (D) served as control. Total protein as measured by densitometry of Ponceau-S staining was used to normalize Kv1.1 and Kv1.2 protein expression. (B) In the soluble fraction (Triton X-100 soluble) of synaptoneurosomes, only Kv1.1 protein was increased with rapamycin. Tubulin was used to normalize Kv1.1 and Kv1.2 protein levels. (C) Quantification (average ± SEM) is expressed as densitometric ratio between protein values in rapamycin-treated and DMSO-treated rats. Kv1.1 (PSD = 1.31 ± 0.07; Soluble = 1.39 ± 0.13). Kv1.2 (PSD = 1.39 ± 0.08; Soluble = 0.92 ± 0.09). N = 3 animals per condition. Statistics: Student’s t-test; *p < 0.05.

Similar articles

Cited by

References

    1. Anderson M. P. (2010). Arrested glutamatergic synapse development in human partial epilepsy. Epilepsy Curr. 10, 153–158. 10.1111/j.1535-7511.2010.01386.x - DOI - PMC - PubMed
    1. Antic S. D., Zhou W. L., Moore A. R., Short S. M., Ikonomu K. D. (2010). The decade of the dendritic NMDA spike. J. Neurosci. Res. 88, 2991–3001. 10.1002/jnr.22444 - DOI - PMC - PubMed
    1. Antion M. D., Hou L., Wong H., Hoeffer C. A., Klann E. (2008). mGluR-dependent long-term depression is associated with increased phosphorylation of S6 and synthesis of elongation factor 1A but remains expressed in S6K-deficient mice. Mol. Cell. Biol. 28, 2996–3007. 10.1128/MCB.00201-08 - DOI - PMC - PubMed
    1. Auerbach B. D., Osterweil E. K., Bear M. F. (2011). Mutations causing syndromic autism define an axis of synaptic pathophysiology. Nature 480, 63–68. 10.1038/nature10658 - DOI - PMC - PubMed
    1. Barria A., Malinow R. (2002). Subunit-specific NMDA receptor trafficking to synapses. Neuron 35, 345–353. 10.1016/s0896-6273(02)00776-6 - DOI - PubMed

LinkOut - more resources