. 2017 May 30:11:98.
doi: 10.3389/fnbeh.2017.00098. eCollection 2017.

Different Roles for Honey Bee Mushroom Bodies and Central Complex in Visual Learning of Colored Lights in an Aversive Conditioning Assay

Affiliations

Different Roles for Honey Bee Mushroom Bodies and Central Complex in Visual Learning of Colored Lights in an Aversive Conditioning Assay

Jenny A Plath et al. Front Behav Neurosci. .

Abstract

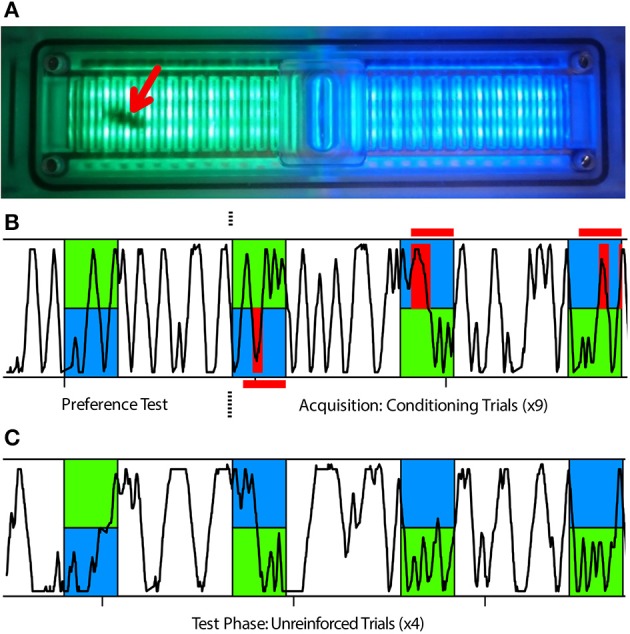
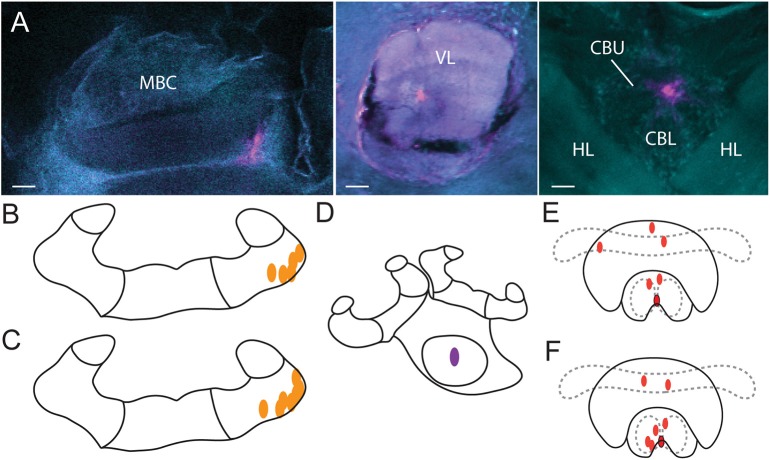
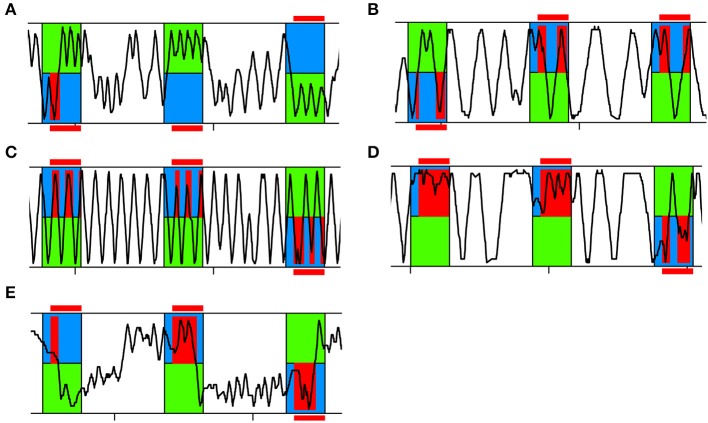
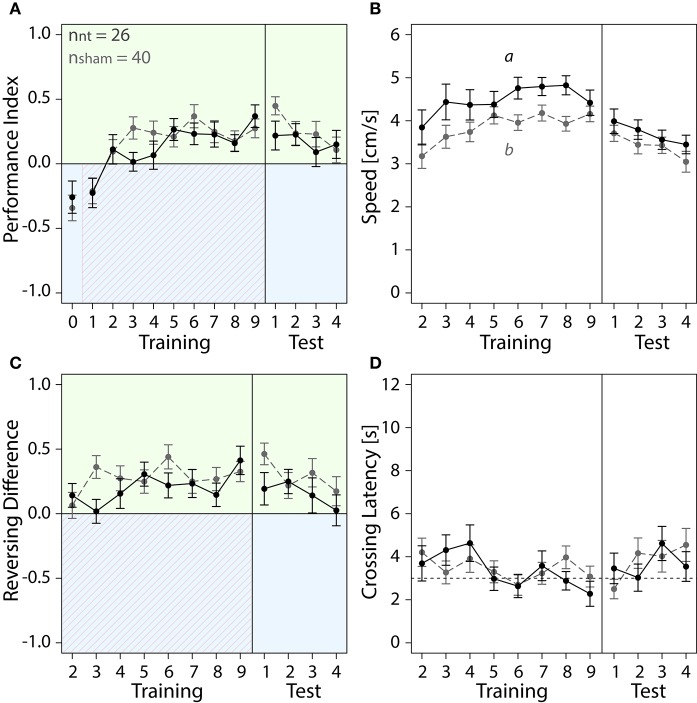
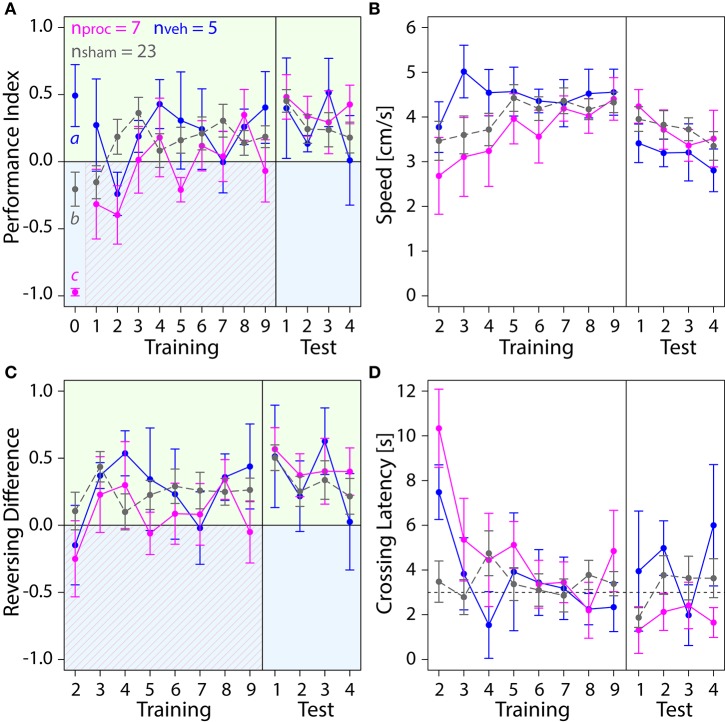
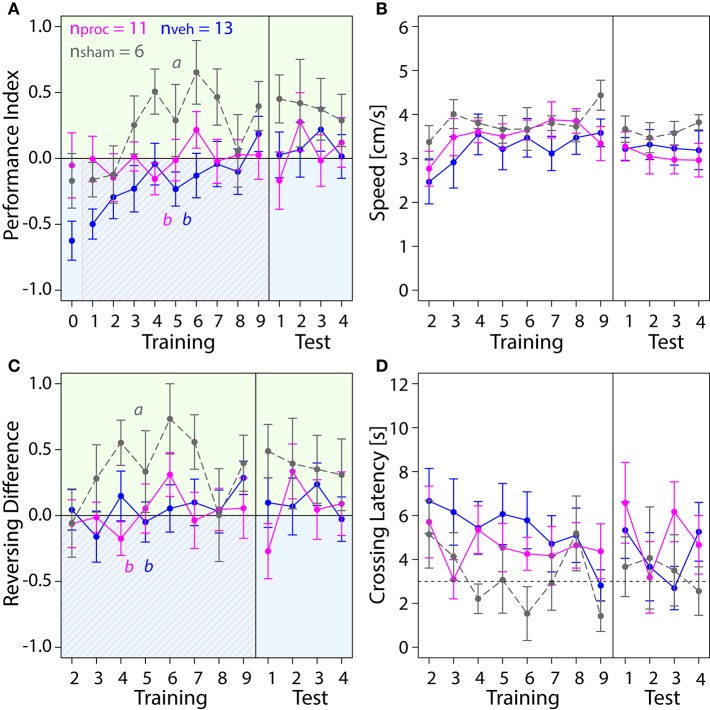
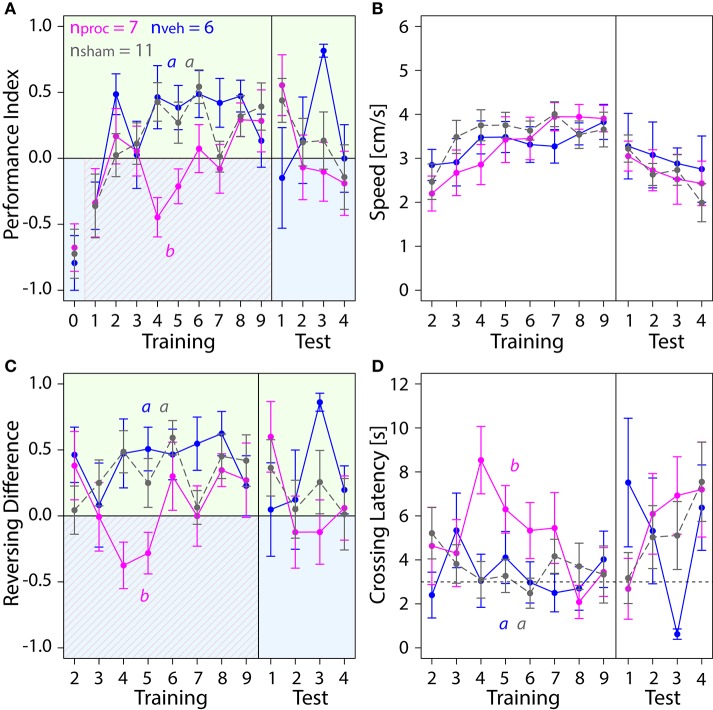
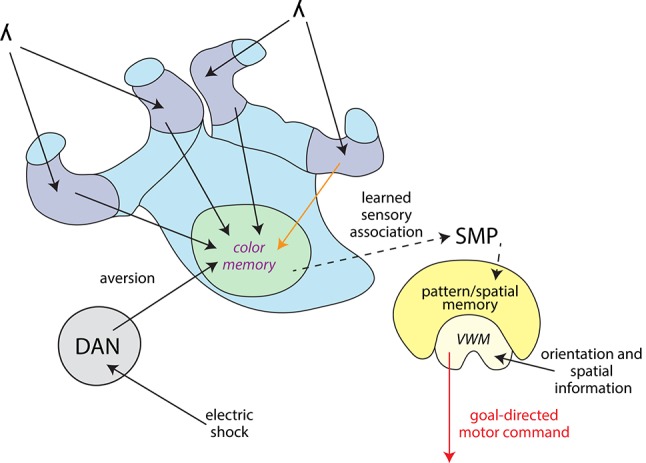
The honey bee is an excellent visual learner, but we know little about how and why it performs so well, or how visual information is learned by the bee brain. Here we examined the different roles of two key integrative regions of the brain in visual learning: the mushroom bodies and the central complex. We tested bees' learning performance in a new assay of color learning that used electric shock as punishment. In this assay a light field was paired with electric shock. The other half of the conditioning chamber was illuminated with light of a different wavelength and not paired with shocks. The unrestrained bee could run away from the light stimulus and thereby associate one wavelength with punishment, and the other with safety. We compared learning performance of bees in which either the central complex or mushroom bodies had been transiently inactivated by microinjection of the reversible anesthetic procaine. Control bees learned to escape the shock-paired light field and to spend more time in the safe light field after a few trials. When ventral lobe neurons of the mushroom bodies were silenced, bees were no longer able to associate one light field with shock. By contrast, silencing of one collar region of the mushroom body calyx did not alter behavior in the learning assay in comparison to control treatment. Bees with silenced central complex neurons did not leave the shock-paired light field in the middle trials of training, even after a few seconds of being shocked. We discussed how mushroom bodies and the central complex both contribute to aversive visual learning with an operant component.

Keywords: central complex; honey bees; mushroom bodies; operant learning; procaine; visual learning.


Figures

Figure 1
Figure 1
APIS learning assay used in this study. (A) The APIS chamber can be illuminated with two different light fields of varying wavelengths and intensities; in this case light appearing green to humans and light appearing blue to humans. The chamber is equipped with an electrifiable grid to deliver 10 V shocks to the bee's feet and with infrared sensors to automatically track the bee's movement. A bee in the chamber (red arrow) could only move in a straight line, either toward or away from a stimulus, and turns were scored as a reversal of direction as detected by the infrared sensors. (B,C) Typical running trace of a bee in the chamber. Blue and green indicate illumination wavelength and red indicates when shocks were available (red horizontal bars) or delivered (red vertical bars) to the bee. Blue light was always illuminating the half of the chamber in which the bee was located at light-onset. (B) After an acclimatization period of 15 min post-injection, the bee was exposed to 14 s of both green and blue illumination as a preference test. The bee was then subjected to nine conditioning trials in which, after 3 s of illumination, the bee experienced shocks on the blue side for another 11 s, but not on the green side. (C) Subsequently, the bee was tested four times with 14 s of illumination without shocks to determine the post-training response to blue and green light fields.
Figure 2
Figure 2
Injection sites. (A) Alexa dye injections are shown in magenta (false color) in the MBC (left), VL (middle) and the CX (right). A DAPI-counterstain and auto-fluorescence of the brain tissue (false colored in cyan) allowed us to identify brain neuropils. Orientation of all three scans was aligned with rostral (neuraxis) facing upwards. Injections of vehicle (B) and of procaine solution (C) into the MBC as identified by the CLSM scans. Injections into the VL (D) were identified visually with fluorescent light and were all located in the center. Injections of vehicle (E) and of procaine solution (F) into the central body (red dots) and injections located at the border of the lower division of the central body with spread into the noduli (red dots with black border). MBC, mushroom body calyces; VL, ventral lobes; HL, horizontal lobes; CBU, upper division of the central body; CBL lower division of the central body; Scale bar = 30 μm.
Figure 3
Figure 3
Representative running traces of individual bees in APIS. Three training trials are shown. The bee was exposed to 14 s of blue and green light fields. After a 3 s delay the bee experienced shock when located on the blue side (red). (A) Typical running trace of a bee spending more time on the green side than on the blue side, thus achieving high Performance Indices (PIs). (B) Typical running trace of a bee spending more time on the blue side than on the green side, thus achieving low PIs. (C) Typical running trace of a bee with an equal number of reversals on the green and blue side, thus achieving a Reversing Difference close to zero. (D) Representative running trace of a bee reversing more often on the blue side than on the green side, thus achieving a negative Reversing Difference. (E) Typical running trace of a slowly responding bee taking a long time to cross over to the green side at the beginning of each trial and after light-onset, thus achieving a high Crossing Latency.
Figure 4
Figure 4
With training, bees of sham and NT control groups learned to spend more time on the safe green side than the shocked blue side. Means ± SEM are plotted for all variables. Non-treated animals (NT) are shown in black, sham-treated animals (sham) in gray. No effect of the different injection methods used for the different regions on any of the four variables shown was found (ANOVA, p > 0.05). Sham-treated animals were therefore pooled into one group to compare with NT animals. Significant treatment effects determined with an LMM (p < 0.05, Table S1) are indicated with letters a and b. Bees were subjected to one preference test (0) nine training trials and four test trials. Control animals spent more time on the green side and avoided the shock-paired blue side (shocked period indicated by red diagonal lines) after a few trials. (A) No effect of treatment on Performance Index was found in training or in the test phase (Table S1). (B) An LMM indicated a significant effect of treatment on speed (Table S1). After one conditioning trial, speed was lower in sham-treated animals than in NT-animals in the training (post-hoc Tukey HSD, z = −2.188, p = 0.03), but no significant effect of treatment on speed was found in the test phase (Table S1) (C) Number of reversals on the green side was higher after one conditioning trial. No significant effect of treatment was found in training or in the test phase (Table S1). (D) Crossing Latency approached the 3-s threshold (horizontal dashed line) over the course of training, which corresponds to the delay between light-onset and shock-onset. (A) No significant effect of treatment on Crossing Latency was found for training or in the test phase (Table S1).
Figure 5
Figure 5
Comparison of behavior in the APIS assay for bees injected with the vehicle (blue) or procaine solution (magenta) into the MBC, or sham-treated bees (gray). All groups learned to spend more time on the green side. Means ± SEM are plotted for all variables. Significant treatment effects determined with an LMM (p < 0.05, Table S1) are indicated with letters a, b, and c. Bees were subjected to one preference test (0) nine training trials and four test trials. (A) An LMM indicated an effect of treatment on Performance Index (PI) in the preference test (Table S1). Treatment comparison with a Tukey HSD post-hoc test revealed differences in PIs of vehicle and sham groups (z = 2.631, p = 0.02), PIs of procaine and sham groups (z = −3.310, p = 0.003) and PIs of procaine and vehicle groups (z = −4.657, p < 0.001). An LMM indicated a significant difference between PIs of procaine and sham groups in training (Table S1), but a Tukey post-hoc test, which corrects for multiple testing indicated no difference between PIs of these groups (z = 2.080, p = 0.09). No effect of treatment on PIs was found for the test phase (LMM, Table S1). All bees spent more time on the green side and avoided the shock-paired blue side (shocks indicated by diagonal lines) after a few trials. (B) Speed did not differ between experimental groups (LMM, Table S1). (C) Number of reversals on the green side was higher after one conditioning trial. No effect of treatment on Reversing Differences was found in training or in the test phase (Table S1). (D) Crossing Latency approached the 3-s threshold (horizontal dashed line) over the course of training, which corresponds to the delay between light-onset and shock-onset. No significant effect of treatment on Crossing Latency was found for training or in the test phase (Table S1).
Figure 6
Figure 6
Comparison of behavior in APIS for bees injected with vehicle (blue) or procaine solution (magenta) into the VLs, or sham-treated bees (gray). Learning to differentiate the shock-paired blue side and the safe green side was impaired in procaine and vehicle groups. Means ± SEM are plotted for all variables. Significant treatment effects determined with an LMM (p < 0.05) are indicated with letters a and b. Bees were subjected to one preference test (0) nine training trials and four test trials. (A) An LMM indicated an effect of treatment on Performance Index (PI) in the training but not in the test phase (Table S1). Treatment comparison with a Tukey HSD post-hoc test showed differences in PIs of vehicle and sham groups (z = −4.217, p < 0.001) and PIs of procaine and sham groups (z = −2.638, p = 0.02). (B) Speed did not differ between experimental groups (LMM, Table S1). (C) Reversing Differences were affected by treatment in the training but not in the test phase (LMM, Table S1). Treatment comparison with a Tukey HSD post-hoc test showed differences in Reversing Difference of vehicle and sham groups (z = −3.107, p = 0.005) and Revering Differences of procaine and sham groups (z = −3.567, p = 0.001). (D) Crossing Latency approached the 3-s threshold (horizontal dashed line) over the course of training, which corresponds to the delay between light-onset and shock-onset. No significant effect of treatment on Crossing Latency was found for training or in the test phase (Table S1).
Figure 7
Figure 7
Comparison of behavior in APIS for bees injected with vehicle (blue) or procaine solution (magenta) into the CX, or sham-treated bees (gray). Bees injected with procaine into the CX did not run away from the shock-paired blue side. Means ± SEM are plotted for all variables. Significant treatment effects determined with an LMM (p < 0.05, Table S1) are indicated with letters a and b. Bees were subjected to one preference test (0) nine training trials and four test trials. (A) Performance Indices (PIs) were affected by treatment in the training but not in the test phase (LMM, Table S1). Treatment comparison with a Tukey HSD post-hoc test showed differences in PIs of procaine and sham groups (z = −2.512, p = 0.03) and PIs of procaine and vehicle groups (z = −3.052, p = 0.006). (B) Speed did not differ between experimental groups (LMM, Table S1). (C) An LMM indicated an effect of treatment on Reversing Differences in the training but not in the test phase (Table S1). Treatment comparison with a Tukey HSD post-hoc test revealed differences in Reversing Difference of procaine and sham groups (z = −2.629, p = 0.02) and Reversing Differences of procaine and vehicle groups (z = −2.995, p = 0.008). (D) In vehicle and sham groups Crossing Latency approached the 3-s threshold (horizontal dashed line) over the course of training, which corresponds to the delay between light-onset and shock-onset. An LMM revealed an effect of treatment on Crossing Latency in the training but not in the test phase (Table S1). Treatment comparison with a Tukey HSD post-hoc test showed differences in Crossing Latencies of procaine and sham groups (z = 2.467, p = 0.04) and Crossing Latencies of procaine and vehicle groups (z = 2.532, p = 0.03).
Figure 8
Figure 8
Information flow model for differential color learning in a binary choice assay. Information about the light wavelength (λ) enters the collar region (dark blue) of the MBC from the optic neuropils. Visual information is passed on from the collar region to the VL (light green) via Kenyon cells. This process was partially disrupted by a procaine injection into one collar region (orange arrow). Electric shock information is passed on from the ventral nerve cord to dopaminergic neurons (DAN, gray) which modulate MB output. In the VL wavelength information is associated with aversion and most likely color memories are formed here. This process was disrupted by procaine-injections into the VL (marked in purple). Information about the learned sensory association might be passed on indirectly to the CX (yellow) via the superior medial protocerebrum (SMP). The CX receives orientation and spatial information and processes how the animal is orientated in relation to its environment using visual working memory (VWM). The CX initiates a goal-directed motor response, possibly modified in regards to the learned sensory association. This process was disrupted by procaine-injections into the CX (red arrow).

References

    1. Balamurali G. S., Somanathan H., Hempel de Ibarra N. (2015). Motion cues improve the performance of harnessed bees in a colour learning task. J. Comp. Physiol. A Neuroethol. Sens. Neural Behav. Physiol. 201, 505–511. 10.1007/s00359-015-0994-7 - DOI - PubMed
    1. Barron A. B., Gurney K. N., Meah L. F., Vasilaki E., Marshall J. A. (2015). Decision-making and action selection in insects: inspiration from vertebrate-based theories. Front. Behav. Neurosci. 9:216. 10.3389/fnbeh.2015.00216 - DOI - PMC - PubMed
    1. Barron A. B., Klein C. (2016). What insects can tell us about the origins of consciousness. Proc. Natl. Acad. Sci. U.S.A. 113, 4900–4908. 10.1073/pnas.1520084113 - DOI - PMC - PubMed
    1. Bates D., Maechler M., Bolker B., Walker S. (2015). Fitting linear mixed-effects models using lme4. J. Stat. Softw. 67, 1–48. 10.18637/jss.v067.i01 - DOI
    1. Bitterman M. E., Menzel R., Fietz A., Schafer S. (1983). Classical conditioning of proboscis extension in honeybees (Apis mellifera). J. Comp. Psychol. 97, 107–119. 10.1037/0735-7036.97.2.107 - DOI - PubMed

LinkOut - more resources