. 2017 May 29:11:45.
doi: 10.3389/fncom.2017.00045. eCollection 2017.

Hammering Does Not Fit Fitts' Law

Affiliations

Hammering Does Not Fit Fitts' Law

Tadej Petrič et al. Front Comput Neurosci. .

Abstract

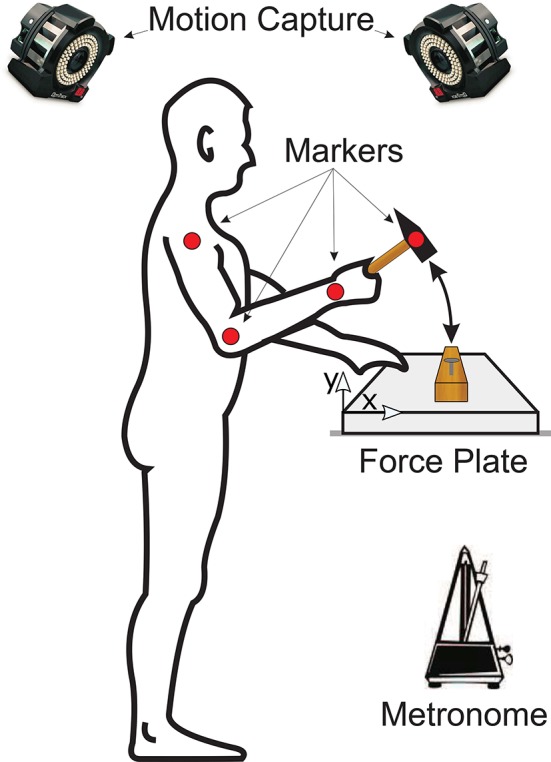
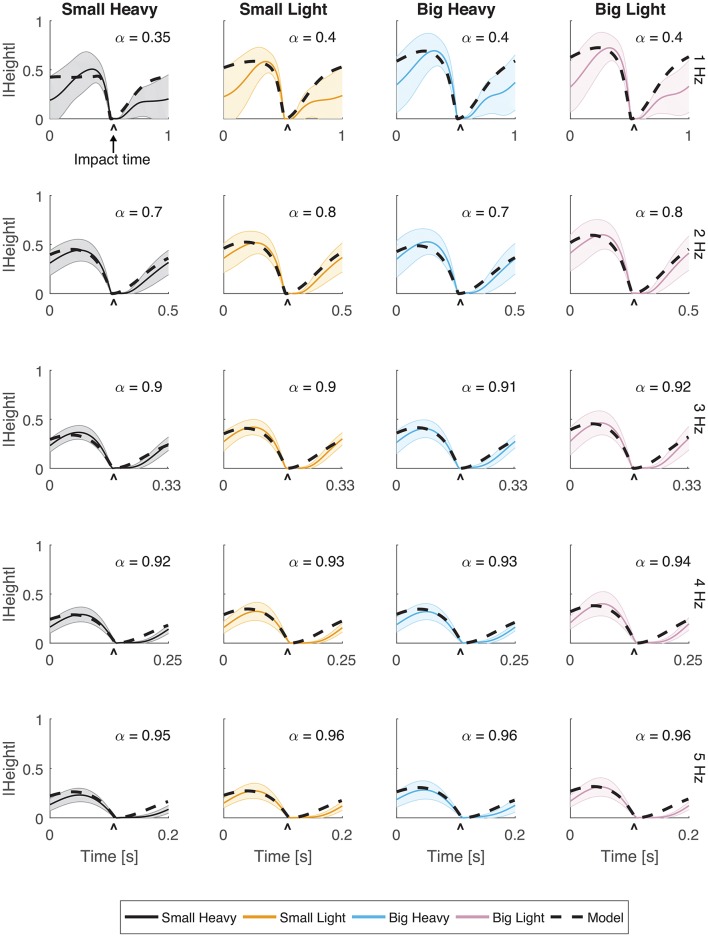
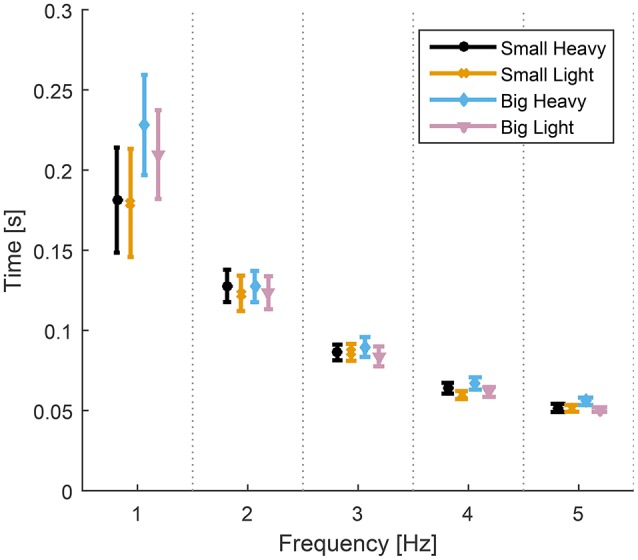
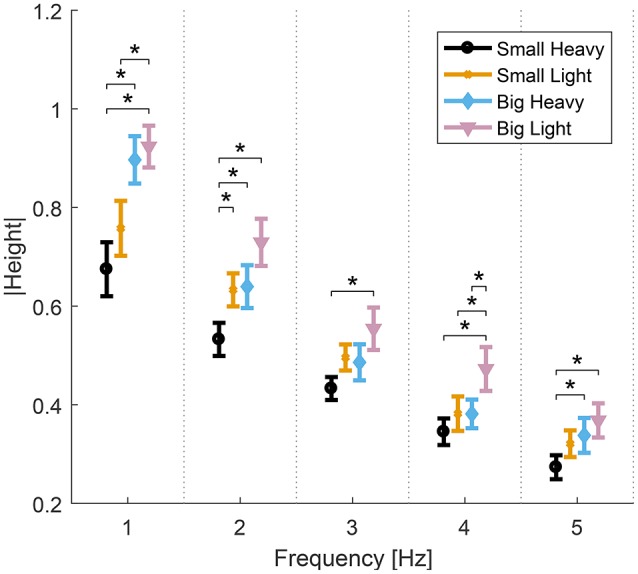
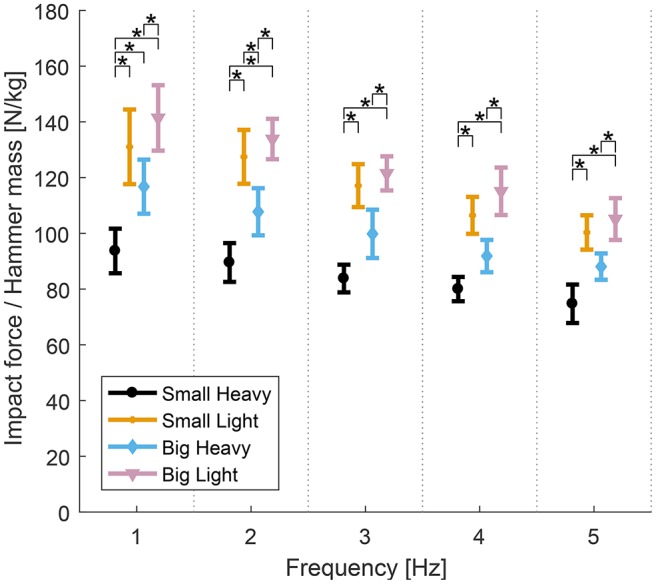
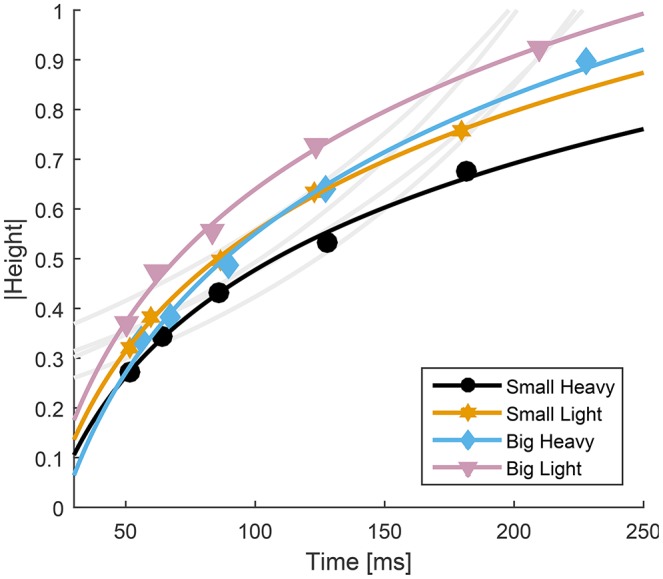
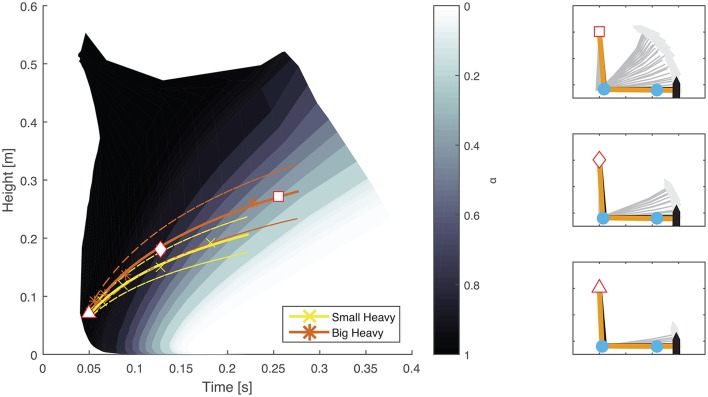
While movement is essential to human wellbeing, we are still unable to reproduce the deftness and robustness of human movement in automatons or completely restore function to individuals with many types of motor impairment. To better understand how the human nervous system plans and controls movements, neuromechanists employ simple tasks such as upper extremity reaches and isometric force tasks. However, these simple tasks rarely consider impacts and may not capture aspects of motor control that arise from real-world complexity. Here we compared existing models of motor control with the results of a periodic targeted impact task extended from Bernstein's seminal work: hammering a nail into wood. We recorded impact forces and kinematics from 10 subjects hammering at different frequencies and with hammers with different physical properties (mass and face area). We found few statistical differences in most measures between different types of hammer, demonstrating human robustness to minor changes in dynamics. Because human motor control is thought to obey optimality principles, we also developed a feedforward optimal simulation with a neuromechanically inspired cost function that reproduces the experimental data. However, Fitts' Law, which relates movement time to distance traveled and target size, did not match our experimental data. We therefore propose a new model in which the distance moved is a logarithmic function of the time to move that yields better results (R2 ≥ 0.99 compared to R2 ≥ 0.88). These results support the argument that humans control movement in an optimal way, but suggest that Fitts' Law may not generalize to periodic impact tasks.

Keywords: Fitts' Law; arm movement; biomechanics; impact; motor control; optimal control; upper extremity.


Figures

Figure 1
Figure 1
Experimental setup of the study. Each subject was asked to stand in front of a table on top of which a wooden board was placed on a force plate. Subjects were given one of four differently sized and weighted hammers at random and asked to drive a nail into the wooden board. The hammering frequency was controlled by asking each subject to match their hammer strikes with the clicks of a metronome. The forces on the wooden board were recorded by the force plate and the kinematic motion of the subjects' arms and of the hammer were recorded using an optical motion capture system.
Figure 2
Figure 2
Vertical movement for all hammers and frequencies. The normalized vertical position of the hammer head was plotted with respect to time. Solid lines indicate the average trajectory while shading represents standard error. The black dashed line indicates the optimal behavior of the model using an estimated α parameter for frequencies 1, 2, 3, 4, and 5 Hz. The root mean squared error (RMSE) of the model for each case has a root mean squared error of RMSE < 0.1.
Figure 3
Figure 3
Speeds for all hammers and frequencies. The speed (magnitude of the velocity vector) of the hammer head was plotted with respect to time. Solid lines indicate the average speeds while shading represents standard deviation. The black dashed line indicates the optimal behavior of the model using an estimated α parameter for frequencies 1, 2, 3, 4, and 5 Hz. The root mean squared error (RMSE) of the model for each case has a root mean squared error of RMSE < 0.1 m/s.
Figure 4
Figure 4
Means and standard errors (SEM) of time to impact for all hammers and frequencies. The time from maximal height to impact was statistically the same for all hammers at each hammering frequency despite some statistically different maximal heights (Figure 5). The time to impact decreases and becomes less variable as the hammering frequency increases.
Figure 5
Figure 5
Means and standard errors (SEM) of the normalized maximal height of all hammers and frequencies. The normalized vertical height of the hammer head decreases as hammering frequency increases. Big Light and Small Heavy maximal heights were statistically different from any of the others (*p < 0.05).
Figure 6
Figure 6
Means and standard errors (SEM) of the normalized maximal impact forces for all hammers and frequencies. Impact forces normalized by hammer mass varied between hammers. The heavy hammers generally had lower impact forces per unit mass than the lighter hammers across hammering frequencies. The Small Heavy hammer had the lowest normalized impact forces across conditions. The Big Light hammer produced the highest normalized impact forces, though the Big Heavy hammer produced the largest absolute impact forces. The Small Light and Big Heavy hammers were similar with statistical differences only found at 2 Hz (*p < 0.05).
Figure 7
Figure 7
Relationship between time to impact and maximal height for all four hammers. The average normalized height was plotted with respect to average time to impact for each hammer. Fitts' Law was fit to the experimental data and overlayed on the experimental data (gray curves, R2 ≥ 0.88, RMSE ≤ 0.24). Because Fitts' Law appears to have opposite curvature to the experimental data, a modified model was developed (Equation 4) and overlayed on the experimental results (colored traces, R2 ≥ 0.99, RMSE ≤ 0.02).
Figure 8
Figure 8
Comparison between experimental results and constant contours of α. A map showing the maximal height attained and time to impact generated using constant values of α (Equation 3) was overlayed on experimental results from two different hammers. Solid colored lines (yellow and orange) indicate mean experimental results while dashed lines indicate the standard error. A direct comparison shows that subjects emphasize effort conservation (low values of α) at low hammering frequencies (greater time between impacts) and energy transfer to the nail (high values of α) at high hammering frequencies (less time between impacts) rather than a constant relationship for all hammering speeds. The plots on the right hand side show examples of arm trajectories using different values of α. The specific values used are marked on the left hand plot by a white square, rhombus, and triangle for the top, middle, and bottom plots, respectively.

References

    1. Adam J. J., Mol R., Pratt J., Fischer M. H. (2006). Moving farther but faster: an exception to fitts's law. Psychol. Sci. 17, 794–798. 10.1111/j.1467-9280.2006.01784.x - DOI - PubMed
    1. Anderson F. C., Pandy M. G. (1999). A dynamic optimization solution for vertical jumping in three dimensions. Comput. Methods Biomech. Biomed. Eng. 2, 201–231. 10.1080/10255849908907988 - DOI - PubMed
    1. Anderson F. C., Pandy M. G. (2001). Dynamic optimization of human walking. J. Biomech. Eng. 123:381. 10.1115/1.1392310 - DOI - PubMed
    1. Arnold A. S., Anderson F. C., Pandy M. G., Delp S. L. (2005). Muscular contributions to hip and knee extension during the single limb stance phase of normal gait: a framework for investigating the causes of crouch gait. J. Biomech. 38, 2181–2189. 10.1016/j.jbiomech.2004.09.036 - DOI - PubMed
    1. Berardelli A., Hallett M., Rothwell J. C., Agostino R., Manfredi M., Thompson P. D., et al. . (1996). Single-joint rapid arm movements in normal subjects and in patients with motor disorders. Brain 119(Pt 2), 661–674. 10.1093/brain/119.2.661 - DOI - PubMed

LinkOut - more resources