. 2017 May 30:8:912.
doi: 10.3389/fmicb.2017.00912. eCollection 2017.

Copper Resistance in Aspergillus nidulans Relies on the PI-Type ATPase CrpA, Regulated by the Transcription Factor AceA

Affiliations

Copper Resistance in Aspergillus nidulans Relies on the PI-Type ATPase CrpA, Regulated by the Transcription Factor AceA

Martzel Antsotegi-Uskola et al. Front Microbiol. .

Abstract

Copper homeostasis has been extensively studied in mammals, bacteria, and yeast, but it has not been well-documented in filamentous fungi. In this report, we investigated the basis of copper tolerance in the model fungus Aspergillus nidulans. Three genes involved in copper homeostasis have been characterized. First, crpA the A. nidulans ortholog of Candida albicans CaCRP1 gene encoding a PI-type ATPase was identified. The phenotype of crpA deletion led to a severe sensitivity to Cu+2 toxicity and a characteristic morphological growth defect in the presence of high copper concentration. CrpA displayed some promiscuity regarding metal species response. The expression pattern of crpA showed an initial strong elevation of mRNA and a low continuous gene expression in response to long term toxic copper levels. Coinciding with maximum protein expression level, CrpA was localized close to the cellular surface, however protein distribution across diverse organelles suggests a complex regulated trafficking process. Secondly, aceA gene, encoding a transcription factor was identified and deleted, resulting in an even more extreme copper sensitivity than the ΔcrpA mutant. Protein expression assays corroborated that AceA was necessary for metal inducible expression of CrpA, but not CrdA, a putative metallothionein the function of which has yet to be elucidated.

Keywords: Aspergillus nidulans; PI-type ATPase; copper homeostasis; copper resistance; metallothionein; transcription factor.


Figures

Figure 1
Figure 1
Sequence analysis of CrpA and CrdA. (A) Proposed two dimensional model of CrpA describing the predicted membrane topology and comparison of the conserved functional domains of PI-type ATPases and their position among different species. GenBank accession numbers are given in parentheses: Aspergillus nidulans CrpA (CBF83376.1) and YgA (CBF75750.1); Candida albicans CaCrp1p (AAF78958.1) and CaCcc2p (XP_720761.1); Saccharomyces cerevisieae ScCcc2p (AAC37425.1); Homo sapiens Menkes disease protein hATP7A (AAA35580.1); Escherichia coli EcCopA (CDL39203.1); Enterococcus hirae EhCopA (AAA61835.1); Legionella pneumophila copper-translocating P-type ATPase (WP_010947353.1); Archaeoglobus fulgidus copper-exporting P-type ATPase AfCopA (KUJ93751.1). (B) Alignment of predicted full-length of CrdA and CaCrd2p sequences compared using Clustal method. Asterisks describe identical, double and single dots, conservative and semi-conservative residues, respectively. CxC repeats are boxed in light blue. Protein accession numbers are reported as follows: Aspergillus nidulans CrdA (CBF79264.1) and Candida albicans CaCrd2p (AAF78959.1).
Figure 2
Figure 2
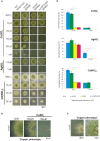
Phenotypic analysis of crpA and crdA mutant strains. Spores of strains having the indicated relevant genotypes were point-inoculated on standard MMA. Images of colonies were taken after 2 days of incubation at 37°C. (A) Mutant characterization in solid medium supplemented with indicated concentrations of metal salts (B) Close-up views of the morphological colony alterations in the central region of the colony caused by the deletion of crpA when exposed to 100 μM CuSO4, denominated “Copper phenotype.” At 150 μM CuSO4 isolated hyphae were observed (magenta dotted line). (C) Recovery of cellular growth in the central region of the colony over the time (magenta lines). Images of colonies were taken after 36 and 72 h of incubation. (D) Cellular growth in liquid MMA was monitored by determining the dry weight (biomass) of cells grown 24 h at 37°C with the indicated concentrations of metal salts. In order to facilitate data comparison growth of each strain at basal level (no stress) was designated 100%, data was normalized and presented as percentages. Graphs show the means ± standard deviation (SD) of triplicate experiments (n = 3). *Significant growth reduction p < 0.05.
Figure 3
Figure 3
CrpA-HA3 and CrdA-HA3 induction by heavy metal ions. (A) Copper sensibility assay of tagged CrpA and CrdA mutant strains. (B) Northern blot and Western blot showing changes in crpA-HA3 transcript and CrpA-HA3 expression levels after addition of 100 μM of CuSO4 and monitored at the indicated times. Images correspond to the area of interest. (C) The graph shows crpA-HA3 transcript and CrpA-HA3 protein expressions relative to the corresponding loading controls, rRNA and hexokinase respectively. Average pixel intensity for each band was calculated with Image J (version 4.0; Fujifilm, Valhalla, NY). (D) Comparison of CrpA-HA3 induction pattern by different metal salts [100 μM CuSO4, 2.5 μM AgNO3, and 250 μM Cd(NO3)2]. Images correspond to the area of interest. (E) Northern blot showing changes in crpA expression after addition of 100 μM of CuSO4 but not during 1 h treatment with 250 μM of Cd(NO3)2. (F) Western blot comparing Cd-induced CrpA-HA3 expression after 50 μM and 250 μM of Cd(NO3)2 addition. Western blot showing changes in HA3 tagged version of CrdA in a wild-type (G) and null crpA (H) background induced by different metal ions.
Figure 4
Figure 4
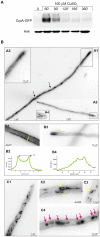
Effect of copper in intracellular localization of CrpA-GFP. (A) Western blot confirming CrpA-GFP normal expression kinetics after addition of 100 μM of CuSO4 (B) Cells of a strain expressing a CrpA–GFP fusion were grown in selective medium for microscopy for 16 h at 25°C and shifted to medium containing 100 μM CuSO4 for the indicated times. Images taken 30 min after the shift. (A1,A2) CrpA localized in a network of strands and tubules. (A3,A4) Images corresponds to the rectangular region indicated in (A1,A3) showing a magnification of the tip region. (B1–B4) Images corresponding to 1 h after the shift. GFP fluorescence was accumulated predominately in the PM (B1) and polarized in the tip region (B3). Panels (B2,B4) corresponds to the line scans of CrpA-GFP signal across the indicated lines. (C1–C4) Images taken 2–3 h after shifting. Panels (C1,C2,C3) are examples of ring-shaped structures (yellow arrowheads) and (C4) of abnormal aggregates (magenta arrows). Images were treated with sharp filter, shown in inverted gray contrast and represent average intensity projections of z-stacks.
Figure 5
Figure 5
Functional analysis of AceA. (A) Multiple alignment of the most conserved region, N-terminal half, of AceA, YlCrf1p, ScAce1p, and CgAmt1p, which contains the majority of cysteine residues arranged in clusters (indicated in light blue boxes). Protein alignments were performed using Clustal Omega. Genebank protein accesion numbers are as follows: A. nidulans AceA (CBF85835.1), Y. lipolytica YlCrf1p (XP_500631.1), S. cerevisiae ScAce1p (CAA96877.1), and C. glabrata CgAmt1p (XP_447430.1). (B) ΔaceA mutant characterization in solid medium supplemented with indicated concentrations of CuSO4, AgNO3, and Cd(NO3)2. (C) Biomass measurement of WT, ΔaceA and ΔcrpA strains grown at indicated conditions. Data was normalized and presented as percentages. Bars indicate means and error bars standard deviation. N = 3. Western blot showing (D) CrpA-HA3 and (E) CrdA-HA3 induction by heavy metal ions in a null aceA background strain. Hexokinase and CrpA-HA3 sample of cells treated for 1 h with copper were used as controls. *Significant growth reduction p < 0.05.

References

    1. Balamurugan K., Schaffner W. (2006). Copper homeostasis in eukaryotes: teetering on a tightrope. Biochim. Biophys. Acta 1763, 737–746. 10.1016/j.bbamcr.2006.05.001 - DOI - PubMed
    1. Barry A. N., Shinde U., Lutsenko S. (2010). Structural organization of human Cu-transporting ATPases: learning from building blocks. J. Biol. Inorg. Chem. 15, 47–59. 10.1007/s00775-009-0595-4 - DOI - PubMed
    1. Blindauer C. A., Leszczyszyn O. I. (2010). Metallothioneins: unparalleled diversity in structures and functions for metal ion homeostasis and more. Nat. Prod. Rep. 27, 720–741. 10.1039/b906685n - DOI - PubMed
    1. Bradford M. M. (1976). A rapid and sensitive method for the quantitation of microgram quantities of protein utilizing the principle of protein-dye binding. Anal. Biochem. 72, 248–254. 10.1016/0003-2697(76)90527-3a - DOI - PubMed
    1. Church G. M., Gilbert W. (1984). Genomic sequencing. Proc. Natl. Acad. Sci. U.S.A. 81, 1991–1995. - PMC - PubMed