. 2017 May 30:8:594.
doi: 10.3389/fimmu.2017.00594. eCollection 2017.

Relevance of CD6-Mediated Interactions in the Regulation of Peripheral T-Cell Responses and Tolerance

Affiliations

Relevance of CD6-Mediated Interactions in the Regulation of Peripheral T-Cell Responses and Tolerance

Marta Consuegra-Fernández et al. Front Immunol. .

Abstract

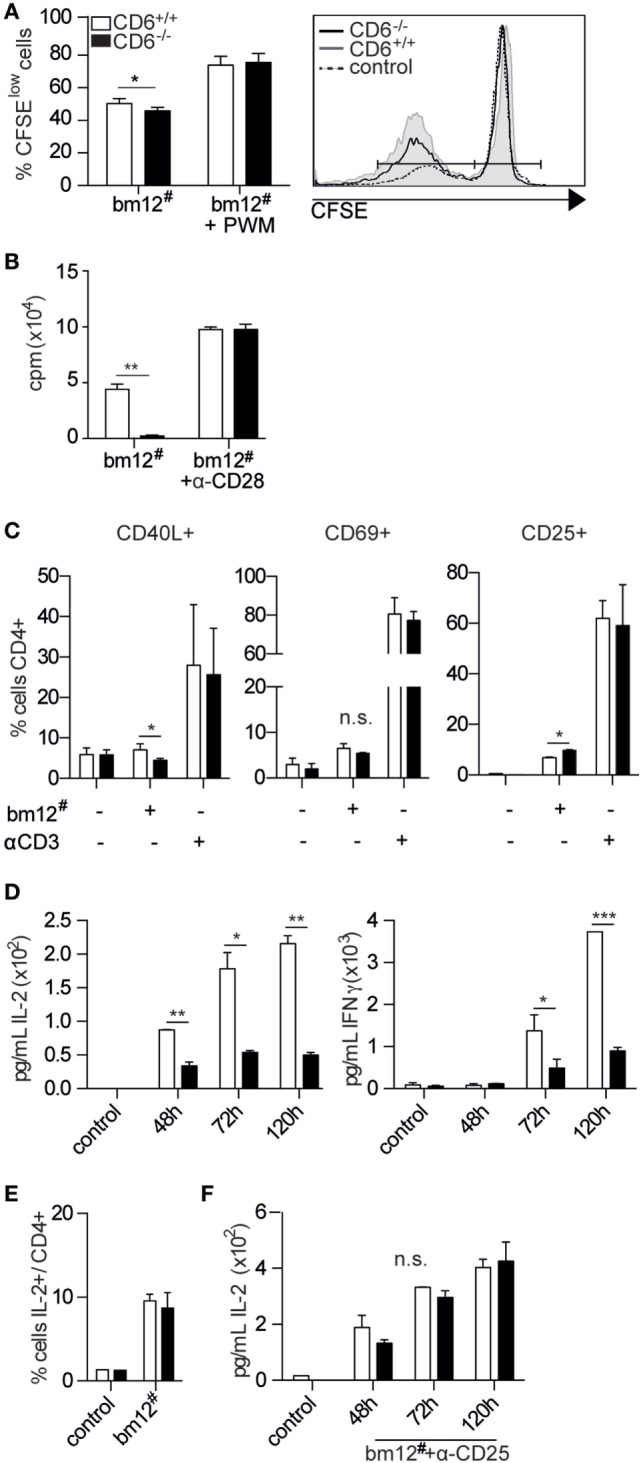
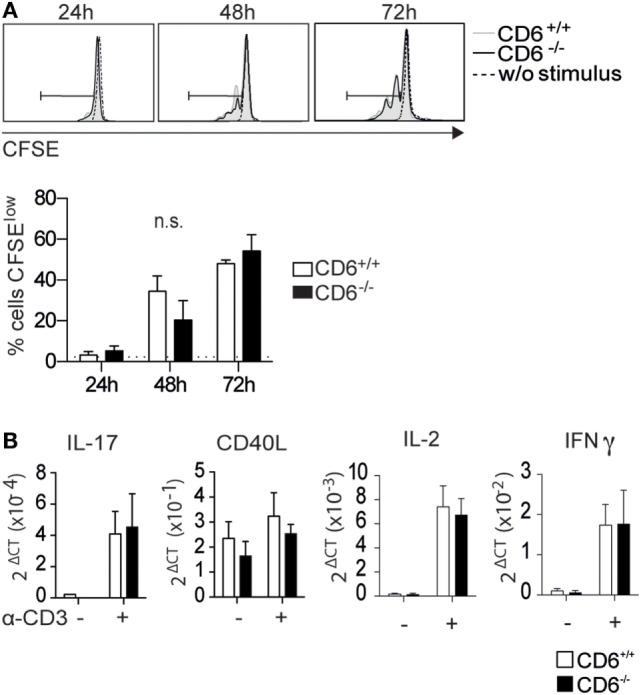
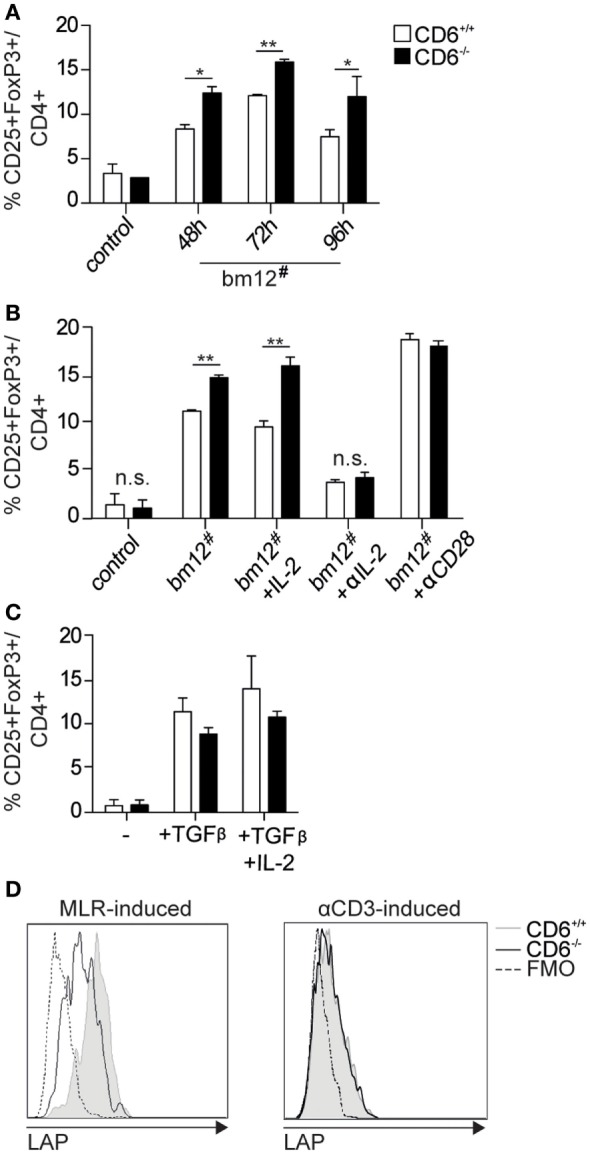
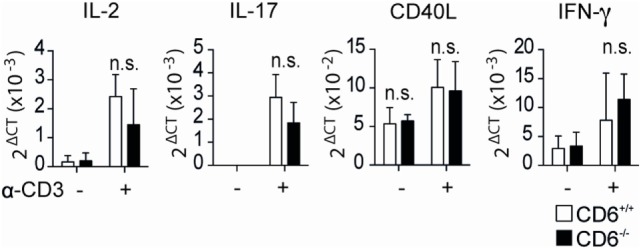
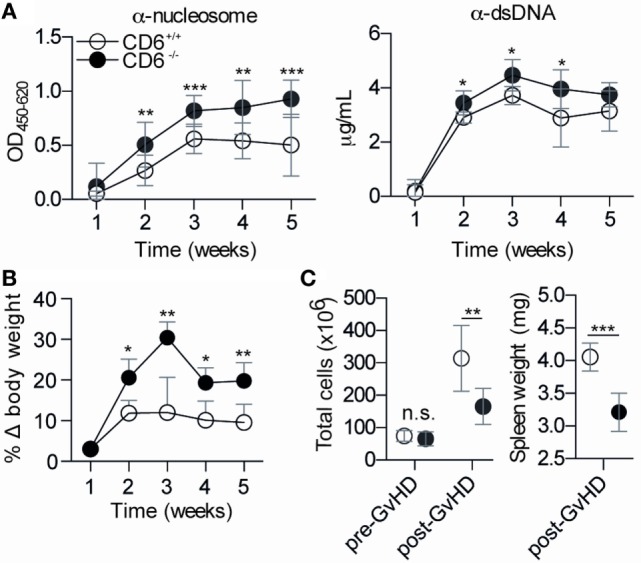
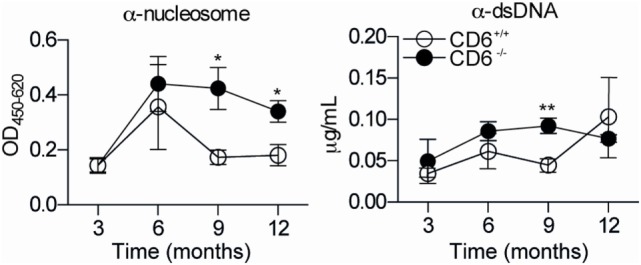
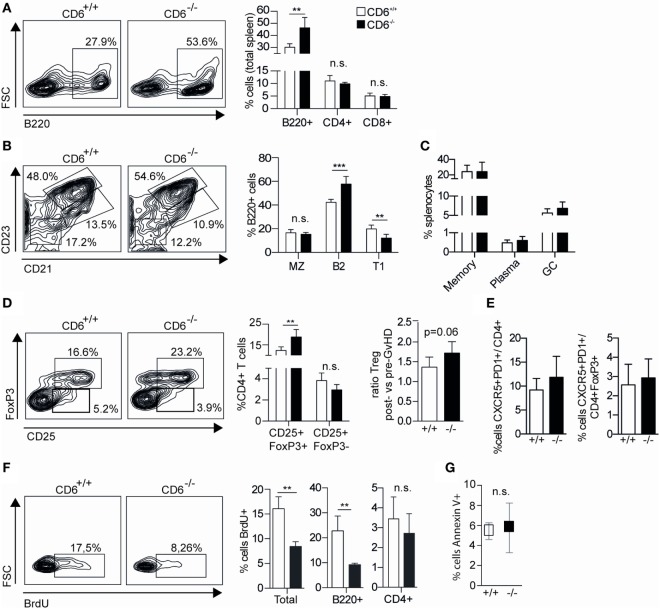
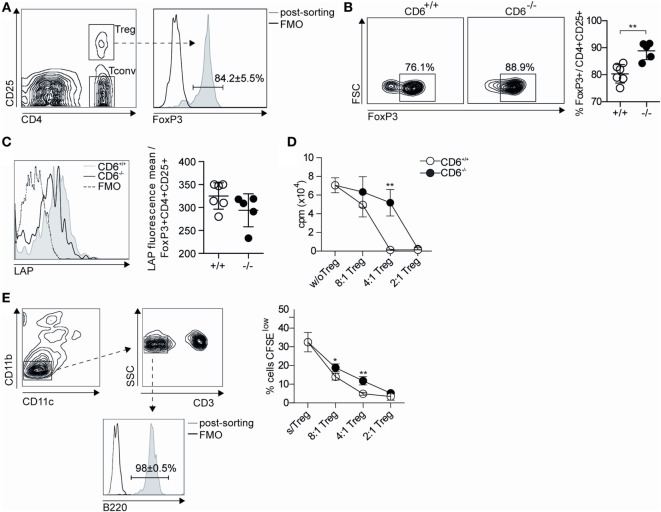
The CD6 lymphocyte receptor has been involved in the pathophysiology of different autoimmune disorders and is now considered a feasible target for their treatment. In vitro data show the relevance of CD6 in the stabilization of adhesive contacts between T-cell and antigen-presenting cells, and the modulation of T-cell receptor signals. However, the in vivo consequences of such a function are yet undisclosed due to the lack of suitable genetically modified animal models. Here, the in vitro and in vivo challenge of CD6-deficient (CD6-/-) cells with allogeneic cells was used as an approach to explore the role of CD6 in immune responses under relative physiological stimulatory conditions. Mixed lymphocyte reaction (MLR) assays showed lower proliferative responses of splenocytes from CD6-/- mice together with higher induction of regulatory T cells (Treg, CD4+CD25+FoxP3+) with low suppressive activity on T and B-cell proliferation. In line with these results, CD6-/- mice undergoing a lupus-like disorder induced by chronic graft-versus-host disease (cGvHD) showed higher serum titers of anti-double-stranded DNA and nucleosome autoantibodies. This occurred together with reduced splenomegaly, which was associated with lower in vivo bromodesoxyuridine incorporation of spleen cells and with increased percentages of spleen follicular B cells (B2, CD21+CD23hi) and Treg cells. Interestingly, functional analysis of in vivo-generated CD6-/- Treg cells exhibited defective suppressive activity. In conclusion, the data from MLR and cGvHD-induced lupus-like models in CD6-/- mice illustrate the relevance of CD6 in T (and B) cell proliferative responses and, even more importantly, Treg induction and suppressive function in the in vivo maintenance of peripheral tolerance.

Keywords: CD6 deficiency; Treg cells; autoimmunity; chronic graft-versus-host disease; lupus-like mouse model; mixed lymphocyte reaction; peripheral tolerance.


Figures

Figure 1
Figure 1
In vitro activation and proliferative responses of spleen CD6−/− cells to allogeneic mixed lymphocyte reaction (MLR) stimulation. (A) Responder CFSE-stained total splenocytes from CD6−/− (solid bars) or CD6+/+ (empty bars) mice were cocultured for 5 days at a 2:1 ratio with irradiated total bm12 splenocytes (bm12#) as stimulators. Percentage (mean ± SD) of proliferating B cells (CFSElow) following MLR-induction alone or in the presence of Pokeweed mitogen (PWM) is shown. Data shown are triplicate samples from one representative experiment of three performed. (B) Spleen CD4+ T cells isolated by negative selection from CD6−/− (solid bars) or CD6+/+ (empty bars) mice were cocultured for 5 days with irradiated bm12 splenocytes (bm12#) in the presence or absence of anti-CD28 monoclonal antibody (mAb) (α-CD28, 1 µg/mL). The bar chart shows the [3H]-thymidine incorporation (in cpm) of triplicate samples from one representative experiment of four performed. (C) Same sorted CD4+ T cells from (B) were stimulated for 24 h and analyzed for CD40L, CD69, and CD25 surface expression in CD4+ gated T cells by flow cytometry. A representative experiment of three performed is shown. (D) Bart charts representing the IL-2 (left-hand side) and IFN-γ (right-hand side) levels (pg/mL) over time from supernatants of same cocultures as in (B). (E) Percentage (mean ± SD) of intracellular IL-2-positive cells among CD4+ spleen T cells from day 5 of same cocultures as in (B). (F) IL-2 levels (pg/mL) over time from supernatants of same cocultures as in (B) in the presence of exogenously added blocking anti-CD25 mAb (30 µg/mL). n.s., not significant; *p < 0.05; **p < 0.01; ***p < 0.001 (Student’s t-test).
Figure 2
Figure 2
In vitro activation and proliferative responses of spleen CD4+ T cells from CD6−/− and CD6+/+ mice to CD3 cross-linking. (A) Sorted spleen CD4+ T cells from untreated CD6−/− and CD6+/+ mice were CFSE-labeled and cultured for 3 days either alone or plastic-bound anti-CD3 monoclonal antibody (1 µg/mL) for further flow cytometry analysis. The histogram shows the CFSE fluorescence intensity from a representative experiment of four performed, at different time points. (B) CD4+ T cells stimulated as in (A) for 7 h were analyzed for mRNA expression levels of the indicated genes by real-time PCR. The bar charts represent quintuplicate mRNA values from six pooled mice, where ΔCt indicates the difference in the threshold cycle between GADPH and target genes. n.s., not significant (Student’s t-test).
Figure 3
Figure 3
In vitro generation and functional analysis of spleen regulatory T cells from CD6−/− mice. (A) Purified CD4+ T cells (105 cells/well) from CD6−/− (solid bars) or CD6+/+ (empty bars) spleens were cocultured with irradiated bm12 splenocytes (bm12#) at a 2:1 ratio for different periods of time for further flow cytometry analysis. Data are shown as percentage (mean ± SD) of CD25+FoxP3+ cells on gated CD4+ cells from duplicates of one representative experiment of four performed. Control means the results of coculturing responder CD6−/− or CD6+/+ cells with irradiated splenocytes from the same responder. (B) Same 72 h cocultures as in (A) in the absence (bm12#) or the presence of exogenously added IL-2 (+IL-2; 150 pg/mL), blocking anti-CD25 monoclonal antibody (mAb) (+αIL-2, 30 µg/mL) or agonistic anti-CD28 mAb (+ αCD28; 5 µg/mL). (C) Sorted (105 cells/well) conventional CD4+CD25 T cells (Tconv) from CD6−/− (solid bars) or CD6+/+ (empty bars) spleens were cultured for 3 days with plastic-bound anti-CD3 mAb (2 µg/mL) plus soluble anti-CD28 mAb (5 µg/mL) in the presence or absence of TGF-β (2 ng/mL) alone or plus IL-2 (20 ng/mL). (D) Flow cytometry analysis of latency-associated peptide (LAP) surface expression on CD4+ gated CD25+FoxP3+ T cells generated at 72 h as in (A) (left) or as in (C) (right). Shown is a representative experiment of four performed. n.s., not significant (Student’s t-test).
Figure 4
Figure 4
Relative mRNA expression levels of in vivo isolated CD4+CD25+ cells from CD6−/− and CD6+/+ mouse spleens following direct T-cell receptor complex cross-linking. Sorted CD4+CD25+ T cells [regulatory T cells (Treg)] from CD6−/− (n = 5, solid bars) and CD6+/+ (empty bars) were stimulated in anti-CD3 (1 µg/mL) coated plates. Relative mRNA expression for the indicated genes was measured after 7 h of stimulation by real-time PCR. n.s., not significant; *p < 0.05; **p < 0.01; ***p < 0.001; ****p < 0.0001 (Student’s t-test).
Figure 5
Figure 5
Phenotypical characterization of CD6−/− and CD6+/+ mice following chronic graft-versus-host disease (cGvHD)-induced lupus-like disease. (A) ELISA determination of serum levels of autoantibodies against nucleosome (left) and dsDNA (right) at different weeks post-induction of cGvHD in CD6−/− (n = 6; solid circles) and CD6+/+ (n = 6; empty circles) mice. Results are from one representative experiment of three performed and are expressed as mean ± SD of OD at 450 nm (anti-nucleosome) or concentration in microgram per milliliter (anti-dsDNA). (B) Percentage of weekly body weight variation (mean ± SD) with regard to initial weight from the same mice groups as in (A). (C) Left, total spleen cell numbers pre and post (week 5) GvHD induction in the same mice groups as in (A). (C) Right, spleen weight (mg) at week 5 post cGvHD from same mice groups as in A. The results are the mean ± SD from one representative experiment of three performed. n.s., not significant; *p < 0.05; **p < 0.01; ***p < 0.001 (Student’s t-test).
Figure 6
Figure 6
Anti-dsDNA and anti-nucleosoma autoantibody titers in aged CD6−/− and CD6+/+ mice. Serum levels of autoantibodies against nucleosome (left-hand side) and dsDNA (right-hand side) from untreated CD6−/− (n = 5, filled circles) and CD6+/+ (n = 5, empty circles) mice at 3, 6, 9, and 12 months of age were determined by ELISA. Data are expressed as mean ± SD of duplicates from a representative experiment of two performed. *p < 0.05; **p < 0.01 (Student’s t-test).
Figure 7
Figure 7
Lymphocyte subset analysis of spleens from CD6−/− and CD6+/+ mice undergoing chronic graft-versus-host disease (cGvHD)-induced lupus-like disease. (A) Flow cytometry contour plots of B220+ cells and percentage (mean ± SD) of B220+, CD4+, and CD8+ cells from total spleens harvested at week 5 post cGvHD induction in CD6−/− (n = 6; solid bars) and CD6+/+ (n = 6; empty bars) mice. (B) Flow cytometry contour plots and percentages (mean ± SD) of spleen B220+ cells with marginal zone B cells (MZ, CD21+CD23low), follicular (B2, CD21+CD23+), and transitional type 1 (T1, CD21CD23) phenotypes from the same groups of mice as in (A). (C) Percentages (mean ± SD) of memory (CD19+CD138IgDIgM), plasma (CD19 CD138+), and germinal zone B-cells (CD19+GL-7+) from the same groups of mice as in (A). (D) Percentages (mean ± SD) of follicular helper (TFH; CD4CXCR5+PD1+) and follicular regulatory T cells (Treg) (TFR; CD4CXCR5+PD1+ FoxP3+) from the same groups of mice as in (A). (E) Left, Percentage (mean ± SD) of CD4+ spleen T cells with regulatory (CD25+FoxP3+) and activated (CD25+FoxP3) phenotypes from the same groups of mice as in (A). (E) Right, Increment in the percentage of spleen Treg (CD4+CD25+FoxP3+) cells at week 5 postinduction of cGvHD in the same groups of mice as in (A). Results are expressed as the ratio (mean ± SD) resulting from dividing the percentage of Treg at week 5 by that at week 0. (F) Flow cytometry contour plots and percentage (mean ± SD) of BrdU+ cells from total, B220+ and CD4+ splenocytes at week 5 from the same groups of mice as in (A). (G) Percentage (mean ± SD) of total spleen cells with late-stage apoptotic phenotype (Annexin V+ 7-AAD+) from the same groups of mice as in (A). In all cases, data shown are from one representative experiment of three performed. n.s., not significant; BrdU, bromodesoxyuridine; **p < 0.01; ***p < 0.001 (Student’s t-test).
Figure 8
Figure 8
In vitro proliferative responses of B220+ cells from CD6−/− and CD6+/+ mice to IgM cross-linking and lipopolysaccharide (LPS) stimulation. (A) Negatively selected spleen B cells from CD6−/− and CD6+/+ mice were CFSE-labeled and cultured for 3 days either unstimulated (w/o stimulus) or stimulated with F(ab′)2 anti-IgM (αIgM; 10 µg/mL) alone or in the presence of anti-CD40 (αCD40; 5 µg/mL) or IL-4 (10 ng/mL). (B) Same cells as in (A) were stimulated for 3 days with LPS (20 µg/mL) alone or plus IL-4 (30 ng/mL). Histograms show the CFSE fluorescence intensity of cells from a representative experiment of two performed.
Figure 9
Figure 9
Functional assessment of the suppressive activity of in vivo isolated CD4+ CD25+ spleen T cells from CD6−/− and CD6+/+ mice. (A) Density plot histogram showing the fluorescence intensity of conventional CD4+CD25 (Tconv) and regulatory CD4+CD25+ [regulatory T cells (Treg)] spleen T cells from CD6+/+ mice subjected to further FACS sorting. (B) Contour plot and percentages (mean ± SD) of FoxP3 expression in sorted CD4+CD25+ T cells 5 weeks after chronic graft-versus-host disease induction. (C) Flow cytometry analysis and percentages (mean ± SD) of latency-associated peptide (LAP) surface expression on CD4+ gated CD25+FoxP3+ T cells from spleens of untreated CD6−/− and CD6+/+ mice. (D) Sorted Tconv cells from untreated CD6+/+ mice were cocultured at a 2:1 ratio with irradiated bm12 splenocytes alone or in the presence of sorted Treg from CD6−/− (solid circles) or CD6+/+ (empty circles) mice at week 5 post GvHD induction, added at the indicated Tconv:Treg ratios. Shown is the [3H]-thymidine incorporation (in cpm) after 5 days of coculture. (E) Left, density plot histogram showing the sorting strategy to isolate B220+ cells from CD6+/+ mice (E) Right. Sorted spleen B220+ cells from wild-type (CD6+/+) mice were CFSE-labeled and cultured for 3 days in the presence of F(ab’)2 anti-IgM fragments (10 µg/mL) alone or plus sorted CD4+CD25hi (Treg) splenocytes from CD6−/− (solid circles) or CD6+/+ (empty circles) mice, at the indicated B:Treg ratios. The line chart show the percentage (mean ± SD) CFSElow cells from a representative experiment of two performed. Data are mean ± SD of triplicate samples from one representative experiment of four performed. *p < 0.05; **p < 0.01 (Student’s t-test).

References

    1. Kamoun M, Kadin ME, Martin PJ, Nettleton J, Hansen JA. A novel human T cell antigen preferentially expressed on mature T cells and shared by both well and poorly differentiated B cell leukemias and lymphomas. J Immunol (1981) 127:987–91. - PubMed
    1. Alonso-Ramirez R, Loisel S, Buors C, Pers J-O, Montero E, Youinou P, et al. Rationale for targeting CD6 as a treatment for autoimmune diseases. Arthritis (2010) 2010:130646.10.1155/2010/130646 - DOI - PMC - PubMed
    1. Jayaraman K. Biocon’s first-in-class anti-CD6 mAb reaches the market. Nat Biotechnol (2013) 31:1062–3.10.1038/nbt1213-1062b - DOI - PubMed
    1. Hernández P, Moreno E, Aira LE, Rodríguez PC. Therapeutic targeting of CD6 in autoimmune diseases: a review of Cuban clinical studies with the antibodies IOR-T1 and itolizumab. Curr Drug Targets (2016) 17:666–77.10.2174/1389450117666160201114308 - DOI - PubMed
    1. De Jager PL, Jia X, Wang J, de Bakker PIW, Ottoboni L, Aggarwal NT, et al. Meta-analysis of genome scans and replication identify CD6, IRF8 and TNFRSF1A as new multiple sclerosis susceptibility loci. Nat Genet (2009) 41:776–82.10.1038/ng.401 - DOI - PMC - PubMed