. 2017 May 29:8:609.
doi: 10.3389/fimmu.2017.00609. eCollection 2017.

Fatty Acid Oxidation Compensates for Lipopolysaccharide-Induced Warburg Effect in Glucose-Deprived Monocytes

Affiliations

Fatty Acid Oxidation Compensates for Lipopolysaccharide-Induced Warburg Effect in Glucose-Deprived Monocytes

Nora Raulien et al. Front Immunol. .

Abstract

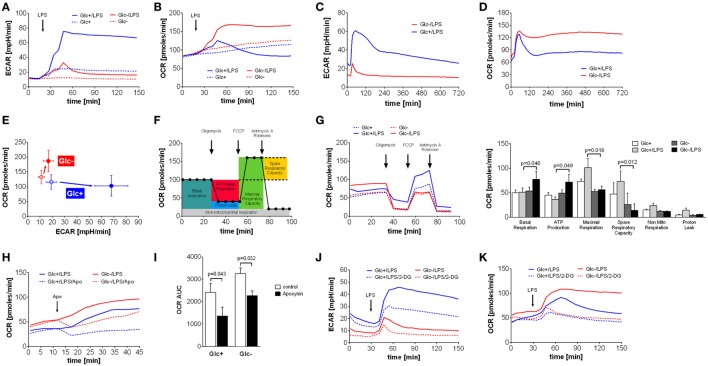
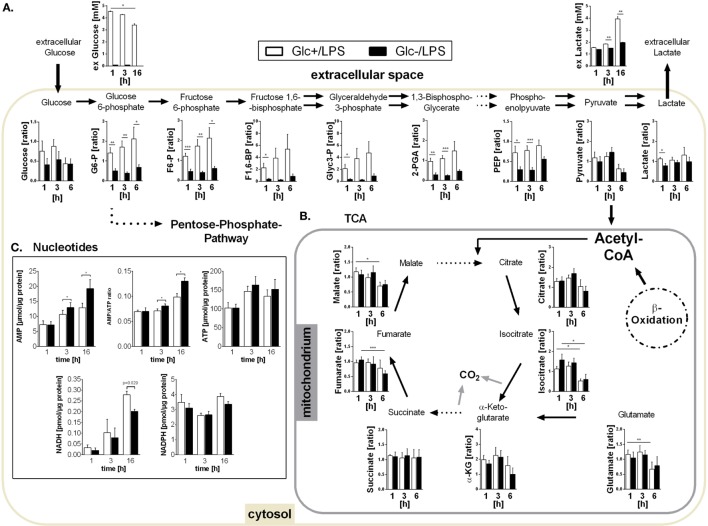
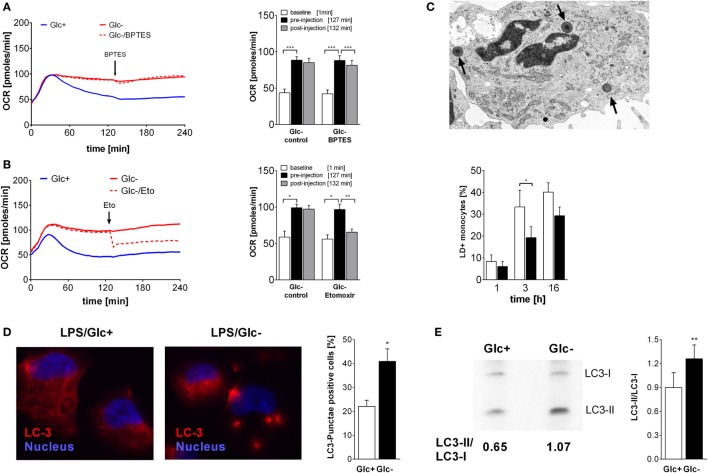
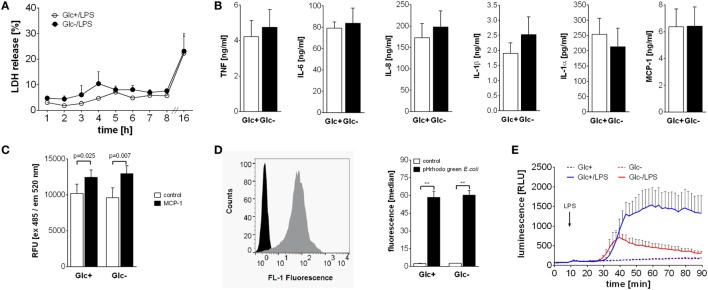
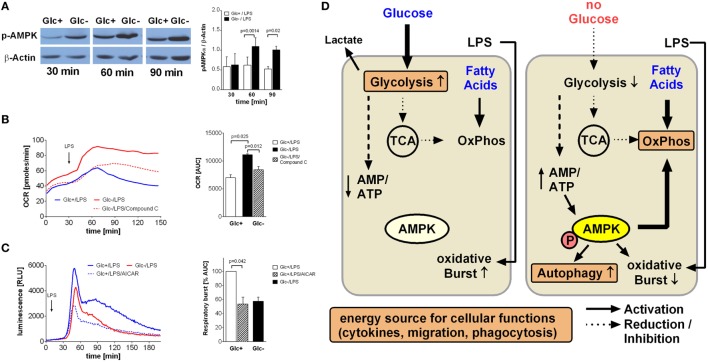
Monocytes enter sites of microbial or sterile inflammation as the first line of defense of the immune system and initiate pro-inflammatory effector mechanisms. We show that activation with bacterial lipopolysaccharide (LPS) induces them to undergo a metabolic shift toward aerobic glycolysis, similar to the Warburg effect observed in cancer cells. At sites of inflammation, however, glucose concentrations are often drastically decreased, which prompted us to study monocyte function under conditions of glucose deprivation and abrogated Warburg effect. Experiments using the Seahorse Extracellular Flux Analyzer revealed that limited glucose supply shifts monocyte metabolism toward oxidative phosphorylation, fueled largely by fatty acid oxidation at the expense of lipid droplets. While this metabolic state appears to provide sufficient energy to sustain functional properties like cytokine secretion, migration, and phagocytosis, it cannot prevent a rise in the AMP/ATP ratio and a decreased respiratory burst. The molecular trigger mediating the metabolic shift and the functional consequences is activation of AMP-activated protein kinase (AMPK). Taken together, our results indicate that monocytes are sufficiently metabolically flexible to perform pro-inflammatory functions at sites of inflammation despite glucose deprivation and inhibition of the LPS-induced Warburg effect. AMPK seems to play a pivotal role in orchestrating these processes during glucose deprivation in monocytes.

Keywords: Warburg effect; fatty acid oxidation; glucose deprivation; inflammation; monocytes.


Figures

Figure 1
Figure 1
Abrogation of lipopolysaccharide (LPS)-induced Warburg effect by glucose deprivation in monocytes leads to compensatory increase of oxidative phosphorylation. (A,B) Shown are mean (n = 6) (A) extracellular acidification rate (ECAR) and (B) oxygen consumption rate (OCR) of monocytes in glucose medium or in glucose-deprived medium, measured by the Seahorse XF96 analyzer. Cells were stimulated with LPS or medium control at t = 20 min. (C,D) Long-term metabolic measurement [(C) ECAR and (D) OCR] of LPS-stimulated (t = 15 min) monocytes (n = 4). (E) The phenogram of ECAR and OCR rates shows mean values ± STD (n = 6) at t = 150 min generated from data sets shown in panels (A,B). (F) Scheme of mitochondrial metabolic parameter calculation using the Mitochondrial Stress Test. (G) Mitochondrial Stress Test of monocytes treated for 2 h with LPS or control and with or without glucose. Changes of OCR after injection of Mitochondrial Stress Test components are shown as mean rates of n = 5 donors. (H) The contribution of NADPH oxidase to the OCR was analyzed by injection of the specific inhibitor apocynin. Shown are mean OCR rates of n = 3 donors. (I) Area under the curve of OCR rates shown in panel (H) was calculated and is depicted as mean ± SEM of n = 3 experiments. (J,K) The metabolic changes in LPS-treated monocytes due to glucose deprivation and inhibition of glycolysis with 2-deoxyglucose (5 mM; dashed line) are shown as ECAR (J) and OCR (K) of n = 4 donors. For each donor and condition, the analysis was run at least in triplicates. Statistical analysis was performed using the paired Student’s t-test.
Figure 2
Figure 2
Metabolites of glycolysis and tricarboxylic acid (TCA) and intracellular nucleotides in glucose-deprived lipopolysaccharide (LPS)-stimulated monocytes. (A) Intracellular glycolytic metabolites were extracted from LPS-stimulated monocytes with methanol/chloroform and measured using IC-MS/MS. Peak areas were normalized to unstimulated freshly isolated cells. Shown are mean values of n = 7 (±SEM) experiments from three different donors. Extracellular glucose and lactate concentrations were determined in the supernatant of LPS-stimulated monocytes under glucose or glucose-deprived conditions at time points 1, 3, and 16 h. Shown are mean values ± SEM of n = 3 donors. Statistical analysis was performed using the paired Student’s t-test. (B) Intracellular TCA metabolites were generated as in panel (A). (C) Intracellular ATP, AMP, NADH, and NADPH concentrations were determined at 1, 3, and 16 h in glycolytic or glucose-deprived monocytes stimulated with LPS. The concentrations were normalized to the whole protein content of the lysate. Bar charts show mean concentrations (±SEM) of n = 6 (ATP, AMP, NADPH) or n = 3 (NADH). Statistical analysis was performed using the paired Student’s t-test.
Figure 3
Figure 3
Oxidative metabolism is fueled by glutamine and fatty acids in glucose-deprived monocytes. (A,B) The oxygen consumption rate (OCR) changes of lipopolysaccharide (LPS)-stimulated monocytes following inhibition of (A) glutaminase with BPTES (30 µM; n = 6) or (B) fatty acid transport with etomoxir (250 µM; n = 4) were analyzed. The OCR is shown as mean curve over 240 min and in the bar chart as mean ± SEM at baseline (1 min), before (127 min), and after inhibitor injection (132 min). For each donor and condition, the analysis in panels (A,B) was run at least in duplicates. (C) LPS-simulated monocytes with lipid droplets (LDs; arrow) were determined with TEM at 1, 3, and 6 h. Shown is the mean ± SEM of LD-positive monocytes out of >190 cells analyzed from n = 3 donors. (D) Autophagy was analyzed in PMA-differentiated THP1 cells. Cells were stimulated with LPS with or without glucose for 3 h and stained with anti-LC3 antibody. Autophagy-positive cells (≥3 LC3 punctae/cell) were analyzed in >40 cells (n = 4; mean ± SEM). (E) Autophagy in primary LPS-stimulated monocytes with or without glucose was analyzed by Western Blot. The ratio of autophagosomal membrane-bound LC3-II to unbound LC3-I was determined after 3 h (n = 6; mean ± SEM). Statistical analysis was performed using the paired Student’s t-test.
Figure 4
Figure 4
Differential influence of glucose deprivation on monocyte functions. (A) Cell death was determined by measuring the lactate dehydrogenase (LDH) release of monocytes cultured with or without glucose and is shown as percentage of total intracellular LDH. Depicted are mean values of n = 3 donors ± SEM. (B) Monocytes were stimulated with lipopolysaccharide (LPS) for 4 h (TNF) or 16 h (IL-6, IL-8, IL-1β, IL-1α, and MCP-1), and released cytokines were determined in the supernatant by ELISA. Shown are mean values (n = 4) ± SEM. (C) Migratory capacity of LPS-stimulated monocytes with or without glucose was determined in a Boyden chamber with MCP-1. Migrated cells were stained after 4 h with calcein AM, the fluorescence was determined and is shown as mean relative fluorescence units ± SEM (n = 6). (D) Phagocytic activity of 2 h lipopolysaccharide (LPS)-stimulated monocytes with or without glucose was analyzed with pHrodo Green E. coli BioParticles. Particles were added for 10 min, and the fluorescence of monocytes was determined by flowcytometry. The bar chart depicts the median fluorescence ± SEM of monocytes from n = 3 donors. (E) The oxidative burst after LPS stimulation of 2 h glucose-deprived and control monocytes was measured by luminescence increase of oxidized luminol. Shown is the mean luminescence (n = 3) ± SEM. Statistical analysis was performed using the paired Student’s t-test. Significant changes are indicated.
Figure 5
Figure 5
AMP-activated protein kinase (AMPK) activation is responsible for increased oxidative phosphorylation and decreased respiratory burst of glucose-deprived monocytes. (A) Activation of AMPK is demonstrated in Western Blot using anti-phosphoAMPKα Thr172 Antibody. Monocytes were stimulated for 30, 60, and 90 min with lipopolysaccharide (LPS) and with or without glucose. Shown is one representative Western Blot out of four independent experiments and the ratio of pAMPKα/β-actin densitometry quantification of n = 4. (B) The increase of oxidative phosphorylation due to glucose deprivation is mediated by AMPK activation. Monocytes under glucose deprivation were treated with the AMPK inhibitor compound C (10 µM; red dashed line) before the stimulation with LPS. Depicted are mean oxygen consumption rate curves and area under the curve (AUC) ± SEM from n = 3 donors. (C) The oxidative burst of LPS-stimulated monocytes is regulated by AMPK activation. Monocytes were cultured for 2 h with (blue) or without (red) glucose and then stimulated with LPS. Activation of AMPK in the presence of glucose with AICAR decreased the oxidation of luminol. Shown are mean luminescence rates and the calculated AUC ± SEM of n = 3 experiments. Statistical analysis was performed using the paired Student’s t-test. (D) Graphical summary of AMPK-mediated switch from glycolysis to oxidative phosphorylation under glucose-deprived conditions.

References

    1. Rossol M, Pierer M, Raulien N, Quandt D, Meusch U, Rothe K, et al. Extracellular Ca2+ is a danger signal activating the NLRP3 inflammasome through G protein-coupled calcium sensing receptors. Nat Commun (2012) 3:1329.10.1038/ncomms2339 - DOI - PMC - PubMed
    1. Martinon F, Pétrilli V, Mayor A, Tardivel A, Tschopp J. Gout-associated uric acid crystals activate the NALP3 inflammasome. Nature (2006) 440(7081):237–41.10.1038/nature04516 - DOI - PubMed
    1. Ferrari D, Chiozzi P, Falzoni S, Dal Susino M, Melchiorri L, Baricordi OR, et al. Extracellular ATP triggers IL-1 beta release by activating the purinergic P2Z receptor of human macrophages. J Immunol (1997) 159(3):1451–8. - PubMed
    1. Tannahill GM, Curtis AM, Adamik J, Palsson-McDermott EM, McGettrick AF, Goel G, et al. Succinate is an inflammatory signal that induces IL-1β through HIF-1α. Nature (2013) 496(7444):238–42.10.1038/nature11986 - DOI - PMC - PubMed
    1. Dietl K, Renner K, Dettmer K, Timischl B, Eberhart K, Dorn C, et al. Lactic acid and acidification inhibit TNF secretion and glycolysis of human monocytes. J Immunol (2010) 184(3):1200–9.10.4049/jimmunol.0902584 - DOI - PubMed

LinkOut - more resources