. 2017 Nov;134(5):769-788.
doi: 10.1007/s00401-017-1737-3. Epub 2017 Jun 13.

Deficiency of TYROBP, an adapter protein for TREM2 and CR3 receptors, is neuroprotective in a mouse model of early Alzheimer's pathology

Affiliations

Deficiency of TYROBP, an adapter protein for TREM2 and CR3 receptors, is neuroprotective in a mouse model of early Alzheimer's pathology

Jean-Vianney Haure-Mirande et al. Acta Neuropathol. 2017 Nov.

Abstract

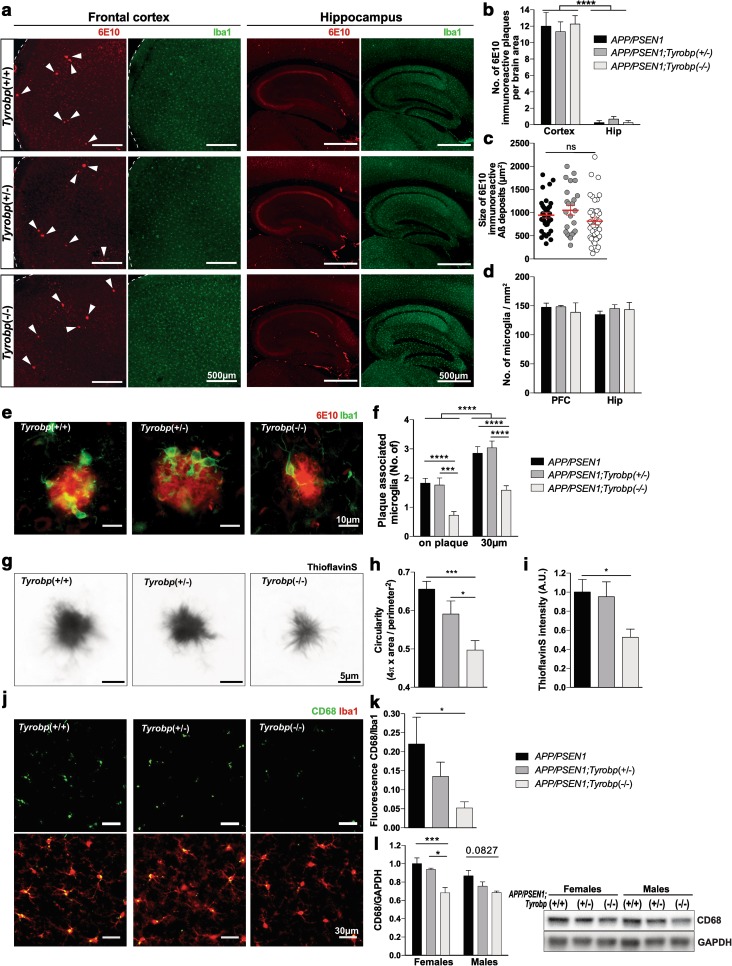
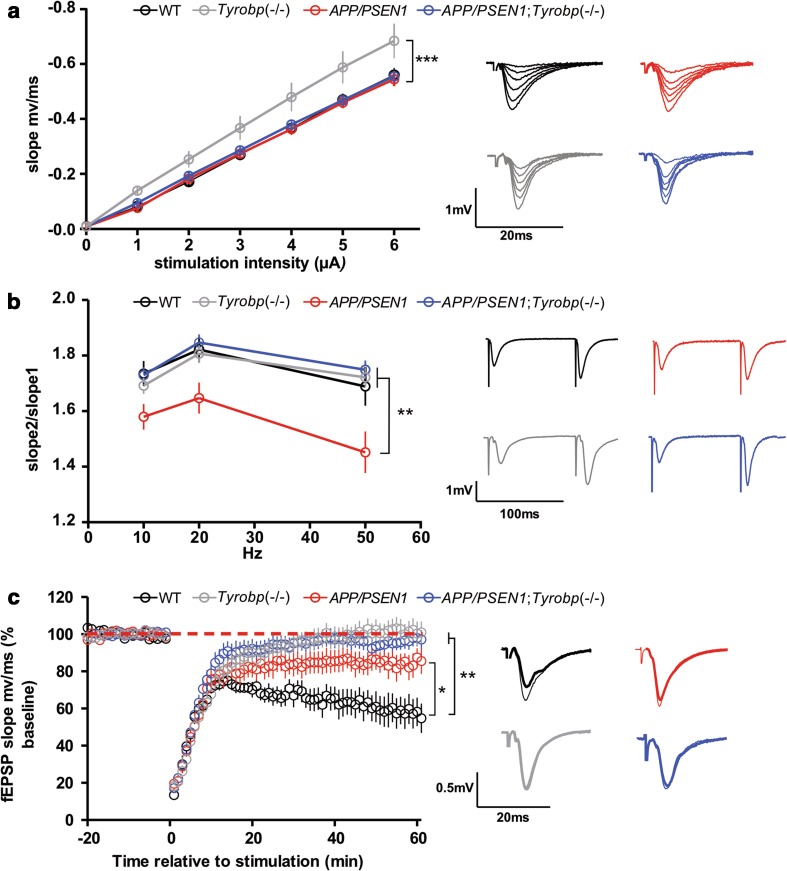
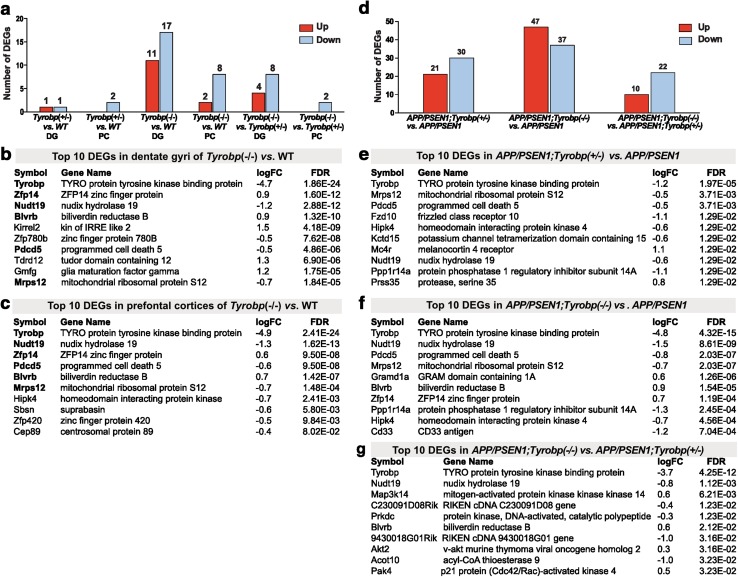
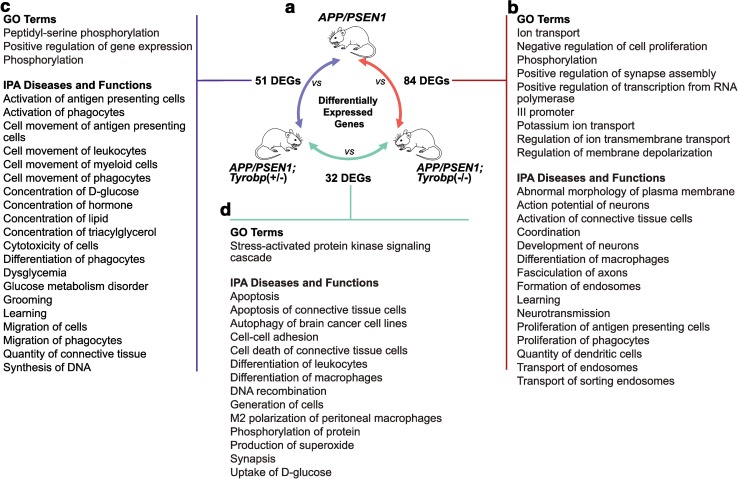
Conventional genetic approaches and computational strategies have converged on immune-inflammatory pathways as key events in the pathogenesis of late onset sporadic Alzheimer's disease (LOAD). Mutations and/or differential expression of microglial specific receptors such as TREM2, CD33, and CR3 have been associated with strong increased risk for developing Alzheimer's disease (AD). DAP12 (DNAX-activating protein 12)/TYROBP, a molecule localized to microglia, is a direct partner/adapter for TREM2, CD33, and CR3. We and others have previously shown that TYROBP expression is increased in AD patients and in mouse models. Moreover, missense mutations in the coding region of TYROBP have recently been identified in some AD patients. These lines of evidence, along with computational analysis of LOAD brain gene expression, point to DAP12/TYROBP as a potential hub or driver protein in the pathogenesis of AD. Using a comprehensive panel of biochemical, physiological, behavioral, and transcriptomic assays, we evaluated in a mouse model the role of TYROBP in early stage AD. We crossed an Alzheimer's model mutant APP KM670/671NL /PSEN1 Δexon9 (APP/PSEN1) mouse model with Tyrobp -/- mice to generate AD model mice deficient or null for TYROBP (APP/PSEN1; Tyrobp +/- or APP/PSEN1; Tyrobp -/-). While we observed relatively minor effects of TYROBP deficiency on steady-state levels of amyloid-β peptides, there was an effect of Tyrobp deficiency on the morphology of amyloid deposits resembling that reported by others for Trem2 -/- mice. We identified modulatory effects of TYROBP deficiency on the level of phosphorylation of TAU that was accompanied by a reduction in the severity of neuritic dystrophy. TYROBP deficiency also altered the expression of several AD related genes, including Cd33. Electrophysiological abnormalities and learning behavior deficits associated with APP/PSEN1 transgenes were greatly attenuated on a Tyrobp-null background. Some modulatory effects of TYROBP on Alzheimer's-related genes were only apparent on a background of mice with cerebral amyloidosis due to overexpression of mutant APP/PSEN1. These results suggest that reduction of TYROBP gene expression and/or protein levels could represent an immune-inflammatory therapeutic opportunity for modulating early stage LOAD, potentially leading to slowing or arresting the progression to full-blown clinical and pathological LOAD.

Keywords: APP/PSEN1; Alzheimer’s disease; CR3 adapter; Microglia; TREM2 adapter; TYROBP/DAP12.


Conflict of interest statement

The authors declare that they have no conflict of interest.

Figures

Fig. 1
Fig. 1
A decrease in TYROBP protein impairs Aβ deposits compaction, microglial activation, and recruitment around Aβ deposits in 4-month-old APP/PSEN1 mice. a Images of Iba1-immunostained microglia (green) and 6E10-immunoreactive plaques (red) in frontal cortices and hippocampi of APP/PSEN1, APP/PSEN1; Tyrobp +/ and APP/PSEN1; Tyrobp / mice. Arrows indicate location of the plaques. Scale bar 500 µm. b Quantification of the number of 6E10-immunoreactive Aβ deposits in cortices and hippocampi (Hip) of APP/PSEN1, APP/PSEN1; Tyrobp +/ and APP/PSEN1; Tyrobp / mice. c Measurements of the size of 6E10-immunoreactive Aβ deposits in cortices of APP/PSEN1 mice WT, deficient or null for Tyrobp. d Quantification of the number of Iba1-immunostained microglia in frontal cortices and hippocampi of APP/PSEN1, APP/PSEN1; Tyrobp +/ and APP/PSEN1; Tyrobp / mice. e, f Images of Iba1-immunostained microglia (green) and 6E10-immunoreactive plaques (red) and quantification of numbers of cortices plaque-associated microglia located on or within 30 µm radius of 6E10 immunoreactive Aβ plaques in APP/PSEN1, APP/PSEN1; Tyrobp +/ and APP/PSEN1; Tyrobp / mice. n = 3–4 mice per group. Scale bar 10 µm. gi Images of thioflavin S-labeled amyloid plaques (g), circularity (h) and quantification of fluorescence intensity (i) of thioflavin S-labeled amyloid plaques from APP/PSEN1, APP/PSEN1; Tyrobp +/ and APP/PSEN1; Tyrobp / mice. n = 3–4 mice per group. Scale bar 5 µm. j, k Images of phagocytic microglial marker CD68 (green) and Iba1 (red) co-immunostaining (j) and quantification of fluorescence intensity of CD68 (k) in APP/PSEN1, APP/PSEN1; Tyrobp +/ and APP/PSEN1; Tyrobp / mice. n = 3–4 mice per group. Scale bar 30 µm. i Western blot analysis of CD68 in brain protein homogenates from APP/PSEN1, APP/PSEN1; Tyrobp +/ and APP/PSEN1; Tyrobp / mice. n = 3–6 mice per group. At least two independent western blot analyses were performed. Representative immunoreactive bands from the same western blot are shown on the right. One-way ANOVA corrected for multiple comparisons (Tukey) was used for (c, h, i, k) and Two-way ANOVA corrected for multiple comparisons (Tukey) was used for (b, d, f, l), *p < 0.05; ***p < 0.001; ****p < 0.0001. Data presented as mean ± SEM
Fig. 2
Fig. 2
A decrease in TYROBP protein decreases oligomeric Aβ levels and alters phospho-TAU, synaptophysin, LAMP1, and complement C3 levels in 4-month-old APP/PSEN1 mice. ac Hemibrains of male and female APP/PSEN1 (n = 4–6), APP/PSEN1; Tyrobp +/ (n = 3–8) and APP/PSEN1; Tyrobp / (n = 3–4) mice were processed via differential detergent solubilization to produce fractions of TBS soluble, Triton-X soluble, and formic acid soluble Aβ. Oligomeric Aβ was assessed from the TBS-soluble fraction via dot blot analyses using NU-4 (a), A11 (b) and OC (c) antibodies. di Western blot analysis in brain protein homogenates from 4-month-old male and female mice WT, Tyrobp +/, Tyrobp / and APP/PSEN1, APP/PSEN1; Tyrobp +/ and APP/PSEN1; Tyrobp / mice. d, e Phospho-tau (AT8 epitope)/total tau ratio for d WT, Tyrobp +/, Tyrobp −/− mice and e APP/PSEN1, APP/PSEN1; Tyrobp +/ and APP/PSEN1; Tyrobp / mice. f, g Synaptophysin level for f WT, Tyrobp +/, Tyrobp −/− mice and g APP/PSEN1, APP/PSEN1; Tyrobp +/ and APP/PSEN1; Tyrobp / mice. h Marker of dystrophic neurites (Lamp1) in APP/PSEN1, APP/PSEN1; Tyrobp +/ and APP/PSEN1; Tyrobp / mice. i Complement C3 in APP/PSEN1, APP/PSEN1; Tyrobp +/ and APP/PSEN1; Tyrobp / mice. At least two independent western blot analyses were performed. Representative immunoreactive bands from the same western blot are shown on the right. n = 3–6 mice per group. Two-way ANOVA corrected for multiple comparisons (Tukey) was used for all statistical comparisons in male and female mice, *p < 0.05; **p < 0.01; ***p < 0.001, ****p < 0.0001. Data presented as mean ± SEM
Fig. 3
Fig. 3
A decrease in TYROBP protein alters excitatory synaptic transmission in the hippocampus in 4-month-old APP/PSEN1 mice and interacts with the APP/PSEN1 genotype. In all panels, summary graphs are shown on the left and representative traces on the right. a Basal synaptic function is increased in Tyrobp −/− mice, but is unaffected by other transgenic genotypes. The slope of the input/output relationship was steeper for the Tyrobp −/− mice than for all other genotypes (p < 0.05), which did not differ among themselves. b APP/PSEN1 mice showed reduced paired-pulse facilitation (PPF) relative to other genotypes, which did not differ among themselves. c Synaptically induced long-term depression (LTD) was impaired in all recombinant mice. Analysis over the final 5 min of the recordings showed the most profound deficits for Tyrobp / and APP/PSEN1;Tyrobp / mice, both of which were significantly less depressed than in APP/PSEN1 mice. Wild-type (WT) controls showed significantly greater depression than the other genotypes. One-way ANOVA corrected for multiple comparisons (Tukey) was used for statistical comparisons, *p < 0.05, **p < 0.01; ***p < 0.001. Data presented as mean as mean ± SEM
Fig. 4
Fig. 4
A decrease in TYROBP protein improves spatial learning and memory in the Barnes Maze Test in 4-month-old APP/PSEN1 mice. ad 6 groups of 4-month-old mice were used: wild-type (WT) (n = 14), Tyrobp +/ (n = 9), Tyrobp −/− (n = 10), APP/PSEN1 (n = 5), APP/PSEN1; Tyrobp +/ (n = 9) or APP/PSEN1; Tyrobp / (n = 11). a, b Mean latencies to enter the target hole for a APP/PSEN1 negative mice and b APP/PSEN1 positive mice. c, d Mean distances traveled for c APP/PSEN1 negative mice and d APP/PSEN1 positive mice. Two-way ANOVA corrected for multiple comparisons (Tukey) was used for all statistical comparisons, *p < 0.05; **p < 0.01; ***p < 0.001. Data presented as mean ± SEM
Fig. 5
Fig. 5
Differential gene expression analysis suggests potential molecular mechanisms associated with TYROBP deficiency. ac Differential gene expression analysis in dentate gyrus and prefrontal cortex of Tyrobp / , Tyrobp +/ and WT mice. a Number of up- and down-regulated genes in Tyrobp −/− and Tyrobp +/− vs. WT and Tyrobp −/− vs. Tyrobp +/−. b Top 10 differentially expressed genes in b dentate gyrus of Tyrobp −/− vs. WT and c prefrontal cortex of Tyrobp −/− vs. WT. Bolding highlights differentially expressed genes shared across dentate gyrus and prefontal cortex. RNA sequencing was performed on a total of 47 samples (Tyrobp −/− n = 8 males and 8 females, Tyrobp +/− n = 8 males and 8 females, and WT n = 7–8 samples, eight males and eight females, for each brain regions). All analyses were corrected for sex effect. Differential gene expression threshold was set at fold change ≥1.2 and adjusted p value <0.1. DG dentate gyrus, PC prefrontal cortex. dg Differential gene expression analysis in prefrontal cortex of APP/PSEN1;Tyrobp / , APP/PSEN1; Tyrobp +/ and APP/PSEN1 mice at 4-months-old. d Number of up- and down-regulated genes in APP/PSEN1;Tyrobp / and APP/PSEN1;Tyrobp +/ vs. APP/PSEN1 and APP/PSEN1; Tyrobp / vs. APP/PSEN1; Tyrobp +/. e Top 10 differentially expressed genes in APP/PSEN1; Tyrobp +/vs. APP/PSEN1; f APP/PSEN1; Tyrobp / vs. APP/PSEN1 and g APP/PSEN1; Tyrobp / vs. APP/PSEN1; Tyrobp +/. RNA sequencing was performed on a total of 23 samples comprising of both male and female mice (n = 7–8 samples per genotype). All analyses were corrected for sex effect. Differential gene expression threshold was set at fold change ≥1.2 and false discovery rate (FDR) <0.1. (See Suppl. 3 and 4 for full list of differentially expressed genes)
Fig. 6
Fig. 6
Gene enrichment analysis summary for prefrontal cortex of 4-month-old APP/PSEN1;Tyrobp / , APP/PSEN1; Tyrobp +/ and APP/PSEN1 mice at suggests potential molecular mechanisms associated with TYROBP deficiency. a Schematic overview of comparisons between mouse groups. b Enrichment analysis and selected GO terms (DAVID) and diseases and functions (Ingenuity Pathway Analysis) in APP/PSEN1; Tyrobp / vs. APP/PSEN1, c in APP/PSEN1; Tyrobp +/ vs. APP/PSEN1, d in APP/PSEN1; Tyrobp / vs. in APP/PSEN1; Tyrobp +/. Enrichments shown were selected for known or suspected relevance to AD pathophysiology. Gene set enrichment threshold was set at p value <0.05. (See Suppl. 5 for full list of enrichments)
Fig. 7
Fig. 7
Computational analysis of a current pharmacopeia database identified compounds that would be predicted to cause up- or down-regulation of TYROBP expression. a Compounds were scored and ranked according to their associated TYROBP expression fold change, and then used as the basis for a secondary enrichment analysis to identify drug targets that associate with up- or down-regulation of TYROBP. Top 10 compounds that b up-regulate and c down-regulate TYROBP are shown. Drug targets enriched among compounds that d up-regulate, and e down-regulate TYROBP are shown

References

    1. Arisi I, Mara D, Brandi R, Felsani A, Capsoni S, Drovandi G, Felici G, Weitschek E, Bertolazzi P, Cattaneo A. Gene expression biomarkers in the brain of a mouse model for Alzheimer’s disease: mining of microarray data by logic classification and feature selection. J Alzheimers Dis. 2011;24:721–738. - PubMed
    1. Bakker AB, Hoek RM, Cerwenka A, Blom B, Lucian L, McNeil T, Murray R, Phillips LH, Sedgwick JD, Lanier LL. DAP12-deficient mice fail to develop autoimmunity due to impaired antigen priming. Immunity. 2000;13:345–353. doi: 10.1016/S1074-7613(00)00034-0. - DOI - PubMed
    1. Barnes CA. Memory deficits associated with senescence: a neurophysiological and behavioral study in the rat. J Comp Physiol Psychol. 1979;93:74–104. doi: 10.1037/h0077579. - DOI - PubMed
    1. Benarroch EE. Microglia: multiple roles in surveillance, circuit shaping, and response to injury. Neurology. 2013;81:1079–1088. doi: 10.1212/WNL.0b013e3182a4a577. - DOI - PubMed
    1. Benitez BA, Jin SC, Guerreiro R, Graham R, Lord J, Harold D, Sims R, Lambert J-C, Gibbs JR, Bras J, Sassi C, Harari O, Bertelsen S, Lupton MK, Powell J, Bellenguez C, Brown K, Medway C, Haddick PC, van der Brug MP, Bhangale T, Ortmann W, Behrens T, Mayeux R, Pericak-Vance MA, Farrer LA, Schellenberg GD, Haines JL, Turton J, Braae A, Barber I, Fagan AM, Holtzman DM, Morris JC, Williams J, Kauwe JSK, Amouyel P, Morgan K, Singleton A, Hardy J, Goate AM, Cruchaga C. Missense variant in TREML2 protects against Alzheimer’s disease. Neurobiol Aging. 2014;35:1510.e19–1510.e26. doi: 10.1016/j.neurobiolaging.2013.12.010. - DOI - PMC - PubMed

Publication types

Substances