

ELLIPSOID ZONE MAPPING AND OUTER RETINAL ASSESSMENT IN STARGARDT DISEASE
- PMID: 28613213
- PMCID: PMC5718981
- DOI: 10.1097/IAE.0000000000001716
ELLIPSOID ZONE MAPPING AND OUTER RETINAL ASSESSMENT IN STARGARDT DISEASE
Abstract
Purpose: To quantify and correlate ellipsoid zone and photoreceptor outer segment changes with visual acuity in Stargardt disease.
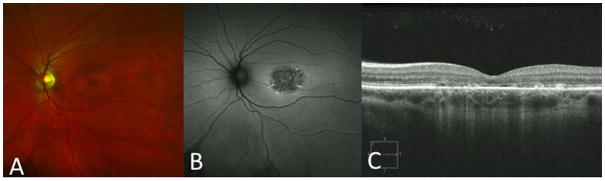
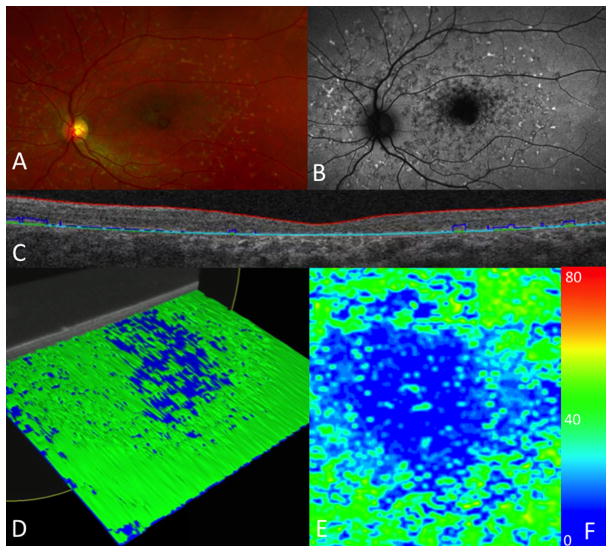
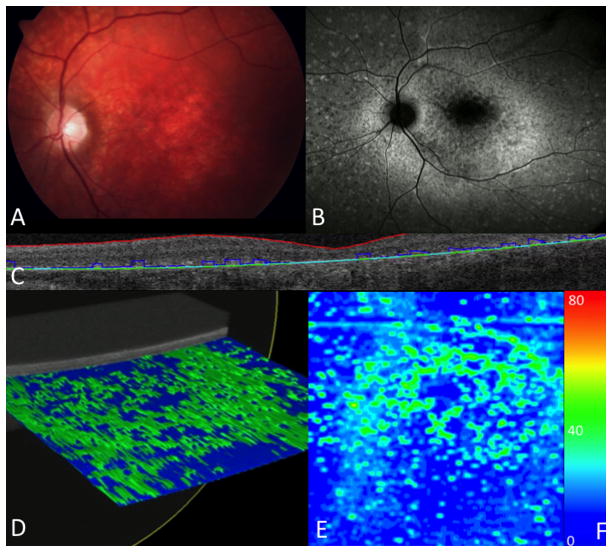
Methods: An institutional review board-approved study of 32 eyes with Stargardt disease was performed. After spectral domain optical coherence tomography, the macular cube was exported into a novel analysis tool and volumetric assessment from the ellipsoid zone to the retinal pigment epithelium was performed. Using this information, mapping was completed with en face representation of the height between the ellipsoid zone and retinal pigment epithelium. This analysis provided quantification of ellipsoid zone and photoreceptor outer segments, including atrophy (ellipsoid zone to retinal pigment epithelium thickness = 0 μm) and attenuation (ellipsoid zone to retinal pigment epithelium thickness <20 μm). These parameters were compared with visual acuity and controls (n = 12 eyes).
Results: Visual acuity ranged from 20/30 to 20/250. The central foveal B-scan area of ellipsoid and photoreceptor outer segments was significantly less than controls (0.13 ± 0.05 mm vs. 0.17 ± 0.03 mm, respectively, P = 0.0074). The central foveal B-scan mean thickness measured 22.52 ± 9.0 μm in Stargardt versus 30.0 ± 5.08 μm (P = 0.0096). Atrophy and attenuation were significantly higher in Stargardt patients (22% vs. 1%, P = 0.005 and 43% vs. 1%, P = 0.0002). Visual acuity directly correlated with ellipsoid zone/outer segment volume (R = 0.57, P < 0.005) and inversely correlated with attenuation and atrophy (R = -0.53 and -0.57; P < 0.005 for all).
Conclusion: Eyes with Stargardt disease frequently have significant disruption of the ellipsoid zone and outer segments. This degenerative change was successfully quantified with a novel assessment platform and identified correlates with visual function. This software provides the opportunity for quantitative assessment and possible longitudinal surveillance.
Figures
Comment in
-
Reply.Retina. 2019 Jun;39(6):e26. doi: 10.1097/IAE.0000000000002540. Retina. 2019. PMID: 30973441 No abstract available.
-
Correspondence.Retina. 2019 Jun;39(6):e25-e26. doi: 10.1097/IAE.0000000000002539. Retina. 2019. PMID: 31083003 No abstract available.
References
-
- Stargardt K. Uber familiar progressive degeneration in der makulagegend des auges. Albrecht von Graefes Arch Klin Exp Ophthalmol. 1909;71:534–50.
-
- Bither PP, Berns LA. Stargardt’s disease: a review of the literature. J Am Optom Assoc. 1988;59:106–11. - PubMed
-
- Fishman GA. Fundus flavimaculatus. A clinical classification. Arch Ophthalmol. 1976;94:2061–7. - PubMed
-
- Haji AS, Hirose T. Stargardt-fundus flavimaculatus: recent advancements and treatment. Semin Ophthalmol. 2013;28(5–6):372–6. - PubMed
-
- Wirtutscg MG, Ergun E, Hermann B, et al. Ultrahigh resolution optical coherence tomography in macular dystrophy. Am J Ophthalmol. 2005;140:976–83. - PubMed
MeSH terms
Grants and funding
LinkOut - more resources
Full Text Sources
Other Literature Sources
Medical
Research Materials
