. 2017 Sep;105(5):721-740.
doi: 10.1111/mmi.13731. Epub 2017 Jul 3.

A conserved coiled-coil protein pair focuses the cytokinetic Z-ring in Caulobacter crescentus

Affiliations

A conserved coiled-coil protein pair focuses the cytokinetic Z-ring in Caulobacter crescentus

Selamawit Abi Woldemeskel et al. Mol Microbiol. 2017 Sep.

Abstract

The cytoskeletal GTPase FtsZ assembles at midcell, recruits the division machinery and directs envelope invagination for bacterial cytokinesis. ZapA, a conserved FtsZ-binding protein, promotes Z-ring stability and efficient division through a mechanism that is not fully understood. Here, we investigated the function of ZapA in Caulobacter crescentus. We found that ZapA is encoded in an operon with a small coiled-coil protein we named ZauP. ZapA and ZauP co-localized at the division site and were each required for efficient division. ZapA interacted directly with both FtsZ and ZauP. Neither ZapA nor ZauP influenced FtsZ dynamics or bundling, in vitro, however. Z-rings were diffuse in cells lacking zapA or zauP and, conversely, FtsZ was enriched at midcell in cells overproducing ZapA and ZauP. Additionally, FtsZ persisted at the poles longer when ZapA and ZauP were overproduced, and frequently colocalized with MipZ, a negative regulator of FtsZ polymerization. We propose that ZapA and ZauP promote efficient cytokinesis by stabilizing the midcell Z-ring through a bundling-independent mechanism. The zauPzapA operon is present in diverse Gram-negative bacteria, indicating a common mechanism for Z-ring assembly.


Conflict of interest statement

CONFLICTS OF INTEREST

The authors declare that no conflicts of interest exist.

Figures

Figure 1
Figure 1. ZapA and ZauP contribute to efficient cytokinesis
A. Genome organization around the zapA gene as annotated in the C. crescentus CB15 and NA1000 genomes. zauP and zapA are organized in an operon, with transcriptional start sites upstream of zauP. B. Probability of coiled-coil formation for ZauP (encoded by CCNA_03357) and E. coli ZapB using COILS prediction. C. Representative phase contrast images of the indicated strains. Bar = 2 µm. D. Cell length distribution of cells of the indicated genetic backgrounds. For WT, 3 biological replicates of a single strain (EG864) were combined. For ΔzapA (EG1080, EG1081, EG1082), ΔzauP (EG971, EG972, EG973), and ΔzauPzapA (EG974, EG975, EG976), data from 3 independently created deletion clones of each are plotted. Each data point represents the length of an individual cell. Grey lines = mean, bars = standard deviation (SD). n = 1531 to 2395 cells. Significant differences between the mean cell length of each strain and WT control determined using ANOVA with Dunnett’s Multiple Comparison post-test. ***: p < 0.001. E. Mean length with SD for each genetic background calculated from the data in D. F. Immunoblot against lysates for the indicated strains using antisera for the indicated proteins. Arrow indicates ZauP band and asterisk indicates cross-reacting band. SpmX was used as a loading control. G. Representative phase contrast images of strains overproducing indicated proteins. EV = empty vector. Bar = 2 µm. H. Cell length distributions (mean ± SD) of cells shown in G, n = 244 cells for each. Significant differences between the mean cell length of each strain and EV control determined using ANOVA with Dunnett’s Multiple Comparison post-test. ***: p < 0.001. I. Mean length of each strain calculated from data shown in H. J. Immunoblot against lysates for the indicated strains at the indicated time points using antisera for the indicated proteins.
Figure 2
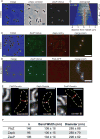
Figure 2. ZauP co-localizes with ZapA and FtsZ at the new cell pole and the division site
A. Fluorescence, phase contrast, and merged images of strain EG992, bearing zauP-venus at its native locus. Bar = 2 µm. B. Demograph showing normalized ZauP-Venus fluorescence intensity as a function of cell length (blue = least intense pixel in each cell, red = most intense pixel in each cell) of a population of cells in A. C. Merged fluorescence and phase contrast images of strain EG894, bearing zapA-mCherry at its native locus and xylose-inducible zauP-venus at the xylX locus. Cells were grown with 0.3% xylose for 1.5 h prior to imaging. Hatched arrows indicate early stalked cells with midcell assemblies of both ZauP-Venus and ZapA-mCherry. Zoomed in image shows ZapA and ZauP co-localize. Bar = 2 µm. D. Merged fluorescence and phase contrast images of strain EG1361, bearing zauP-venus at its native locus and vanillate-inducible FtsZ-CFP at the vanA locus. Cells were grown with 0.5 mM vanillate for 1 h prior to imaging. Images inside box are merged and zoomed-in to show co-localization of the two signals. E. Live-cell PALM imaging of Dendra2 fusions to FtsZ (EG2038), ZapA (EG1956), and ZauP (EG1957). Images are shown in the order of bright-field image (i), ensemble fluorescence image (ii) and PALM image displayed in pseudo color (iii). Approximate cell outlines are indicated by yellow dashed lines. Scale Bars = 1 µm. F. Summary of PALM measurement values.
Figure 3
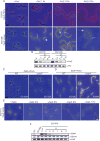
Figure 3. ZauP foci persist upon FtsZ depletion, but require ZapA for formation
A. Merged fluorescence and phase contrast images of ZapA-mCherry (EG700) and ZauP-Venus (EG1006) upon depletion of FtsZ for the indicated amount of time. Arrows indicate midcell rings or foci. Hatched arrows indicate polar foci. Bar = 2 µm. B. Immunoblot against lysates from the cells in A using FtsZ antisera (top) or HU antisera (bottom). C. Merged phase contrast and fluorescence images of ZapA-Venus in WT background (EG1094) or in cells lacking zauP (EG1224). D. Merged phase contrast and fluorescence images of ZauP-Venus in WT background (EG798) or in cells lacking zapA (EG954). E. Merged phase contrast and fluorescence images of ZauP-mCherry upon depletion of ZapA in strain EG1414 for the indicated amount of time. F. Immunoblot against lysates from the cells in E using ZapA, SpmX and FtsZ antisera. EG1080 = ΔzapA control.
Figure 4
Figure 4. ZapA interacts with ZauP and FtsZ, but does not affect FtsZ assembly in vitro
A. E. coli BTH101 cells bearing plasmids for expression of T18 and T25 fusions to the indicated proteins plated on media with IPTG and X-Gal. C: C-terminal fusion, N: N-terminal fusion. B. Colloidal Coomassie-stained SDS-PAGE of equal fractions of supernatant (S) and pellet (P) samples after co-sedimentation of reactions containing the indicated purified proteins ± 10 mM MgCl2. Image is representative of 3 independent experiments. C. Transmission electron micrographs of 5 µM of each of the indicated proteins in HEK50 buffer with 10 mM MgCl2 stained with uranyl formate. Bottom: zoomed images of boxed regions in the top row of images. D. Colloidal Coomassie-stained SDS-PAGE of equal fractions of supernatant (S) and pellet (P) samples after co-sedimentation of reactions containing the indicated purified proteins ± GMP-CPP. E. GTP hydrolysis over time by 4 µM FtsZ in the absence or presence of 16 µM ZapA and/or ZauP. F. Electron micrographs of indicated 4 µM FtsZ and 8 µM ZapA and ZauP in HEK50 buffer with 2 mM GTP and 2.5 mM MgCl2 stained with uranyl formate.
Figure 5
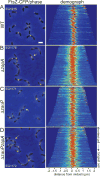
Figure 5. The Z-ring is dispersed in cells lacking ZapA, ZauP or both
A – D. Merged phase contrast (blue) and fluorescence (yellow) images and demographs (n = 400, maximum cell length = 4.5 µm) of WT (EG1215) ΔzapA (EG1176), ΔzauP (EG1171), and ΔzapAzauP (EG1172) cells expressing vanillate-inducible ftsZ-cfp from the vanA locus for 1 h. Arrows indicate examples of dispersed rings in cells of normal length.
Figure 6
Figure 6. FtsZ localizes at the poles longer, but focuses more rapidly at midcell when ZapA and ZauP are overproduced
Demographs of FtsZ-CFP in the indicated strains at the indicated times post-synchrony. Cells overproducing ZauP (EG1174), ZapA (EG1173), both (EG913), or neither (EG1175) for 4 h and expressing ftsZ-cfp for 1 h were synchronized and grown without inducer and imaged at the indicated time points post-synchrony. Maximum cell lengths used for demographs at t=12, 24, 36, 48, 60, and 72 min are 3, 3, 4, 5.1, 5.1, and 5.3 µm, respectively. n=300 for t=12 and 36, n=200 for t=24 and 72, n=275 for t=48, n=350 for t=60.
Figure 7
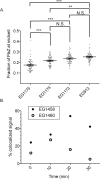
Figure 7. FtsZ is enriched at midcell when ZapA and ZauP are overproduced
A. Fraction of FtsZ-CFP at midcell at t = 72 min post-synchrony using cells from the experiment in Figure 6. EG1174, EG1173, EG913, and EG1175 are overproducing ZauP, ZapA, both, or neither protein, respectively. Significant differences between the mean signal of each strain and empty vector control determined using ANOVA with Dunnett’s Multiple Comparison post-test. ***: p < 0.001, **: p < 0.01. B. Percent of cells that have MipZ colocalized with FtsZ at the cell pole for the indicated strains imaged at the indicated time points after synchrony. Representative images are shown in Supporting Information Figure S12. EG1458 is overproducing ZapA and ZauP from a high copy plasmid and EG1460 is an empty vector control. Both strains express mipZ-yfp from the native locus and ftsZ-cfp from the vanA locus for 1 h. 0 min: n=142 for EG1458 and n=144 for EG1460; 10 min: n=122 for EG1458 and n=117 for EG1460; 20 min: n=178 for EG1458 and n=162 for EG1460; 30min: n= 148 for EG1458 and EG1460.
Figure 8
Figure 8. Bundling-independent Z-ring focusing by ZapA-ZauP
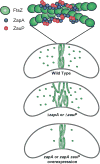
ZapA interacts with itself, ZauP, and FtsZ at sites of FtsZ assembly, providing a stable platform for Z-ring assembly. When ZapA and/or ZauP are absent, this stable platform is absent, leading to dispersion of the Z-ring. When zapA is overexpressed alone or with zauP, FtsZ is more stable and is enriched at midcell.

References

    1. Bowman GR, Comolli LR, Gaietta GM, Fero M, Hong S-H, Jones Y, et al. Caulobacter PopZ forms a polar subdomain dictating sequential changes in pole composition and function. Molecular Microbiology. 2010;76:173–189. - PMC - PubMed
    1. Buss J, Coltharp C, Huang T, Pohlmeyer C, Wang S-C, Hatem C, Xiao J. In vivo organization of the FtsZ-ring by ZapA and ZapB revealed by quantitative super-resolution microscopy. Molecular Microbiology. 2013;89:1099–1120. - PMC - PubMed
    1. Buss J, Coltharp C, Shtengel G, Yang X, Hess H, Xiao J. A multi-layered protein network stabilizes the Escherichia coli FtsZ-ring and modulates constriction dynamics. PLoS Genet. 2015;11:e1005128. - PMC - PubMed
    1. Buss J, Peters NT, Xiao J, Bernhardt TG. ZapA and ZapB form an FtsZ-independent structure at midcell. Molecular Microbiology. 2017;104:652–663. - PMC - PubMed
    1. Caspi R, Altman T, Billington R, Dreher K, Foerster H, Fulcher CA, et al. The MetaCyc database of metabolic pathways and enzymes and the BioCyc collection of Pathway/Genome Databases. Nucleic Acids Res. 2014;42:D459–71. - PMC - PubMed

MeSH terms