. 2017 Jun 29;546(7660):662-666.
doi: 10.1038/nature22795. Epub 2017 Jun 14.

Human fetal dendritic cells promote prenatal T-cell immune suppression through arginase-2

Affiliations

Human fetal dendritic cells promote prenatal T-cell immune suppression through arginase-2

Naomi McGovern et al. Nature. .

Abstract

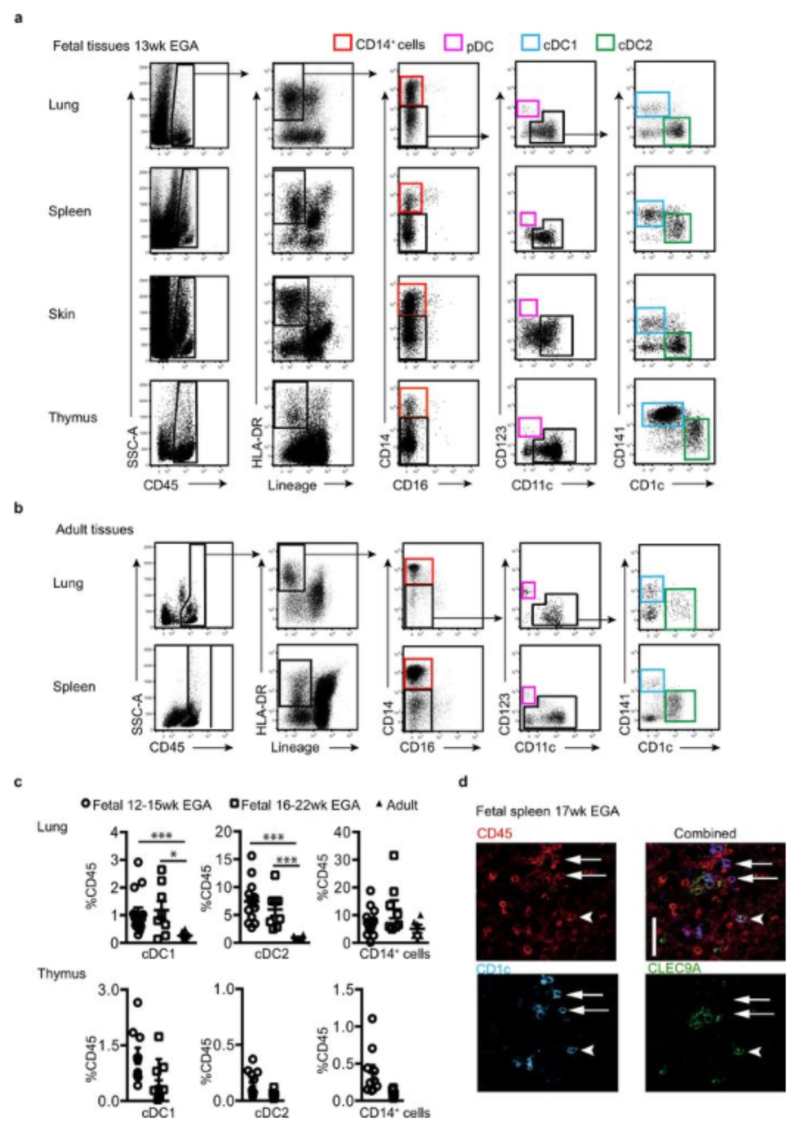
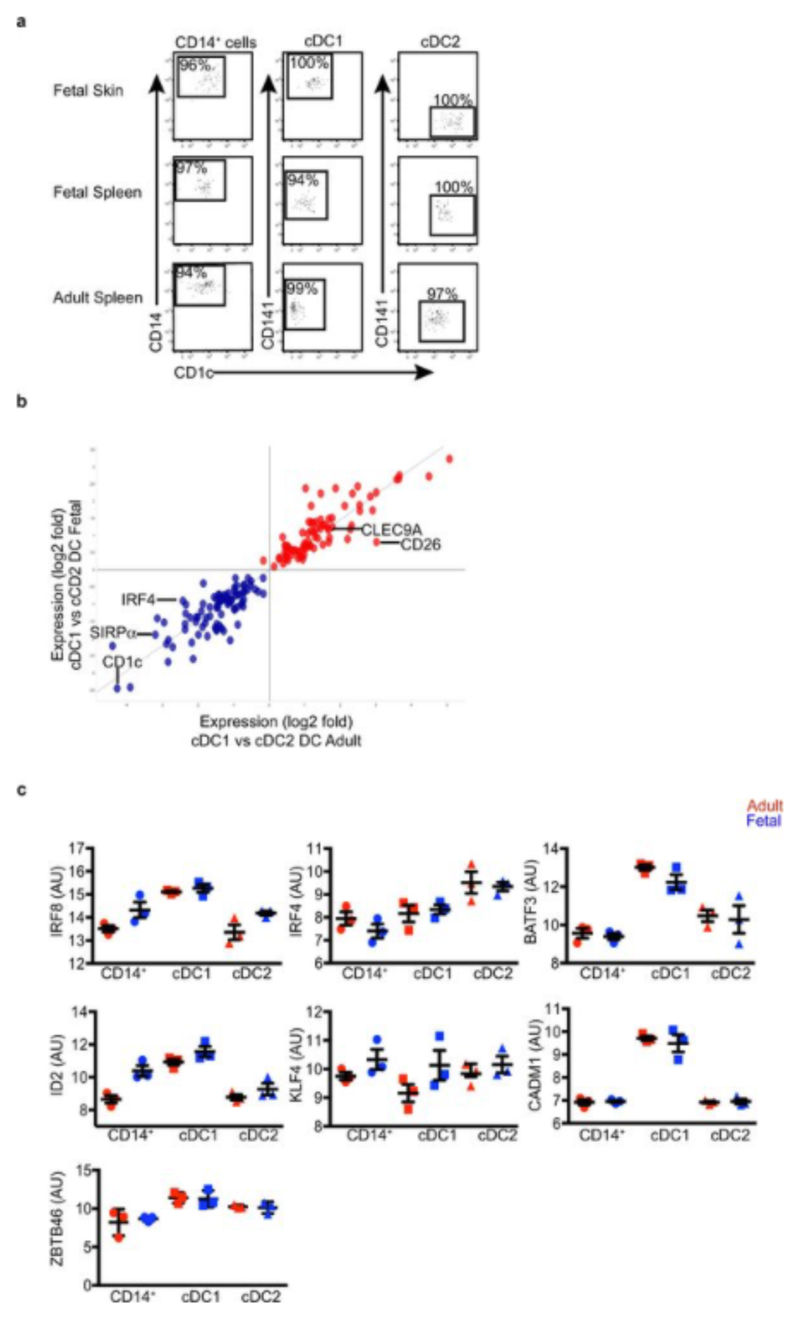
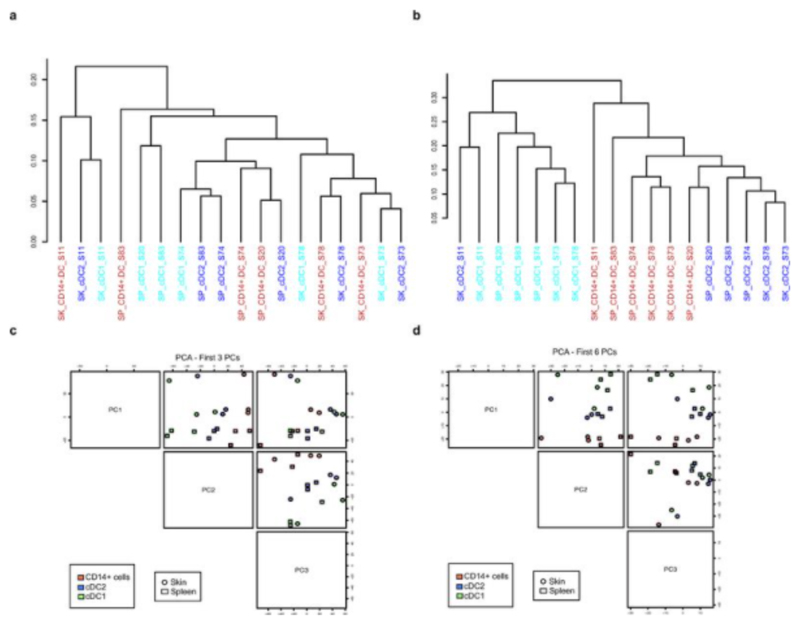
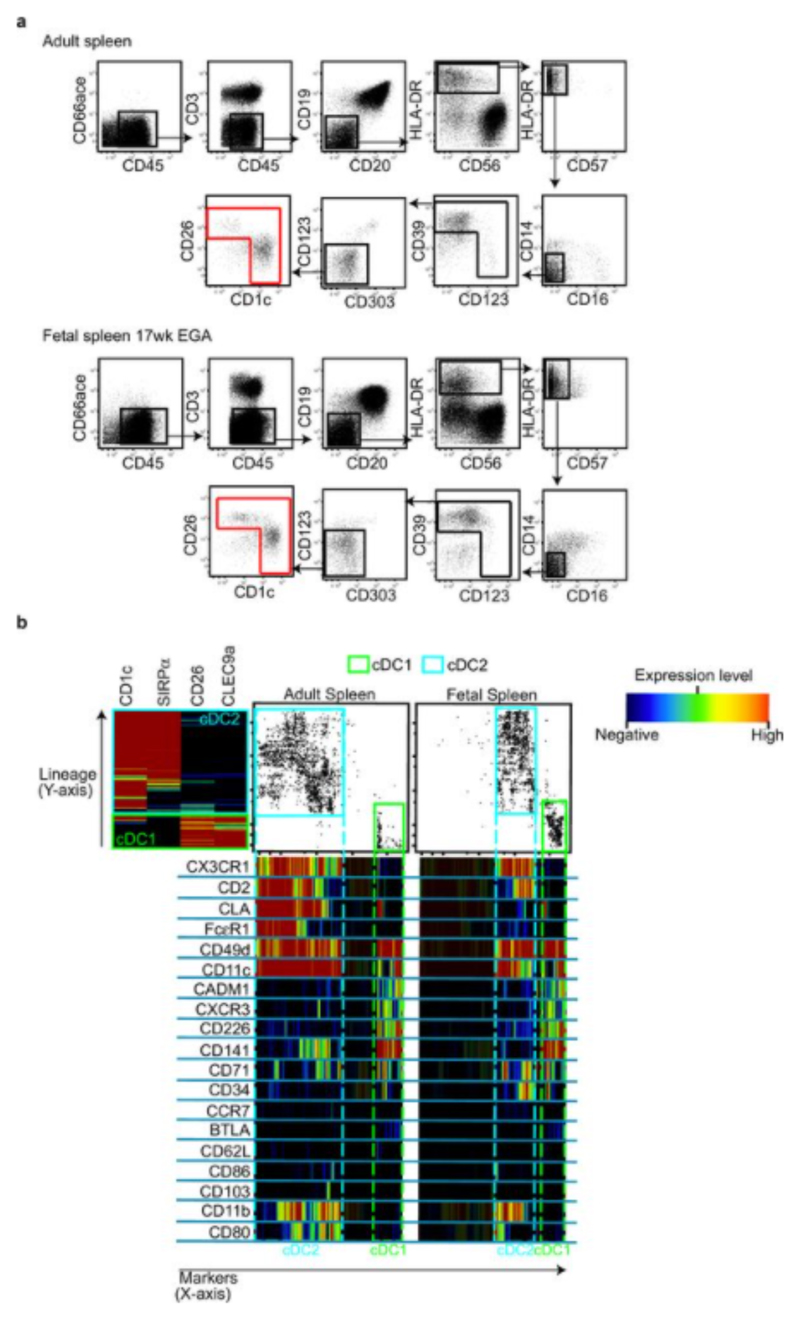
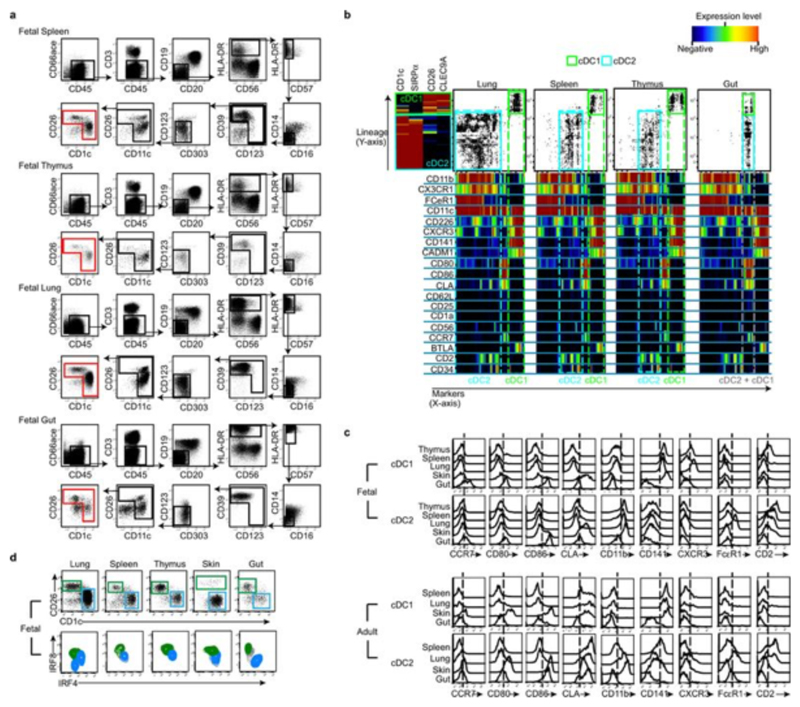
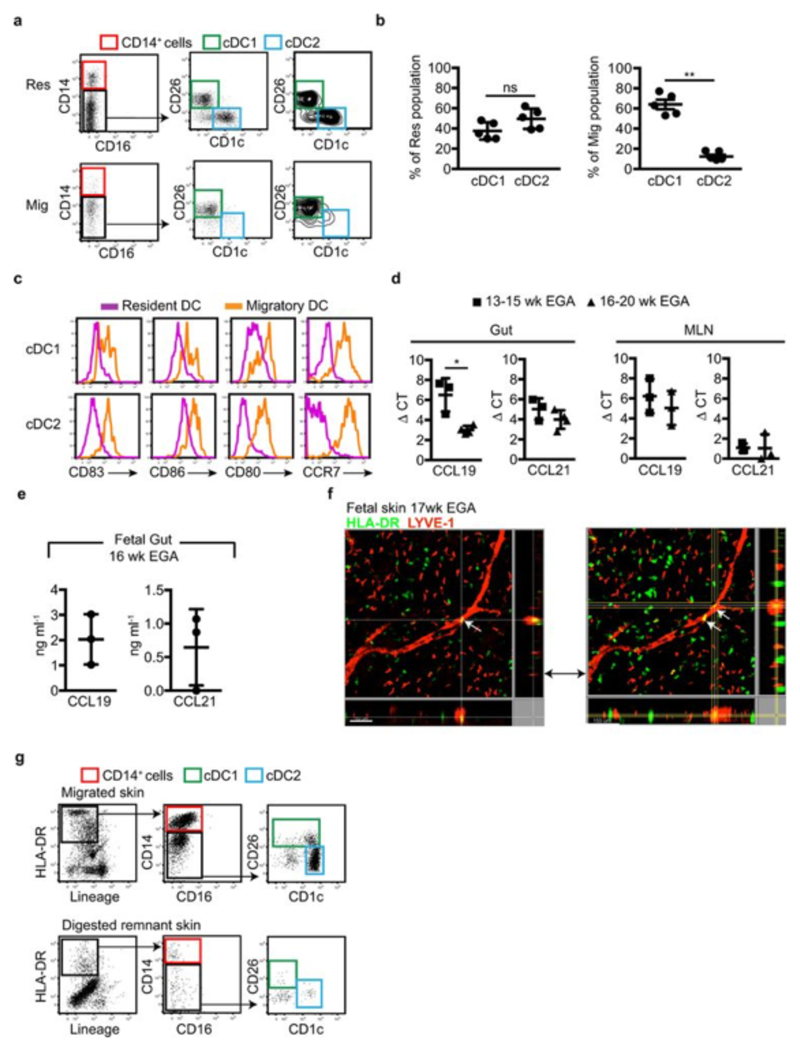
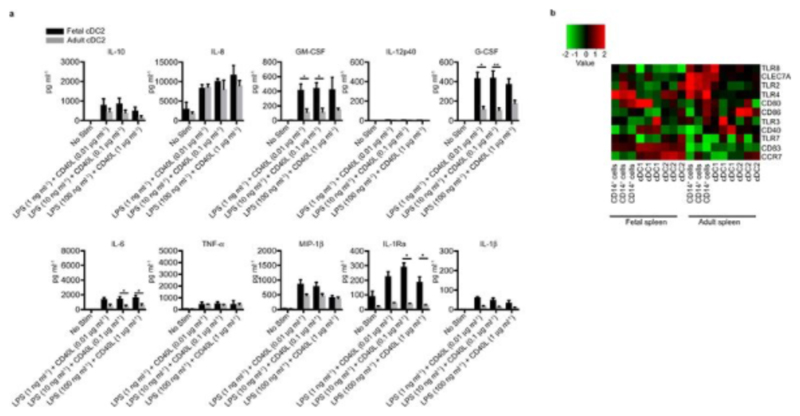
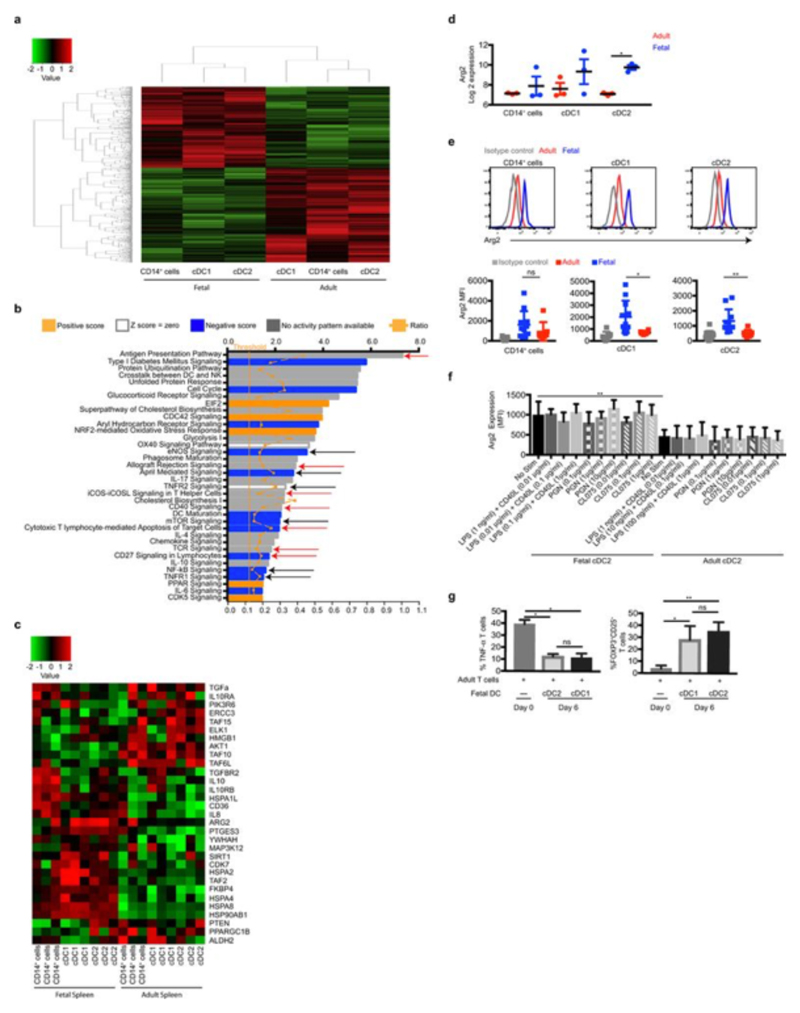
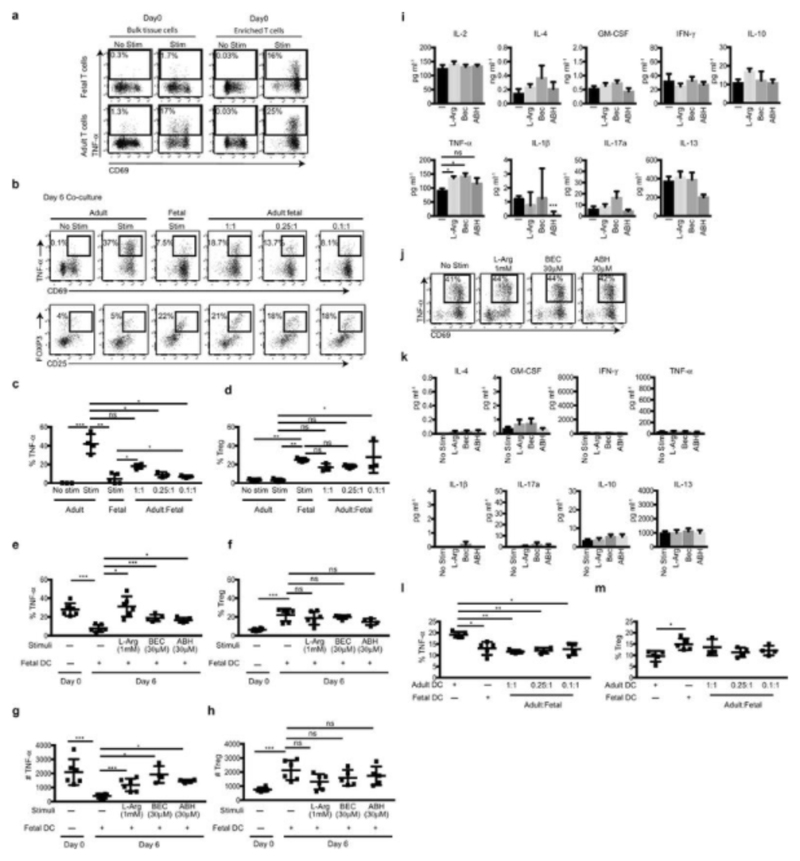
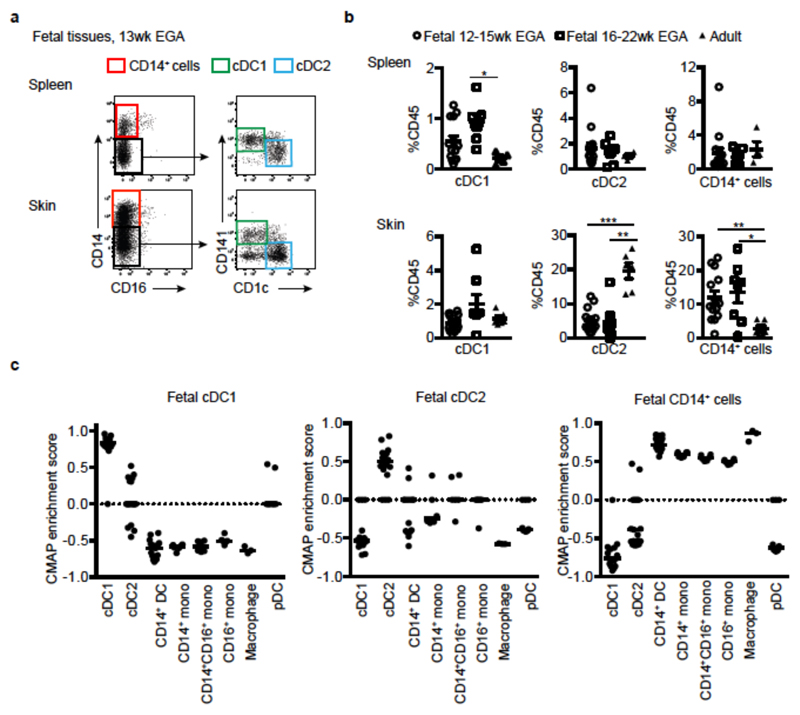
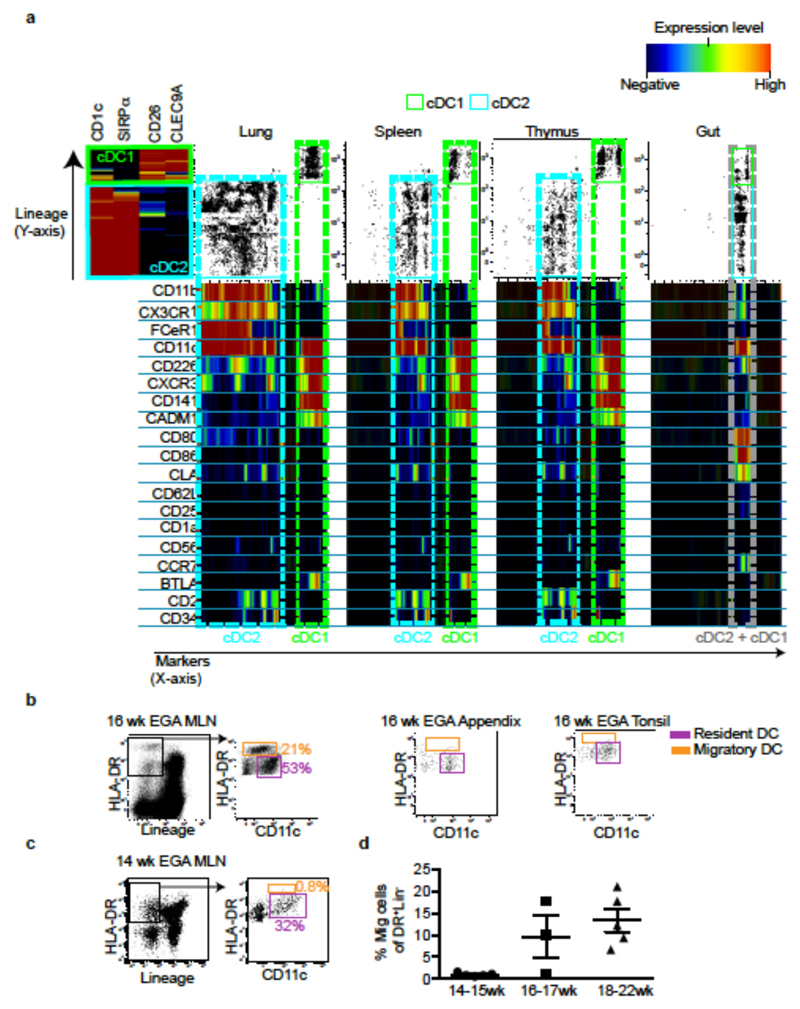
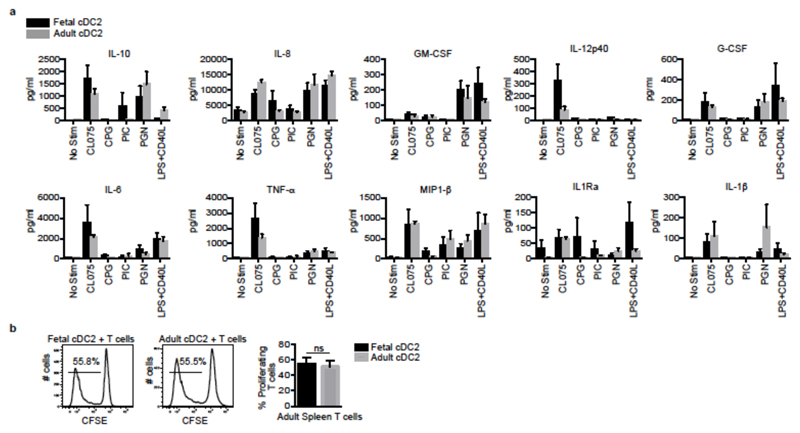
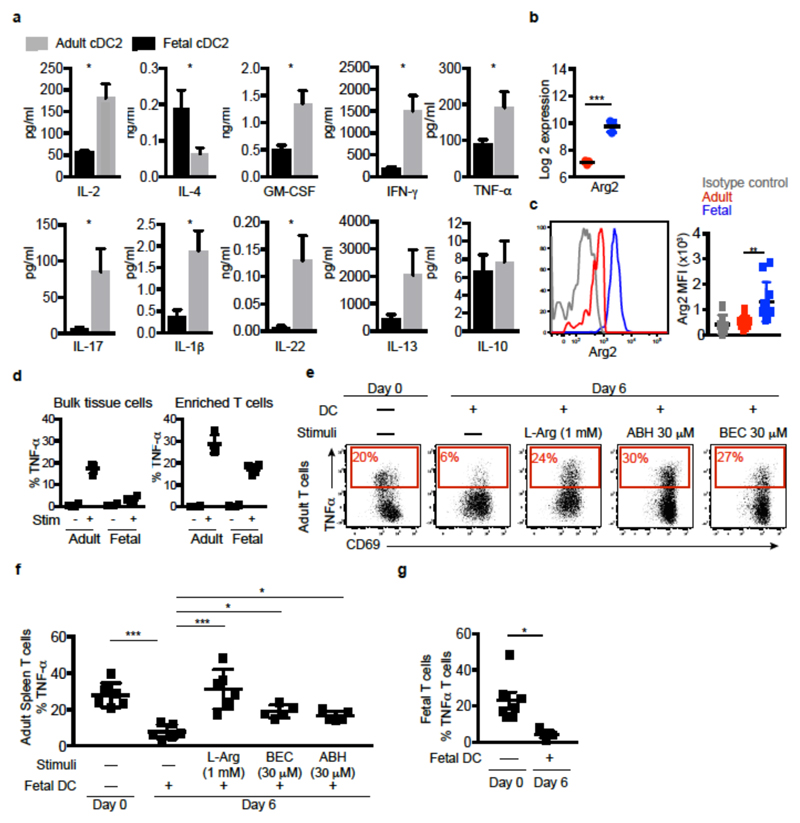
During gestation the developing human fetus is exposed to a diverse range of potentially immune-stimulatory molecules including semi-allogeneic antigens from maternal cells, substances from ingested amniotic fluid, food antigens, and microbes. Yet the capacity of the fetal immune system, including antigen-presenting cells, to detect and respond to such stimuli remains unclear. In particular, dendritic cells, which are crucial for effective immunity and tolerance, remain poorly characterized in the developing fetus. Here we show that subsets of antigen-presenting cells can be identified in fetal tissues and are related to adult populations of antigen-presenting cells. Similar to adult dendritic cells, fetal dendritic cells migrate to lymph nodes and respond to toll-like receptor ligation; however, they differ markedly in their response to allogeneic antigens, strongly promoting regulatory T-cell induction and inhibiting T-cell tumour-necrosis factor-α production through arginase-2 activity. Our results reveal a previously unappreciated role of dendritic cells within the developing fetus and indicate that they mediate homeostatic immune-suppressive responses during gestation.


Figures

Extended Data Fig. 1
Extended Data Fig. 1. Identification of APC subsets in fetal and adult tissues.
Representative flow plots of gating strategy used to identity APC subsets in fetal and adult tissues. a, Gating strategy used to identify APC populations within the live CD45+, HLA-DR+Lin- gate; CD14+ cells (red gate), pDC (pink gate), cDC1 (blue gate) and cDC2 (green gate) in fetal lung, spleen, skin and thymus. b, Gating strategy used to identify CD14+ cells (red gate), pDC (pink gate), cDC1 (blue gate) and cDC2 (green gate) in adult lung and spleen. c, Abundance of APC plotted as a percentage of live CD45+ mononuclear cells. Cell abundance was determined in fetal lung and thymus at 2 time points within the 2nd trimester (12-15 wk EGA (circle, lung n=13, thymus=9) and 16-22wk EGA (square, lung n=8, thymus n=8) and compared with adult tissues (triangle, lung n=8). *P<0.05, ***P<0.001, Mann-Whitney test. d, Pseudo-color images of whole-mount fetal spleen (17wk EGA) immunolabeled for CD45 (red), CD1c (blue), and CLEC9A (green). White arrows highlight cDC2 (CD45+CD1c+CLEC9A-), white arrow head highlights cDC1 (CD45+CD1c+CLEC9A+). Scale bar represents 5μm. Representative image of n=3 experiments shown.
Extended Data Fig. 2
Extended Data Fig. 2. Comparison of the transcriptomes and phenotypes of fetal and adult APC subsets.
a, Confirmation of post-sort APC subset purity. Representative dot plots demonstrating cell purity after using FACS to isolate indicated APC subsets from fetal skin and spleen (18-22wk EGA), and adult spleen. n=4. b, Scatter plot of the log fold change in gene expression of cDC2 vs cDC1 from fetal and adult skin and spleen. R score = 0.92 and p-value < 2.2x10⁻¹⁶. Colors indicate genes upregulated (red) or downregulated (blue) in fetal and adult cDC1 relative to cDC2. c, Scatterplots demonstrating the expression profile of transcription factors important for APC development, conserved across fetal (blue) and adult (red) spleen.
Extended Data Fig. 3
Extended Data Fig. 3. Fetal APC populations cluster based on subset after the removal of tissue specific probes.
a-d, Hierarchical clustering and PCA data before (a, c) and after (b, d) removal of tissue specific probes. It is clear from the hierarchical clustering (a) that there is strong tissue imprinting in the cells that overwhelms subtype specificity. Upon the removal of tissue specific probes, cells now cluster based on subtype (b). Also clearly from the PCA plots (c, d), we can see that prior to tissue gene removal (c), PC1 is entirely determined by tissue. However, upon tissue specific probe removal (d), PC1 is now devoted to cell type. We identified these tissue-specific genes by finding DEGs between the pools of all cells from the different tissues (all spleen vs. all skin).
Extended Data Fig. 4
Extended Data Fig. 4. Fetal and adult spleen cDC have similar phenotypes.
a, b, Characterization of cDC1 (green gate) and cDC2 (cyan gate) across adult and fetal spleen using CyTOF and one-Sense algorithm. a, Representative gating strategy used to select input population (red gate) for One-Sense analysis from fetal (17wk EGA) and adult spleen samples. b, Representative data of fetal and adult spleen cDC analyzed using the one-Sense algorithm. The lineage dimension included CD1c and SIRPα as cDC2 markers, CD26 and CLEC9A as cDC1 markers. The marker dimension includes all the other non-lineage markers of the CyTOF panel. Frequency heat maps of markers expression are displayed for both dimensions. The expression of markers by both adult and fetal spleen cDC1 (green) and cDC2 (cyan) is highlighted with the dashed gates. Representative data from n=5 experiments.
Extended Data Fig. 5
Extended Data Fig. 5. Phenotypic characterisation of fetal spleen, thymus, lung and gut cDC.
a, Representative gating strategy used to select input population (red gate) for One-Sense analysis from fetal spleen, thymus, lung and gut (17wk EGA). b, Characterization of cDC1 (green gate) and cDC2 (cyan gate) across fetal lung, spleen, thymus and gut using CyTOF and one-Sense algorithm. The lineage dimension included CD1c and SIRPα as cDC2 markers, CD26 and CLEC9A as cDC1 markers. The marker dimension includes all the other non-lineage markers of the CyTOF panel. Frequency heat maps of markers expression are displayed for both dimensions. The expression of markers by fetal cDC1 (green) and cDC2 (cyan) subsets are highlighted with the dashed gates. Representative data from n=5 experiments. c, Histograms displaying surface markers differentially expressed across fetal organs (17 wk EGA) but conserved from fetus to adult. The histograms are generated from CyTOF data (generated as described above). Data is representative of n=5 experiments. d, Fetal cDC1 (green gate) and cDC2 (blue gate) populations were identified within each organ based on their CD26 and CD1c expression (top panel) by flow cytometry analysis. Using the gates in the top panel to select fetal cDC1 (green contours) and cDC2 (blue contours), intracellular expression of IRF8 and IRF4 was determined by flow cytometry. Representative data. n=3.
Extended Data Fig. 6
Extended Data Fig. 6. Fetal cDC migrate to lymph nodes.
a, Representative plot of CD14+ cells (red gate), cDC1 (green gate) and cDC2 (blue gate) identified within the MLN-resident (Res) DC gate (top panel) and migratory (Mig) DC gate (bottom panel), from a 16wk EGA sample. b, Abundance of cDC1 and cDC2 plotted as a percentage of the total cDC within the resident (left plot) and migratory (right plot) fraction within the MLN from 16-22wk EGA n=5. c, Histograms comparing the expression of activation markers by resident (pink) and migratory (orange) cDC1 and cDC2. n=3. d, RNA from fetal gut and MLN were analysed for the expression of CCL19 and CCL21 from early (13- 15wk EGA) and late (16-20wk EGA) samples. n=3. e, Detection of the proteins CCL19 and CCL21 from lysed fetal gut cells by ELISA. f, Whole-mount immune-fluorescence microscopy of 17wk EGA fetal skin from 2 plains of view. Lymphatic vessels are labeled for LYVE-1 (red), APC are labeled for HLA-DR (green). White arrow indicates APC within lymphatic vessels. Scale bar represents 100μm (left image) and 150μm (right image). Representative image of n=3 experiments shown. g, Gating strategy used to identify CD14+ cells (red gate), cDC1 (green gate) and cDC2 (blue gate) within the supernatant from fetal skin explant left for 48 hours in culture and the digested remnant. Representative plots of n=3 experiments shown.
Extended Data Fig. 7
Extended Data Fig. 7. Fetal cDC are sensitive to low concentrations of TLR agonist stimuli.
a, Sort-purified fetal liver and adult spleen cDC2 were cultured with indicated TLR agonists for 18hrs. Cytokines produced were measured in the supernatants by Luminex assay. b, Heatmap of fetal and adult spleen APC populations of selected genes, including pathogen recognition receptors and co-stimulatory molecules. Heat map shows the row-based z-score normalized gene expression intensities.
Extended Data Fig. 8
Extended Data Fig. 8. Fetal cDC promote Treg induction.
a, b, Flow cytometry expression analysis of Tregs after 6 day co-culture of adult spleen T cells with fetal (n=5) or adult (n=4) spleen cDC2. a, b, The frequency of FOXP3+CD25+ Treg cells (a, red gate) and representative histograms showing intensity of CD127 and CTLA-4 expression by Tregs (red histograms) and respective isotype controls (grey histograms) are shown (b). c, Composite results showing the frequency of Treg cells plotted as percentage of CD4+ T cells, n≥4. d, Bar graph of proliferating CD8+ T cells after 6 days of adult spleen pan T cell co-culture with fetal (black, n=4) or adult (grey, n=4) spleen cDC2. Proliferation was measured by CFSE dilution. e, Proliferation of isolated adult spleen CD8+ T cells, after co-culture with fetal spleen cDC2 for 6 days. Left, representative histograms showing CFSE dilution by CD8+ T cells on day 0 (grey histogram) compared to day 6 with (red histogram) or without (black histogram) CD4+ T cell depletion. Right, cumulative data (n=4). Bar graphs show mean±s.e.m. *P<0.05, **P<0.01, Mann-Whitney test. f, Fetal spleen cDC1 and cDC2 share immune-suppressive properties. Cytokine detected in co-culture supernatants (mean±s.e.m) after T cell co-culture with fetal cDC1 or cDC2 or adult cDC2 (n=5). Statistical significance represents comparisons between indicated conditions measured by one-way Anova, multiple comparisons test. * P<0.05, ** P<0.01, ***P<0.001, ns (not significant) P>0.05.
Extended Data Fig. 9
Extended Data Fig. 9. Gene expression comparison between fetal and adult APC.
a, Heatmap showing the row-based z-score normalized gene expression intensities of 3,909 differentially expressed genes between fetal and adult APC. DEGs were identified using t-test with BH multiple testing corrected p-value of <0.05. The genes and cell populations were clustered using Pearson correlation distance measure and Complete Linkage method. b, Ingenuity™ Pathway Analysis (IPA) of the differentially-expressed genes (DEGs), >1.5 fold change, between fetal and adult APC. The bars indicate the p values (-log10) for pathway enrichment. The yellow squares indicate the ratio of the number of up- or down-regulated genes mapped to the enriched pathway, to the total number of molecules on that pathway represented by the dashed yellow line. The horizontal solid yellow line corresponds to the >1.5 fold change threshold. Red arrows highlight pathways involved in DC:T cell interactions, black arrows highlight pathways associated with iNOS/TNF-α signaling. c, Heatmap of immune-modulatory genes involved in cellular metabolism, immune suppression and the iNOS/TNF-α signaling. Heat map shows the row-based z-score normalized gene expression intensities. d, e Microarray (d) and flow cytometry (e) data demonstrating arginase-2 expression by fetal (blue, n=11) and adult (red, n=7) APC subsets. Isotype control, grey histogram and square on scatterplot (n=7). Mean frequencies ± s.e.m. f, Fetal and adult cDC2 arginase 2 expression is not mediated by TLR stimulation. Fetal liver and adult spleen cDC2 were sort-purified and stimulated with the indicated TLR agonists or DMSO control for 18hrs. cDC2 arginase 2 (Arg 2) expression was measured by flow cytometry. Mean frequencies ± s.e.m. One-way Anova, multiple comparisons test. ** P<0.01
Extended Data Fig. 10
Extended Data Fig. 10. Fetal cDC regulate T cell TNF-α production.
a, Ex-vivo splenocyte T cell (bulk tissue cells) and enriched spleen T cell TNF-α production, representative plots of n=4. b, Ex-vivo co-culture assay where fetal and adult splenocytes were cultured alone or at the indicated ratios of adult:fetal cells (n=3-4) for 6 days. TNF-α+ and Treg cells induction was determined by flow cytometry analysis. c – d, Scatterplots demonstrating the percentage of TNF-α+ T cells and Treg after the culture of splenocytes under the indicated conditions for 6 days. n≥3, mean±s.e.m. Statistical significance represents comparisons between indicated conditions measured by one-way anova, multiple comparisons test. * P<0.05, **P<0.01, ***P<0.001, ns P>0.05. e – h, Scatterplots demonstrating the percentage (e, f) and absolute cell counts (g, h) of TNF-α+ T cells and Treg after o/n culture of adult spleen T cells alone (n=6) or 6 day co-culture with fetal cDC2 in the absence (n=6) or the presence of L-arginine (n=6), ABH (n=4) or BEC (n=5). Statistical significance represents comparisons between indicated conditions measured by one-way Anova, multiple comparisons test. * P<0.05, ***P<0.001, ns P>0.05. i, Fetal DC arginase activity impacts T cell TNF-α production but not other pro-inflammatory cytokines. Cytokine detected in co-culture supernatants after adult spleen T cell co-culture with fetal cDC2 in the absence (n=5) or presence of L-arginine (1mM) (n=5), BEC (30μM) (n=3), ABH (30μM) (n=5) for 6 days (mean ± s.e.m n≥3). Statistical significance represents comparisons between indicated conditions measured by one-way Anova, multiple comparisons test. *P<0.05, **P<0.01 ns P>0.05. j, Adult spleen T cells were cultured overnight with the indicated of L-arginine, BEC and ABH (n=5). Representative flow cytometry of n=3 experiments. k, Cytokines detected in co-culture supernatants after adult spleen T cells were cultured alone (in the absence of DC) for 6 days with or without L-arginine (1mM) (n=5), BEC (30μM) (n=3), ABH (30μM) (n=4) (mean ± s.e.m n≥3). l, m, Fetal spleen cDC (pooled cDC1 and cDC2) and adult spleen cDC2 were cultured alone or in combination at the indicated ratios with adult spleen T cells for 6 days. T cell TNF-α production (k) and the expansion of Tregs (l) were assessed by flow cytometry. Statistical significance represents comparisons between indicated conditions measured by one-way Anova, multiple comparisons test. * P<0.05, ns P>0.05. Each data point in all the scatter plots represents an individual donor and experiment.
Figure 1
Figure 1. Identification of fetal APC.
a, CD14+ cells, cDC1 and cDC2 were identified within fetal spleen and skin by flow cytometry. b, Enumeration of APC subsets within fetal and adult tissues. Mann-Whitney test *P<0.05, **P<0.01, ***P<0.001. Mean±s.e.m. c, CMAP enrichment scores for fetal skin and spleen cDC1, cDC2 and CD14+ cells against all adult blood, skin and spleen APC subsets are shown. Enrichment scores for fetal skin and spleen cDC1, cDC2 and CD14+cells with equivalent adult APC subsets were significant at P<0.0001. a, b Each data point in the scatter plots represents an individual experiment.
Figure 2
Figure 2. Fetal cDC migrate to draining lymph nodes.
a, Characterisation of cDC1 and cDC2 across fetal tissues using CyTOF and one-Sense algorithm (see Methods, representative plots of n=5). b, c Flow cytometry analysis of fetal mesenteric lymph nodes (MLN) at 16wk (b) or 14wk (c) EGA. Within the HLA-DR+Lin- gate (black), MLN- HLA-DRintCD11chi resident DC (pink) are distinguished from HLA-DRhiCD11int migratory DC (orange gate). b, 16wk EGA MLN (left) and fetal appendix and tonsil (right, n=3). d, Enumeration of migratory cDC at indicated time points. Mean±s.e.m. Each data point in the scatter plots represents an individual experiment.
Figure 3
Figure 3. Fetal cDC are responsive to TLR stimulation and induce T cell proliferation.
a, Cytokines in supernatants of fetal and adult cDC2 stimulated for 18 hrs with TLR agonists; CL075 (1μg/ml), CPG (3μM), PI:C (25μg/ml), PGN (10μg/ml), LPS (0.1μg/ml)+CD40L (1μg/ml). Mean±s.e.m, n=4. b, Alloactivation of adult CD4+ T cells by fetal and adult cDC2 after 6 days co-culture. Proliferation was measured by CFSE dilution. Left panel, representative histograms. Right bar graph, cumulative data, n=5. Data shown as mean±s.e.m. ns, not significant (P>0.05), Mann-Whitney test.
Figure 4
Figure 4. Arginase 2+ fetal cDC regulate TNF-α production.
a, Cytokine production by adult T cells after 6 days co-culture with fetal or adult cDC2 (n=5). b, c Expression of arginase-2 gene (b) and protein (c) in cDC2. d, Splenocyte T cell TNF-α production. e, f TNF-α production (red) of stimulated adult T cells, after overnight culture in the absence (Day 0) or presence of cDC2 (Day 6 of co-culture), with or without additional supplementation of L-arginine or arginase inhibitors (ABH or BEC). e, Representative dot plots. f, Cumulative data. g, TNF-α production from stimulated fetal T cells under indicated culture conditions. Data shown as mean±s.e.m. *p<0.05, **p<0.01, ***P<0.001, Mann-Whitney test. Each data point in the scatter plots represents an individual experiment.

Comment in

References

    1. Mold JE, et al. Maternal alloantigens promote the development of tolerogenic fetal regulatory T cells in utero. Science. 2008;322:1562–1565. - PMC - PubMed
    1. Claas FH, Gijbels Y, van der Velden-de Munck J, van Rood JJ. Induction of B cell unresponsiveness to noninherited maternal HLA antigens during fetal life. Science. 1988;241:1815–1817. - PubMed
    1. de Vries JI, Visser GH, Prechtl HF. The emergence of fetal behaviour. II. Quantitative aspects. Early Hum Dev. 1985;12:99–120. - PubMed
    1. Mor G, Cardenas I. The immune system in pregnancy: a unique complexity. Am J Reprod Immunol. 2010;63:425–433. - PMC - PubMed
    1. Campbell DE, Boyle RJ, Thornton CA, Prescott SL. Mechanisms of allergic disease - environmental and genetic determinants for the development of allergy. Clin Exp Allergy. 2015;45:844–858. - PubMed

Publication types

MeSH terms