. 2017 Jun 22;546(7659):549-553.
doi: 10.1038/nature22798. Epub 2017 Jun 14.

BAP1 regulates IP3R3-mediated Ca2+ flux to mitochondria suppressing cell transformation

Affiliations

BAP1 regulates IP3R3-mediated Ca2+ flux to mitochondria suppressing cell transformation

Angela Bononi et al. Nature. .

Abstract

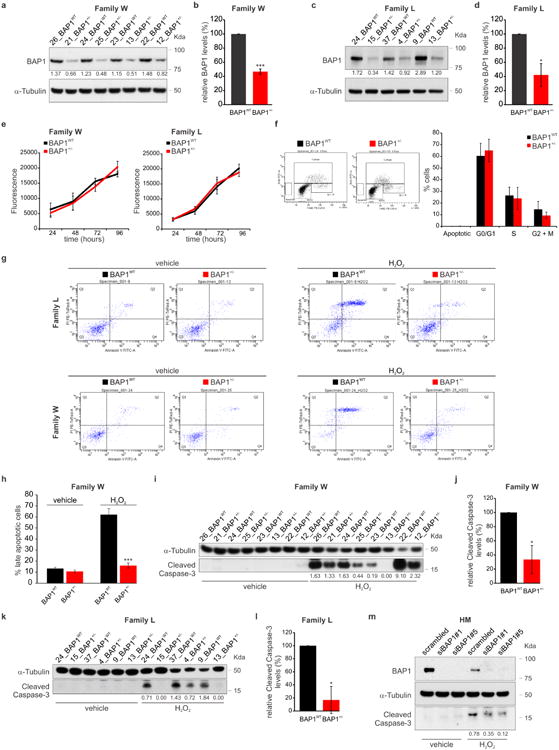
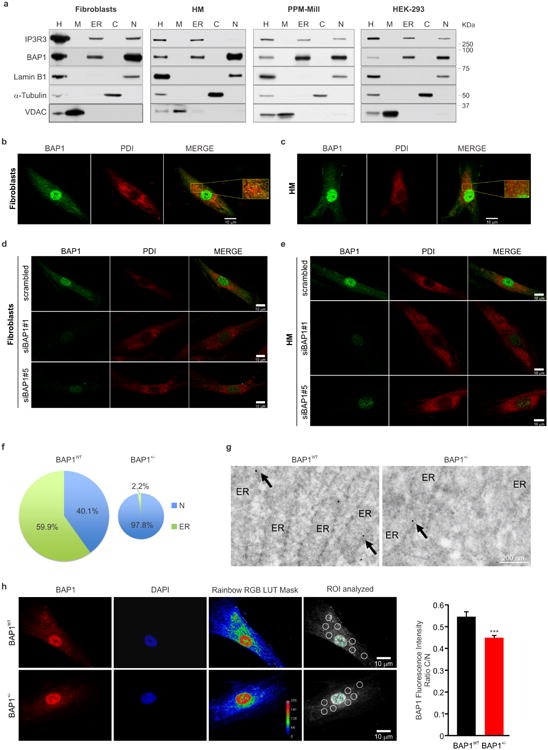
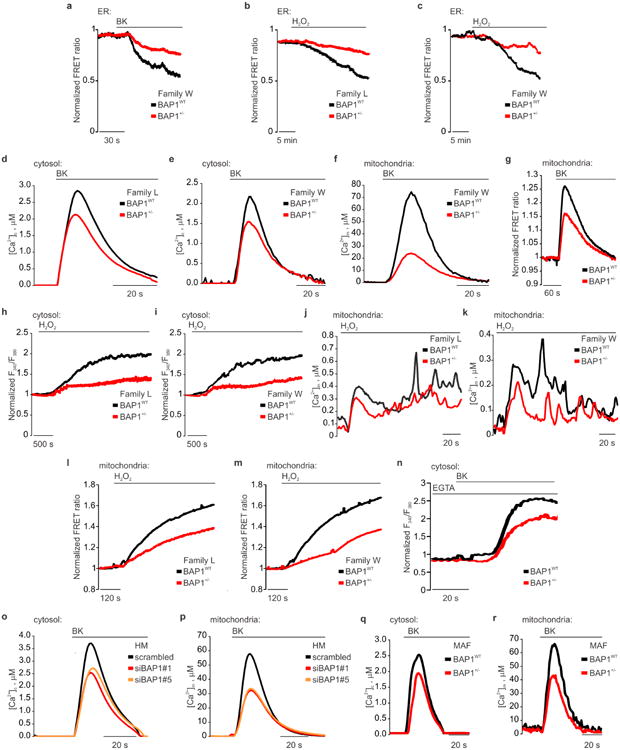
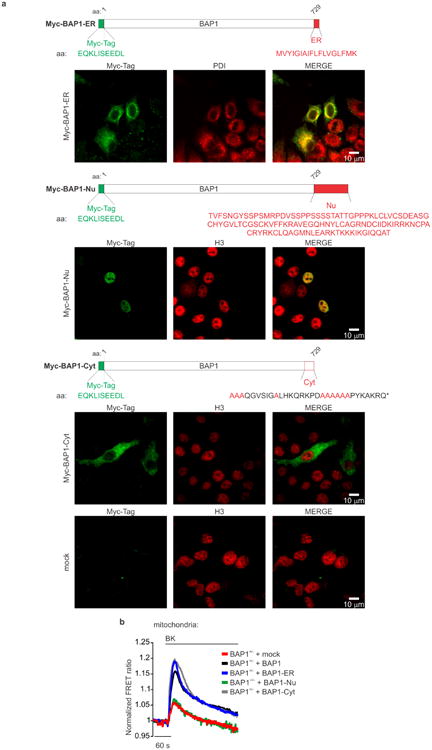
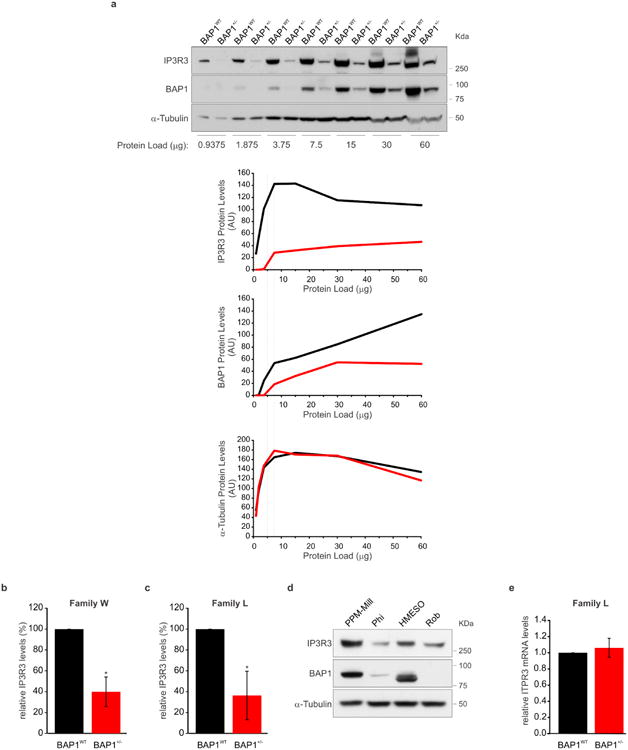
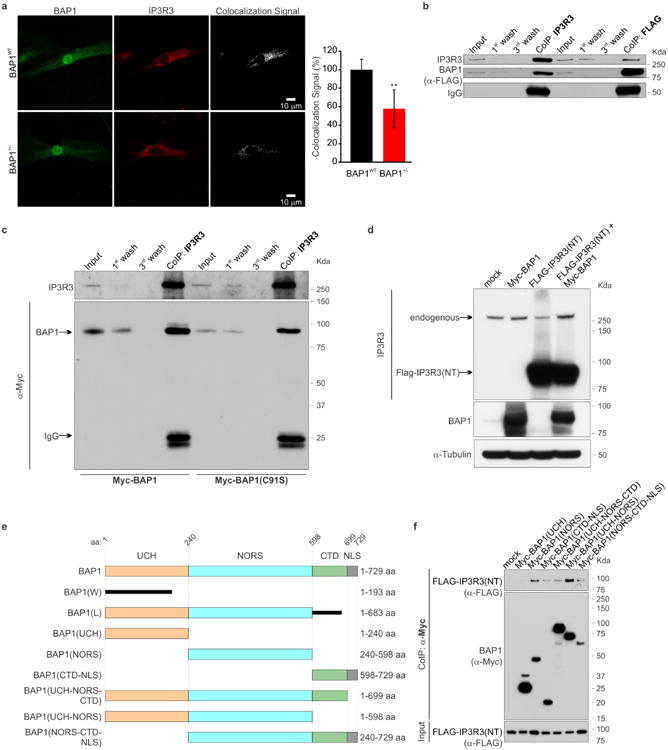
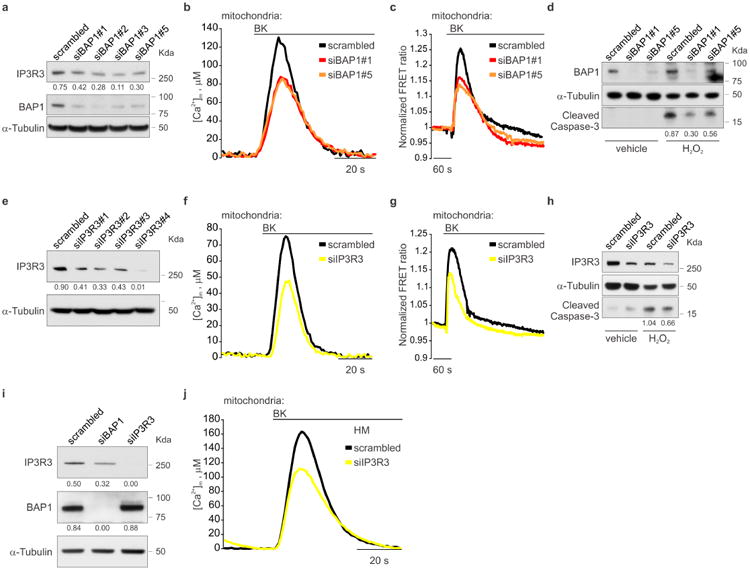
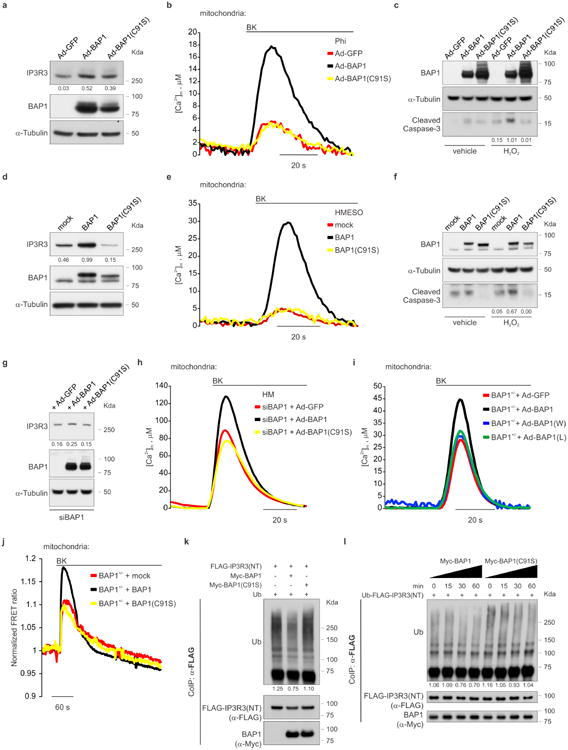
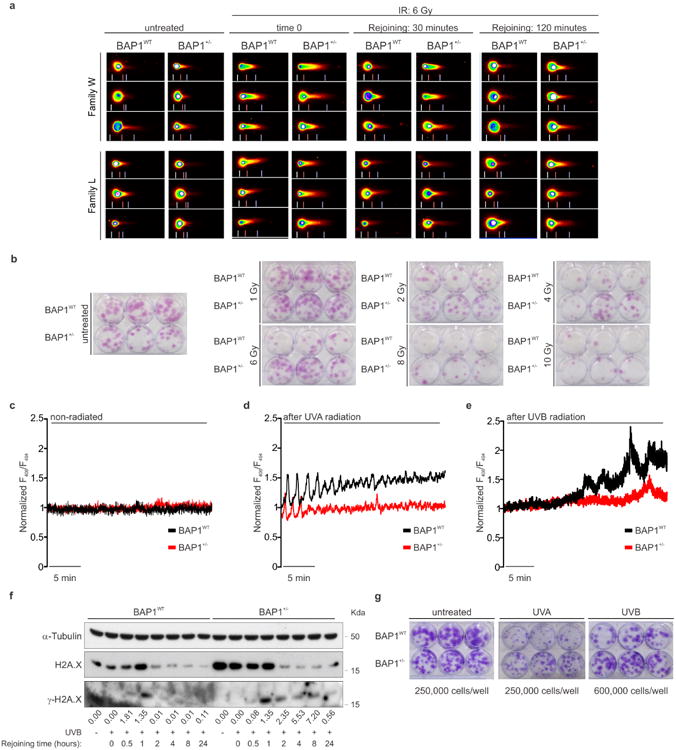
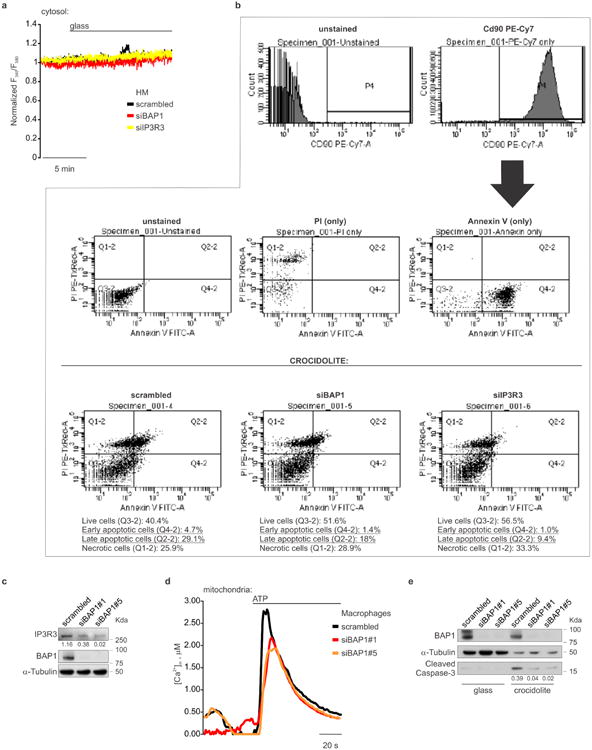
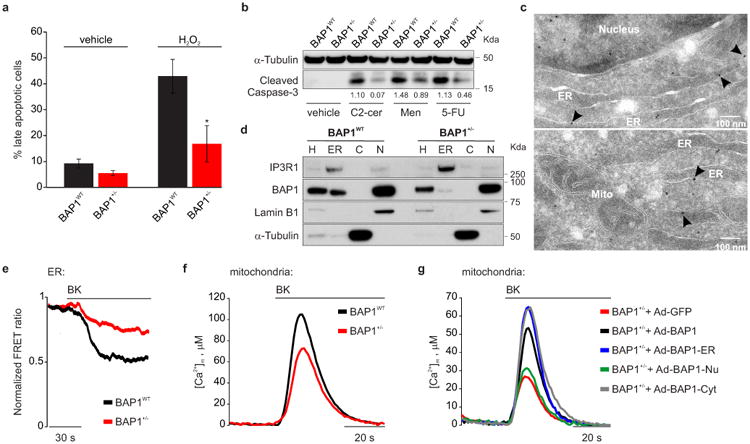
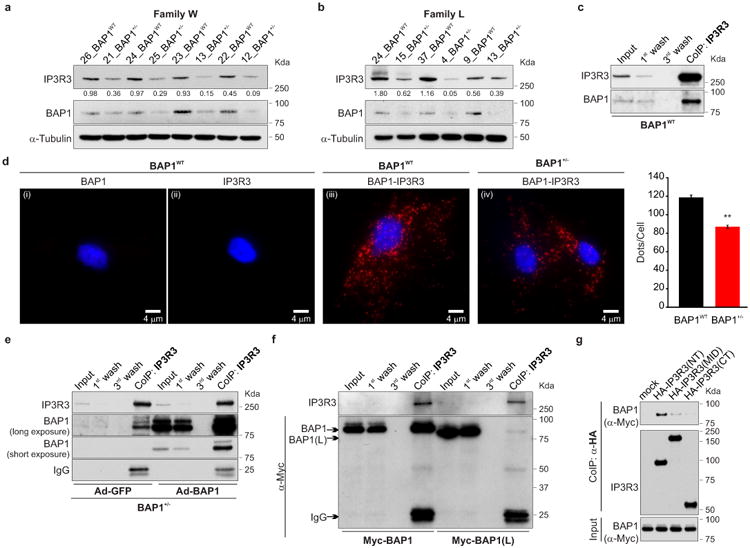
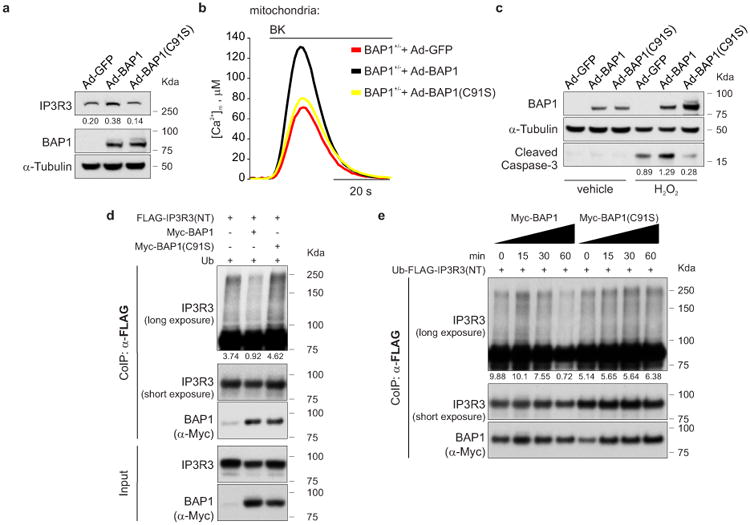
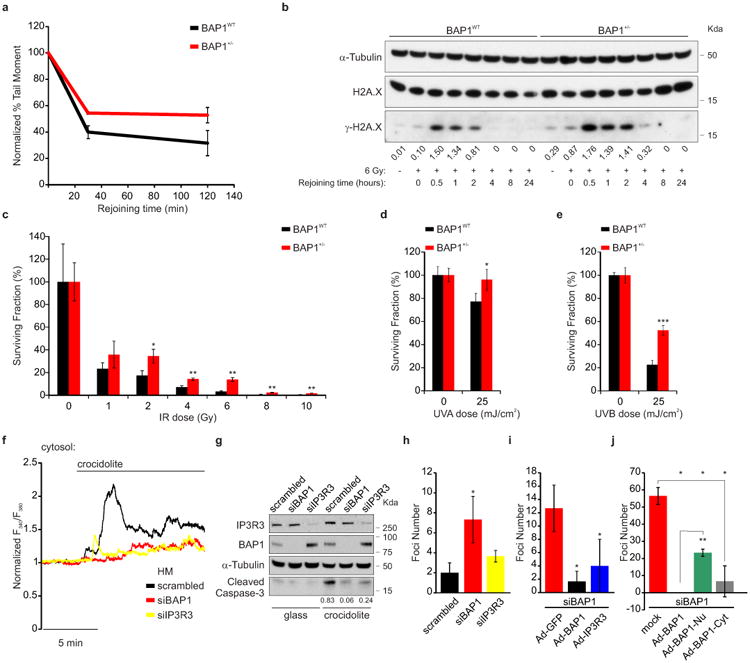
BRCA1-associated protein 1 (BAP1) is a potent tumour suppressor gene that modulates environmental carcinogenesis. All carriers of inherited heterozygous germline BAP1-inactivating mutations (BAP1+/-) developed one and often several BAP1-/- malignancies in their lifetime, mostly malignant mesothelioma, uveal melanoma, and so on. Moreover, BAP1-acquired biallelic mutations are frequent in human cancers. BAP1 tumour suppressor activity has been attributed to its nuclear localization, where it helps to maintain genome integrity. The possible activity of BAP1 in the cytoplasm is unknown. Cells with reduced levels of BAP1 exhibit chromosomal abnormalities and decreased DNA repair by homologous recombination, indicating that BAP1 dosage is critical. Cells with extensive DNA damage should die and not grow into malignancies. Here we discover that BAP1 localizes at the endoplasmic reticulum. Here, it binds, deubiquitylates, and stabilizes type 3 inositol-1,4,5-trisphosphate receptor (IP3R3), modulating calcium (Ca2+) release from the endoplasmic reticulum into the cytosol and mitochondria, promoting apoptosis. Reduced levels of BAP1 in BAP1+/- carriers cause reduction both of IP3R3 levels and of Ca2+ flux, preventing BAP1+/- cells that accumulate DNA damage from executing apoptosis. A higher fraction of cells exposed to either ionizing or ultraviolet radiation, or to asbestos, survive genotoxic stress, resulting in a higher rate of cellular transformation. We propose that the high incidence of cancers in BAP1+/- carriers results from the combined reduced nuclear and cytoplasmic activities of BAP1. Our data provide a mechanistic rationale for the powerful ability of BAP1 to regulate gene-environment interaction in human carcinogenesis.


Figures

Extended Data Figure 1
Extended Data Figure 1. Fibroblasts from BAP1 germline mutation carriers have reduced BAP1 protein levels, do not show differences in growth or cell cycle progression, and are protected from apoptosis
a-d, Western blot (WB): amounts of WT BAP1 in total cell lysates of W (a) and L (c) fibroblasts, matched by gender and age (see Supplementary Fig. 1; i.e., W: 26_BAP1WT and 21_BAP1+/-; etc., as shown in subsequent figures); decimals indicate the amounts of BAP1 relative to α-Tubulin as per densitometry. b, d, Densitometric analyses. BAP1 protein levels normalized to α-Tubulin in fibroblast cell cultures from W (b) and L (d) family members matched by gender and age; data shown as mean ± s.e.m. of n = 4 (b) and n = 3 (d) biological replicates per condition, representative of three or more independent experiments. e, AlamarBlue assay was used to measure cell growth at the indicated time points, in fibroblasts from W (left panel) and L (right panel) family members; data shown as mean ± s.d. of n = 6 technical replicates per data point, representative of three or more independent experiments in biological replicates. f, Flow cytometry analyses showing percentage of cells in different phases of the cell cycle; data shown as mean ± s.e.m. of n = 4 biological replicates per condition. No differences were observed between BAP1WT and BAP1+/- fibroblasts from either W and L family members. g, Representative flow cytometry dot plots assessing Annexin V-FITC and PI staining in fibroblasts from L (upper panels, n = 4 independent experiments: 3 biological replicates per condition, 1 culture replicate) and W (lower panels, n = 4 biological replicates per condition) family members treated with 100 μM H2O2 for 6 hours. h, Late apoptotic cells calculated as percentage of gated cells in the top right quadrant (Q2: Annexin V+/PI+); data shown as mean ± s.e.m. of n = 4 biological replicates per condition. i-l, Cleaved caspase-3 levels measured by WB in fibroblast cell cultures from W (i) and L (k) family members, matched by gender and age, treated with H2O2. Decimals indicate the densitometrically determined amounts of cleaved caspase-3 relative to α-Tubulin. j, l, Cleaved caspase-3 densitometry of bands in BAP1+/- fibroblasts expressed relatively to the amounts detected in BAP1WT fibroblasts (100 %); data shown as mean ± s.e.m. of n = 4 (j) and n = 3 (l) biological replicates per condition, representative of at least three independent experiments. m, Primary human mesothelial cells (HM) were transfected with control scrambled siRNA, or siRNAs-BAP1 (siBAP1#1 and siBAP1#5). After 24 hours, cells were treated with 200 μM H2O2 for 6 hours. Total cell lysates were prepared and analyzed by WB to compare cleaved caspase-3 levels. Decimals indicate densitometrically determined cleaved caspase-3 levels normalized to α-Tubulin. Similar results were obtained in 3 separate HM primary cultures from different donors. Black, BAP1WT; Red, BAP1+/-; *, P<0.05; ***, P<0.001, calculated using two-tailed unpaired Student's t-tests. WB source images, see Supplementary Fig. 2.
Extended Data Figure 2
Extended Data Figure 2. Subcellular fractionation and immunofluorescence showing BAP1 localization at the ER
a, WB showing the amounts of BAP1 in the subcellular fractions of primary fibroblasts, HM, PPM-Mill (a human MM cell line), and HEK-293 (human embryonic kidney cells). H: homogenate; M: mitochondria; ER: endoplasmic reticulum; C: cytosol; N: nuclei. Markers: mitochondria (VDAC), ER (IP3R3), nuclei (Lamin B1), cytosol (α-Tubulin). b, c, IF: BAP1 localization in WT fibroblasts (b) and HM (c). Cells were immunostained for BAP1 (green) and PDI (ER marker, red). Merged images show the overlapping yellow signal between BAP1 and PDI. Inserts show magnified merged images. BAP1, besides its nuclear localization, shows a diffuse pattern of punctate hyper-fluorescent spots in the cytoplasm that co-localized with the ER, in both BAP1WT fibroblasts (b) and in HM (c). Representative IF images from n = 10 fields of view; scale bar, 10 μm. d, e, The specificity of BAP1 IF staining was confirmed by complete disappearance of this IF pattern when BAP1 was down-regulated using two different siRNAs, but not in cells transfected with scrambled siRNA. IF in WT fibroblasts (d) and HM (e) after BAP1 silencing. Cells were transfected with control scrambled siRNA or siRNAs-BAP1 (siBAP1#1 and siBAP1#5). After 24 hours, the cells were immuno-stained using monoclonal antibodies for BAP1 (green) and PDI (ER marker, red). Merged images show the overlapping signal (yellow) between BAP1 and PDI. Representative IF images from n = 5 fields of view per condition; scale bar, 10 μm. f, Percentages of nuclear (N) and ER localized BAP1 in BAP1WT and BAP1+/- fibroblasts, related to Fig. 1d. Densitometric analysis of the intensity of the bands was performed using ImageJ, and the amounts of nuclear and ER localized BAP1 were normalized on the respective markers, Lamin B1 (nuclei) and IP3R1 (ER). The total, combined, amount of nuclear and ER BAP1 was reduced by 47.9% in BAP1+/- fibroblasts, depicted by the smaller size of the pie chart. Percentages of BAP1 in the nuclear or ER fractions are relative to the total amount of nuclear and ER BAP1. g, Immunogold BAP1 labeling of cryosections in BAP1WT and BAP1+/- fibroblasts. Note reduced detection of BAP1 associated with the ER (arrows) in BAP1+/- cells; scale bar 200 nm. h, IF showing reduced Cytoplasm/Nucleus (C/N) ratio intensity in BAP1+/- fibroblasts. Cells were stained with DAPI (nuclei, blue) and BAP1 (red). Representative images from n = 20 fields of view per condition. Rainbow RGB LUT mask shows color-coded contrast and pseudocoloring according to an arbitrary color LUT (see pseudocolor scale, numbers on the scale are: 0, black; 64, blue, 128, green, 191, light red, 255, darker red). Scale bar, 10 μm. The bar graph shows the mean ± s.e.m. of the C/N ratio intensity measured in random region of interests (ROIs) of the acquired images: the areas (ROIs) where the intensities of fluorescence were measured are indicated by white and green circles in the cytoplasm and nucleus respectively (n = 40 cells BAP1WT; n = 46 cells BAP1+/-); *** P<0.001. P value calculated using two-tailed unpaired Student's t-test. WB and EM source images, see Supplementary Fig. 2, 3.
Extended Data Figure 3
Extended Data Figure 3. BAP1 modulates intracellular Ca2+ homeostasis
a, BAP1+/- W-fibroblasts displayed reduced Ca2+ release from the ER following stimulation with 1 μM bradykinin (BK) compared to WT fibroblasts (see also Fig. 1e). b, c, BAP1+/- L (b) and W (c) fibroblasts showed reduced Ca2+ release from the ER after stimulation with H2O2. d, e, BAP1+/- L (d) and W (e) fibroblasts had reduced cytosolic Ca2+ concentrations ([Ca2+]c) following stimulation with 1 μM BK. f, BAP1+/- W-fibroblasts, stimulated with 1 μM BK displayed reduced mitochondrial Ca2+ concentrations ([Ca2+]m) (see also Fig. 1f). g, Representative traces of single cells Ca2+ measurements using mitochondrial targeted cameleon (4mtD3cpv) showing reduced mitochondrial Ca2+ in BAP1+/- fibroblasts upon treatment with 1 μM BK. h, i, BAP1+/- L (h) and W (i) fibroblasts showed reduced cytosolic Ca2+ after stimulation with H2O2. j, k, BAP1+/- L (j) and W (k) fibroblasts displayed reduced [Ca2+]m after stimulation with H2O2. l, m, Representative time-lapse traces of single cells Ca2+ measurements using 4mtD3cpv showing reduced mitochondrial Ca2+ in BAP1+/- L (l) and W (m) fibroblasts after stimulation with 100 μM H2O2 for 20 minutes. n, Reduced intracellular Ca2+ levels in stimulated BAP1+/- fibroblasts are independent of extracellular Ca2+ influx from the plasma membrane. BAP1+/- and matched WT fibroblasts were loaded with Fura-2/AM in Ca2+-free KRB buffer supplemented with 0.1 mM ethylene glycol-bis(β-aminoethylether)-N,N,N′,N′-tetraacetic acid (EGTA), then dynamic measurements of intracellular Ca2+ levels where conducted after addition of 1 μM BK to the same buffer. Changes in intracellular Ca2+ responses after BK stimulation are displayed as the ratio of fluorescence at 340/380 nm. o, p, HM silenced for BAP1 displayed reduced [Ca2+]c (o) and [Ca2+]m (p) after stimulation with 1 μM BK. HM cell cultures were transfected with control scrambled siRNA or siRNAs-BAP1 (siBAP1#1 and siBAP1#5). After 24 hours, cells were stimulated with 1 μM BK and [Ca2+]c (o) and [Ca2+]m (p) were measured using targeted aequorin probes. q, r, Mice adult fibroblasts (MAF) derived from Bap1+/- mice displayed reduced [Ca2+]c (q) and [Ca2+]m (r) compared to Bap1WT mice, and thus they reproduce the human condition. Representative changes in [Ca2+]c (q) and [Ca2+]m (r) in MAF cells after agonist stimulation (100 μM BK). Source data, see Supplementary Table 1, 2.
Extended Data Figure 4
Extended Data Figure 4. BAP1 targeting to ER, nucleus and cytoplasm differentially affects mitochondrial Ca2+ homeostasis
a, Localization of Myc-tagged BAP1 chimeras. IF: BAP1 localization in WT fibroblasts. ER chimera (Myc-BAP1-ER): BAP1 was fused to the ER-targeting sequence from the yeast UBC6 protein to target BAP1 to the cytosolic face of the ER membrane. Nuclear chimera (Myc-BAP1-Nu): BAP1 was fused to a sequence derived from the glucocorticoid receptor NR3C1. Cytoplasmic chimera (Myc-BAP1-Cyt): point mutations were introduced in the NLS region of BAP1 to prevent its nuclear localization (*: STOP codon). BAP1 localization is shown in green using a Myc-Tag antibody, the nuclei and the ER are shown in red using histone H3 (nucleus) and PDI (ER) antibodies. The merged signal is shown in yellow. Note the specific localization of the three chimeras to the ER, nuclei and cytoplasm. Mock, empty vector (control). Representative IF images from n = 5 fields of view per condition; scale bar, 10 μm. b, Representative traces of single cells Ca2+ measurements in BAP1+/- fibroblasts co-transfected with mitochondrial targeted 4mtD3cpv and either BAP1 or targeted BAP1-ER, BAP1-Nu, BAP1-Cyt; mock, co-transfection with an empty vector. Mitochondrial Ca2+ uptake was followed over time after stimulation with 1 μM BK. Descriptive statistic is shown in Supplementary Table 1.
Extended Data Figure 5
Extended Data Figure 5. BAP1 stabilizes IP3R3
a, Defining the linear dynamic range of BAP1 and IP3R3 detection by WB. The upper panel shows a representative WB performed on a two-fold dilution series (from 60 to 0.9375 μg) of total cell homogenates from BAP1+/- and matched control BAP1WT fibroblasts. Protein levels were determined using the following primary antibodies: BAP1 (C-4), Santa Cruz Biotechnology, cat. no. sc-28383, 1:300; IP3R3, BD Biosciences, cat. no. 610312, 1:500; α-Tubulin (4G1), Santa Cruz Biotechnology, cat. no. sc-58666, 1:15,000. A horseradish peroxidase (HRP)-conjugated secondary antibody (Stabilized Peroxidase Conjugated Goat Anti-Mouse, Thermo Scientific, cat. no. 32430; 1:1,000 for BAP1 and IP3R3, 1:5,000 for α-Tubulin) was used to generate the chemiluminescent signal captured on autoradiography film. Digital images were acquired, then densitometric analysis of the intensity of the bands was performed using ImageJ, and expressed as arbitrary optical densitometry units (AU). The lower panels show the AU for IP3R3, BAP1 and α-Tubulin, plotted against the protein load. The dotted lines define the linear dynamic range of protein load for BAP1, IP3R3 and α-Tubulin detection. b, c, Densitometric analysis of IP3R3 protein levels normalized to α-Tubulin in fibroblasts from W (b) and L (c) family members, related to Fig. 2a, b. Densitometry of bands in BAP1+/- fibroblasts is expressed relative to BAP1WT fibroblasts (100%), matched by gender and age as indicated in Supplementary Fig. 1a, b; data shown as mean ± s.e.m. of n = 4 (b) and n = 3 (c) biological replicates per condition, representative of three independent experiments; *, P<0.05 calculated using two-tailed paired Student's t-tests. d, MM cell lines with mutated BAP1 contained reduced amounts of IP3R3: PPM-Mill (WT BAP1), Phi (mutated BAP1 with shorter splicing isoform), HMESO (mutated BAP1 alternative splicing, shorter protein) and Rob (BAP1 null). e, Quantitative Real-time PCR analysis of ITPR3, the gene that codes for IP3R3. mRNA expression levels were normalized using the geometrical mean of B2M, 18S and β-actin reference genes in BAP1WT and BAP1+/- fibroblasts. mRNA expression levels in BAP1+/- fibroblasts are expressed relative to BAP1WT. Data shown as mean ± s.e.m. of n = 6 technical replicates, representative of three independent experiments in biological replicates. WB source images, see Supplementary Fig. 2.
Extended Data Figure 6
Extended Data Figure 6. BAP1 binds IP3R3
a, IF, reduced BAP1 colocalization with IP3R3 in BAP1+/- fibroblasts compared to BAP1WT fibroblasts. Cells were immunostained for BAP1 (green) and IP3R3 (red). Images were processed with the ImageJ software equipped with Colocalization Highlighter plugin; the colocalization signal is showed in white. Scale bar, 10 μm. The bar graph depicts the decreased colocalization of BAP1 and IP3R3 in BAP1+/- fibroblasts, expressed as (%) mean ± s.e.m.; ** P<0.01 (n = 9 cells per condition), P value calculated using two-tailed unpaired Student's t-test. b, Co-immunoprecipitation (CoIP) of IP3R3 and BAP1 from HEK-293 cells stably expressing FLAG-HA-BAP1. c, CoIP of endogenous IP3R3 and Myc-tagged BAP1 WT or the catalytic inactive BAP1(C91S). Washes (1st and 3rd) show loss of bound proteins that washed out during three sequential washes of the immuno-complexes. BAP1(C91S) retains the ability to bind IP3R3. d, The dominant negative effect of NT-IP3R3 overexpression on endogenous IP3R3 levels is counteracted by concomitant BAP1 overexpression, findings indicating that BAP1 binds IP3R3 and prevents its degradation. e, Schematic representation of BAP1 domains, truncated W and L mutants (see also reference 5), and fragments. Domains of the 729 amino acid (aa) BAP1 protein (1–729 aa), consisting of an N-terminal Ubiquitin carboxy-terminal hydrolase (UCH) domain (1–240 aa), a non-regular secondary structure (NORS) domain (240–598 aa), a C-terminal (CTD) domain (598–699 aa) and NLS (699–729). Numbers refer to amino acids positions. BAP1(W) and BAP1(L) are the predicted truncations of BAP1 resulting from the germline mutations in W and L families, respectively. f, Mapping of the BAP1 region interacting with IP3R3. HEK-293 cells were co-transfected with FLAG-IP3R3(NT) and the indicated Myc-tagged BAP1 fragments expression vectors; cell extracts were used for CoIP using anti-Myc resin. The BAP1 region UCH-NORS had the highest binding affinity to Flag-IP3R3(NT), and the CTD-NLS region contributed to the binding, whilst the UCH region alone showed no interaction. WB source images, see Supplementary Fig. 2.
Extended Data Figure 7
Extended Data Figure 7. Effects of BAP1 silencing on IP3R3 protein levels, mitochondrial Ca2+ uptake and apoptosis
a, WB of BAP1 and IP3R3 protein levels in BAP1WT fibroblasts silenced for BAP1. b, [Ca2+]m measurements following stimulation with 1 μM BK, in BAP1WT fibroblasts transfected with control scrambled siRNA or siRNAs-BAP1 (siBAP1#1 and siBAP1#5). c, Representative traces of single cells Ca2+ measurements in BAP1WT fibroblasts transfected with mitochondrial targeted 4mtD3cpv and control scrambled siRNA, or siBAP1#1 and siBAP1#5; mitochondrial Ca2+ uptake was followed over time after stimulation with 1 μM BK. d, Reduced sensitivity to apoptosis after treatment with 100 μM H2O2 for 6 hours, in BAP1WT fibroblasts after BAP1 silencing. e-h, IP3R3 silencing in BAP1WT fibroblasts (e) leads to decreased mitochondrial Ca2+ uptake following stimulation with 1 μM BK - as shown both by cell-population experiments with mitochondrial targeted aequorin (f) or single-cell experiments with 4mtD3cpv (g) - and protection from apoptosis (h). i, j, BAP1 or IP3R3 silencing in primary HM leads to reduced IP3R3 protein levels (i), and decreased [Ca2+]m following stimulation with 1 μM BK (j and Extended Data Figure 3p). In a, e and f: decimals indicate the amounts of IP3R3 or BAP1 relative to α-Tubulin, as per densitometry. In d and h: decimals indicate the amounts of cleaved caspase-3 relative to α-Tubulin, as per densitometry. WB source images, see Supplementary Fig. 2. b, c, f, g, j, Source data, see Supplementary Table 1, 2.
Extended Data Figure 8
Extended Data Figure 8. Effects of BAP1 rescue on IP3R3 protein levels, mitochondrial Ca2+ uptake, apoptosis, and IP3R3 deubiquitylation
a-c, Phi (human MM cell line with mutated BAP1, see Extended Data Figure 5d) were transiently transduced with WT BAP1 (Ad-BAP1), catalytically inactive BAP1(C91S)-mutant, or control (Ad-GFP). BAP1 WT, (a) stabilizes IP3R3, (b) increase [Ca2+]m following stimulation with 1 μM BK, and (c) apoptosis, while the catalytic inactive BAP1(C91S) mutant was less effective. In c, cells were treated with 500 μM H2O2 for 6 hours and total cell lysates were prepared and analyzed by WB to compare cleaved caspase-3 levels. d-f, Stable clones of HMESO (human MM cell line with mutated BAP1, see Extended Data Figure 5d) in which we reintroduced BAP1 WT, the catalytic inactive BAP1(C91S), or an empty vector (mock), showed that BAP1 WT - but not the catalytic inactive BAP1(C91S) mutant - (d) stabilizes IP3R3, and (e) increases [Ca2+]m following stimulation with 1 μM BK, and (f) apoptosis in cells treated with 100 μM H2O2 for 3 hours. Total cell lysates were analyzed by WB to compare cleaved caspase-3 levels. g, h, HM containing WT BAP1, were first silenced for BAP1 using siRNA and subsequently transduced with WT BAP1 (Ad-BAP1), catalytically inactive BAP1(C91S)-mutant or control (Ad-GFP). BAP1 WT, but not the catalytic inactive BAP1(C91S) mutant, (g) stabilizes IP3R3 and (h) increases [Ca2+]m following stimulation with 1 μM BK. Panels a, c, d, f, g: decimals indicate the amounts of IP3R3 or cleaved caspase-3 relative to α-tubulin, as per densitometry. i, BAP1+/- fibroblasts were transduced with WT BAP1 (Ad-BAP1), truncated BAP1(W) and BAP1(L), or control (Ad-GFP), and [Ca2+]m was measured following stimulation with 1 μM BK. j, Representative traces of single cells Ca2+ measurements in BAP1+/- fibroblasts co-transfected with mitochondrial targeted 4mtD3cpv and, either BAP1, or the catalytically inactive BAP1(C91S)-mutant; mock, co-transfection with an empty vector. Mitochondrial Ca2+ uptake was followed over time after stimulation with 1 μM BK. k, Ubiquitylation assay showing that BAP1 WT (Myc-BAP1), but not BAP1(C91S)-mutant, deubiquitylates the N-terminus of IP3R3. HEK-293 cells were co-transfected with FLAG-IP3R3(NT) and either Myc-BAP1, Myc-BAP1(C91S) or empty vector. Ub, Ubiquitin. l, Ubiquitylation/deubiquitylation assay to monitor BAP1 deubiquitylation of FLAG-IP3R3(NT). Either immunopurified WT Myc-BAP1 or catalytically inactive Myc-BAP1(C91S) were incubated in vitro with ubiquitylated FLAG-IP3R3(NT). Protein levels were analyzed by WB with the indicated antibodies. The ladder of bands with a relative molecular mass of ≥ 90 KDa corresponds to ubiquitylated FLAG-IP3R3(NT). Decimals indicate the amounts of ubiquitylated FLAG-IP3R3(NT) normalized on total co-immunoprecipitated FLAG-IP3R3(NT) at 90 KDa. WB source images, see Supplementary Fig. 2. b, e, h, i, j, Source data, see Supplementary Table 1, 2.
Extended Data Figure 9
Extended Data Figure 9. BAP1+/- fibroblasts exposed to ionizing radiation (IR) or to ultraviolet (UV) radiation show increased survival in spite of increased DNA damage
a, Representative images of comet assays. W and L family derived fibroblasts were irradiated and analyzed at the indicated time points (see also Fig. 4a). Representative results showing the rejoining of the DNA damage measured as percentage of the tail moment at the indicated time points, after BAP1+/- fibroblasts and matched controls were irradiated with 6 Gy IR. The length of the tail of the comet is proportional to the DNA damage. Note increased tail length in BAP1+/- cells. b, Clonogenic assay showing higher number of colonies in BAP1+/- fibroblasts following irradiation at the indicated amounts (see Fig. 4c). c-e, Reduced intracellular Ca2+ levels in BAP1+/- fibroblasts following ultraviolet radiation with UVA (340 nm) or UVB (312 nm). Dynamic measurements of cytosolic Ca2+ response were performed using the fluorescent Ca2+ indicator Fura-RED. c, Control; no changes in dynamic intracellular Ca2+ levels were detected over time in non-radiated BAP1+/- fibroblasts and matched controls. d, e, Dynamic measurements of intracellular Ca2+ levels in BAP1+/- fibroblasts and matched controls following UVA (d) or UVB (e). Changes in intracellular Ca2+ responses over time are displayed as the ratio of fluorescence at 406/494 nm. Descriptive statistic is shown in Supplementary Table 1. f, Delayed DNA repair following UVB radiation in BAP1+/- fibroblasts. γ-H2A.X kinetics: BAP1WT and BAP1+/- fibroblasts were exposed to UVB and γ-H2A.X amounts were measured in cell lysates collected at the indicated time points. Total levels of H2A.X are shown as control. Densitometry: decimals indicate the amounts of γ-H2A.X relative to H2A.X. g, Clonogenic assay at 2 weeks post UV radiation: higher number of colonies in BAP1+/- fibroblasts following UVA, or UVB exposure. Plating: untreated 250,000 cells/well; UVA, 250,000/well; UVB treated 600,000/well to accommodate for the higher potency of UVB that caused extensive cell death. Cells were exposed to 25 mJ/cm2, see also Fig. 4d, e. Higher doses of 50, 75 and 100 mJ/cm2, killed all the cells within 2 weeks from exposure. WB source images, see Supplementary Fig. 2.
Extended Data Figure 10
Extended Data Figure 10. HM and macrophages with reduced levels of BAP1 or IP3R3 are resistant to asbestos-induced apoptosis
a, Primary HM transfected with either scrambled, siBAP1 or siIP3R3, and exposed to glass, displayed no changes in intracellular Ca2+ concentrations (control for Fig. 4f). b, Flow cytometric analyses of HM silenced for BAP1, IP3R3, or scrambled control, and exposed to crocidolite asbestos for 24 hours. Note that HM silenced for BAP1 or IP3R3 show a reduction in the percentage of apoptotic cells compared to scrambled control. c-d, BAP1 silencing in human THP-1 cells differentiated into macrophages leads to decreased IP3R3 protein levels (c), reduced mitochondrial Ca2+ uptake following stimulation with 100 μM ATP (d), and protection from apoptosis following treatment with 5 μg/cm2 crocidolite asbestos (e). In d, THP-1 cells were treated with 20 μM 12-O-Tetradecanoylphorbol 13-acetate (TPA) for 24 hours to induce monocytes differentiation into macrophages; subsequently cells were transduced with WT mitochondrial targeted aequorin (mtAEQ) for 24 hours in presence of TPA, and then transfected with control scrambled siRNA or siRNAs-BAP1 (siBAP1#1 and siBAP1#5) for additional 24 hours prior to Ca2+ measurements. In e, cells were treated with 20 μM TPA for 48 hours, transfected with control scrambled siRNA, siBAP1#1 and siBAP1#5 for 24 hours, and treated with 5 μg/cm2 crocidolite asbestos for additional 24 hours; total cell lysates were analyzed by WB to compare cleaved caspase-3 levels. In c and e, decimals indicate densitometrically determined IP3R3 or cleaved caspase-3 levels normalized to α-Tubulin. WB source images, see Supplementary Fig. 2. a, d, For source data see Supplementary Table 1, 2.
Figure 1
Figure 1. BAP1 localizes at the ER and modulates Ca2+ signaling and apoptosis
a, Reduced apoptosis in BAP1+/- L-fibroblasts treated with 100 μM H2O2, or b, with 10 μM C2-ceramide (C2-cer), 10 μM menadione (Men), 10 μM 5-fluorouracile (5-FU). Decimals: cleaved caspase-3/α-Tubulin. a, Data shown as mean ± s.e.m. of n = 4 independent experiments (3 biological replicates, 1 culture replicate) with pooled analysis displayed. P value calculated using two-tailed unpaired Student's t-test, * P < 0.05. c, d, BAP1 localizes at the ER. c, EM, immunogold labeling of BAP1WT fibroblasts; arrowheads, ER localized BAP1. Mito, mitochondria, scale-bar 100 nm. d, Subcellular fractionation: ER BAP1 levels. H: homogenate; C: cytosol; N: nuclei. Markers: ER (IP3R1), nuclei (Lamin B1), cytosol (α-Tubulin). e-g, BAP1+/- L-fibroblasts stimulated with 1 μM bradykinin (BK) show reduced ER Ca2+ release (e) and mitochondrial Ca2+ concentrations ([Ca2+]m) (f). g, Cytoplasmic- and ER-targeted BAP1 (Ad-BAP1-Cyt and Ad-BAP1-ER) restore [Ca2+]m to levels similar or higher than BAP1+/- fibroblasts transduced with BAP1 (Ad-BAP1), nuclear BAP1 (Ad-BAP1-Nu) does not. e-g, Source data, see Supplementary Table 1, 2. WB and EM source images, see Supplementary Fig. 2, 3.
Figure 2
Figure 2. IP3R3 and BAP1 interaction
a, b, WB, reduced IP3R3 levels in BAP1+/- fibroblasts. Decimals: IP3R3/α-Tubulin. c-g, BAP1-IP3R3 interaction. c, CoIP of IP3R3-BAP1, BAP1WT fibroblasts. d, PLA, red dots show IP3R3-BAP1 interaction in BAP1WT (iii) and BAP1+/- (iv) fibroblasts; (i, ii), controls using only one antibody. Nuclei stained blue with DAPI. Scale-bar, 4 μm. Bar-graph: quantification of PLA red dots/cells showing reduced IP3R3-BAP1 interaction in BAP1+/- fibroblasts. Data shown as mean ± s.e.m. (n = 11 cells per condition). P value calculated using two-tailed unpaired Student's t-test, ** P<0.01. e, CoIP of IP3R3-BAP1 in BAP1+/- fibroblasts transduced with Ad-GFP or Ad-BAP1. f, CoIP of IP3R3-BAP1 in HEK-293 transfected with Myc-tagged WT BAP1; no CoIP with truncated BAP1(L). g, BAP1 binds the IP3R3 N-terminus. CoIP of IP3R3-BAP1 in HEK-293 co-transfected with Myc-tagged BAP1 and HA-tagged IP3R3 deletion mutants [(NT, aa 1-800), (MID, aa 801-2230), (CT, aa 2180-2670]. 1st and 3rd wash lanes show progressive loss of bound proteins during sequential washes confirming specificity of CoIP. WB source images, see Supplementary Fig. 2.
Figure 3
Figure 3. BAP1 deubiquitylates IP3R3
a-c, BAP1 WT, not catalytic inactive BAP1(C91S), (a) stabilizes IP3R3, (b) increases [Ca2+]m following 1 μM BK stimulation and (c) apoptosis. Decimals: IP3R3 or cleaved caspase-3/α-Tubulin. d, Ubiquitylation assay: BAP1 WT, not BAP1(C91S), deubiquitylates the IP3R3 N-terminus. HEK-293 co-transfected with FLAG-IP3R3(NT) and either Myc-BAP1, Myc-BAP1(C91S) or empty vector. Ub, Ubiquitin. e, Ubiquitylation/deubiquitylation assay. Immunopurified Myc-BAP1 or catalytically inactive Myc-BAP1(C91S) were incubated in vitro with ubiquitylated FLAG-IP3R3(NT), followed by WB. The ladder corresponds to ubiquitylated IP3R3(NT). Decimals: ubiquitylated IP3R3(NT) normalized to total immunoprecipitated IP3R3(NT) at 90 KDa (short exposure). WB source images, see Supplementary Fig. 2. b, Source data, see Supplementary Table 2.
Figure 4
Figure 4. Reduced nuclear and cytoplasmic BAP1 levels increase survival from DNA damage, resistance to apoptosis and foci formation
a-c, Reduced (a, comet assay), delayed (b, γ-H2A.X kinetics) DNA repair, and increased survival (c, clonogenic assays) in BAP1+/- fibroblasts following IR. Decimals: γ-H2A.X/H2A.X. a, n = 2 biological replicates with pooled analysis displayed, representative of three independent experiments. a, c, See Extended Data Fig. 9a, b. b, WB source images, see Supplementary Fig. 2. d, e, Clonogenic assays: increased survival of BAP1+/- fibroblasts following 25 mJ/cm2 UVA (d) or UVB (e) radiation; see Extended Data Fig. 9g. f, ER Ca2+ release in primary HM exposed to asbestos and transfected with siBAP1 or siIP3R3, or scrambled (see Extended Data Fig. 10a); source data, see Supplementary Table 1. g, Reduced apoptosis in HM silenced for either BAP1 or IP3R3 exposed to asbestos. WB comparing cleaved caspase-3 levels (see Extended Data Fig. 10b). Decimals: cleaved caspase-3/α-Tubulin. h-j, Cytoplasmic BAP1 and IP3R3 levels influence foci formation in HM exposed to asbestos. Foci formation in HM silenced with scrambled, siBAP1 and siIP3R3 (h); HM silenced for BAP1 and transduced with Ad-GFP (control), Ad-BAP1, and Ad-IP3R3 (i); and HM silenced for BAP1 and transduced with Ad-BAP1, Ad-BAP1-Nu and Ad-BAP1-Cyt (j). c, d, e, h, i, j, n = 3 culture replicates, representative of three (c, e, h, i) or two (d, j) independent experiments in biological replicates. Data shown as mean ± s.d. P value calculated using two-tailed unpaired Student's t-tests. *, P<0.05; **, P<0.01; ***, P<0.001.

Comment in

References

    1. Carbone M, et al. Consensus Report of the 2015 Weinman International Conference on Mesothelioma. J Thorac Oncol. 2016;11:1246–1262. doi: 10.1016/j.jtho.2016.04.028. - DOI - PMC - PubMed
    1. Carbone M, et al. BAP1 and cancer. Nat Rev Cancer. 2013;13:153–159. - PMC - PubMed
    1. Napolitano A, et al. Minimal asbestos exposure in germline BAP1 heterozygous mice is associated with deregulated inflammatory response and increased risk of mesothelioma. Oncogene. 2016;35:1996–2002. doi: 10.1038/onc.2015.243. - DOI - PMC - PubMed
    1. Baumann F, et al. Mesothelioma patients with germline BAP1 mutations have 7-fold improved long-term survival. Carcinogenesis. 2015;36:76–81. doi: 10.1093/carcin/bgu227. - DOI - PMC - PubMed
    1. Testa JR, et al. Germline BAP1 mutations predispose to malignant mesothelioma. Nat Genet. 2011;43:1022–1025. doi: 10.1038/ng.912. - DOI - PMC - PubMed

Publication types

MeSH terms