Review
. 2017 Nov:75S:S4-S18.
doi: 10.1016/j.jbi.2017.06.011. Epub 2017 Jun 11.

De-identification of psychiatric intake records: Overview of 2016 CEGS N-GRID shared tasks Track 1

Affiliations
Review

De-identification of psychiatric intake records: Overview of 2016 CEGS N-GRID shared tasks Track 1

Amber Stubbs et al. J Biomed Inform. 2017 Nov.

Abstract

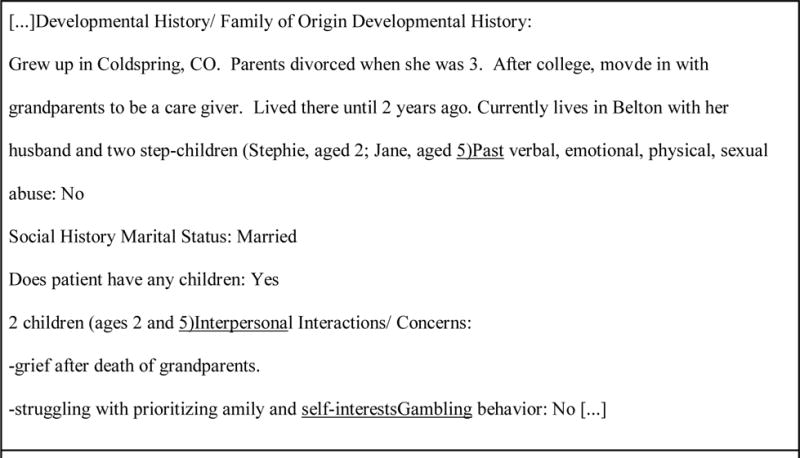
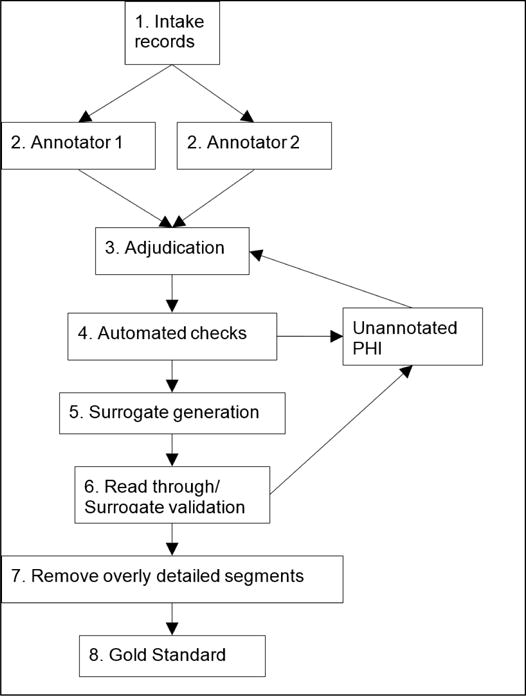
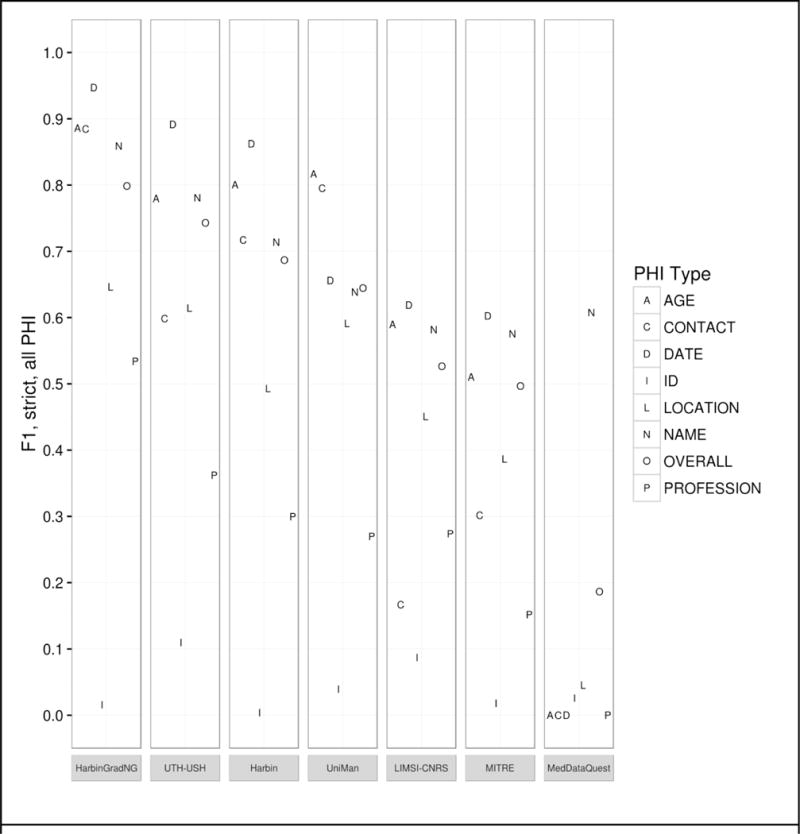
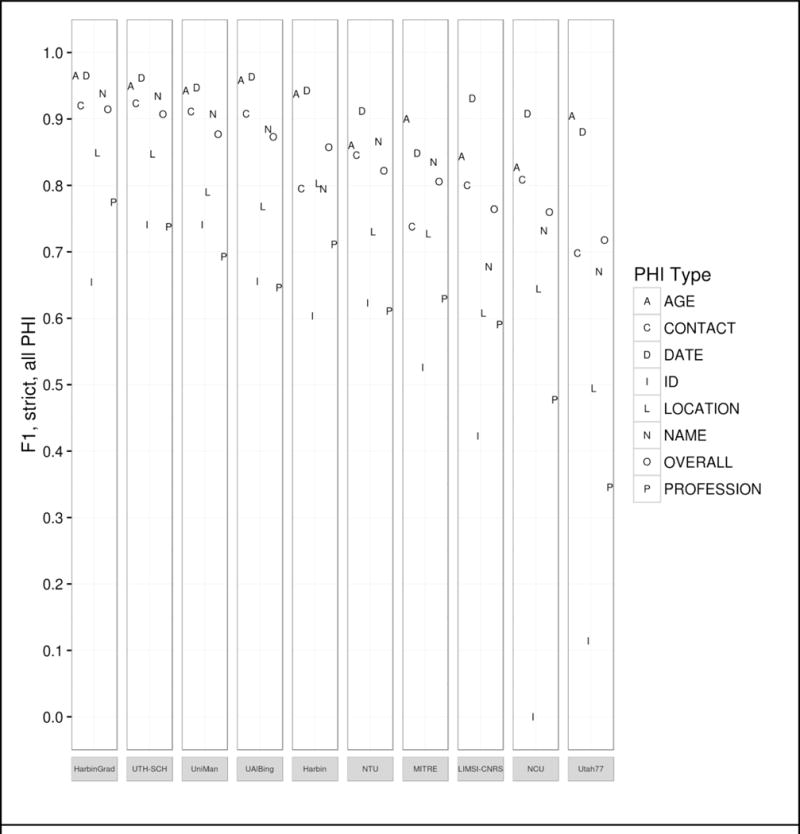
The 2016 CEGS N-GRID shared tasks for clinical records contained three tracks. Track 1 focused on de-identification of a new corpus of 1000 psychiatric intake records. This track tackled de-identification in two sub-tracks: Track 1.A was a "sight unseen" task, where nine teams ran existing de-identification systems, without any modifications or training, on 600 new records in order to gauge how well systems generalize to new data. The best-performing system for this track scored an F1 of 0.799. Track 1.B was a traditional Natural Language Processing (NLP) shared task on de-identification, where 15 teams had two months to train their systems on the new data, then test it on an unannotated test set. The best-performing system from this track scored an F1 of 0.914. The scores for Track 1.A show that unmodified existing systems do not generalize well to new data without the benefit of training data. The scores for Track 1.B are slightly lower than the 2014 de-identification shared task (which was almost identical to 2016 Track 1.B), indicating that these new psychiatric records pose a more difficult challenge to NLP systems. Overall, de-identification is still not a solved problem, though it is important to the future of clinical NLP.

Keywords: Clinical records; Machine learning; Natural language processing; Shared task.


Conflict of interest statement

Conflicts of Interest

The authors declare that there are no conflicts of interest.

Figures

Figure A
Figure A
Analysis of top 6 system results compared to the gold standard for Track 1A, strict matching, all PHI. The x-axis shows the number of teams who correctly identified each PHI, and the y-axis shows the number of PHI identified. Each bar is split between PHI that were immediately followed by a capital letter, and those that were not.
Figure A
Figure A
Analysis of top 6 system results compared to the gold standard for Track 1A, strict matching, all PHI. The x-axis shows the number of teams who correctly identified each PHI, and the y-axis shows the number of PHI identified. Each bar is split between PHI that were immediately followed by a capital letter, and those that were not.
Figure B
Figure B
Analysis of top 6 system results compared to the gold standard for Track 1.B, strict matching, all PHI. The x-axis shows the number of teams who correctly identified each PHI, and the y-axis shows the number of PHI identified. Each bar is split between PHI that were immediately followed by a capital letter, and those that were not.
Figure B
Figure B
Analysis of top 6 system results compared to the gold standard for Track 1.B, strict matching, all PHI. The x-axis shows the number of teams who correctly identified each PHI, and the y-axis shows the number of PHI identified. Each bar is split between PHI that were immediately followed by a capital letter, and those that were not.
Figure 1
Figure 1
Excerpt from a sample fabricated record showing errors, including spelling mistakes and missing line breaks (underlined).
Figure 2
Figure 2
Procedure for creating the gold standard
Figure 3
Figure 3
Track 1.A results by PHI category - Strict F1, all PHI.
Figure 4
Figure 4
Track 1.B results by PHI category, top 10 teams.

References

    1. AAlAbdulsalam Abdulrahman K, Meystre Stephane. Learning to De-Identify Clinical Text with Existing Hybrid Tools. Journal of Biomedical Informatics. n.d. this issue.
    1. Aberdeen John, Bayer Samuel, Clark Cheryl, Wellner Ben, Hirschman Lynette. De-Identification of Psychiatric Evaluation Notes with the MITRE Identification Scrubber Toolkit. Proceedings of the 2016 CEGS/N-GRID Shared Task in Clinical NLP 2016
    1. Duc An Bui Duy, Wyatt Mathew, Cimino James J. The UAB Informatics Institute and the 2016 CEGS N-GRID Shared-Task: De-Identification. Journal of Biomedical Informatics This issue n.d. - PMC - PubMed
    1. Cairns Brian L, Nielsen Rodney D, Masanz James J, Martin James H, Palmer Martha S, Ward Wayne H, Savova Guergana K. The MiPACQ Clinical Question Answering System. AMIA Annual Symposium Proceedings/AMIA Symposium AMIA Symposium. 2011 Oct;2011:171–80. - PMC - PubMed
    1. Carrell David, Malin Bradley, Aberdeen John, Bayer Samuel, Clark Cheryl, Wellner Ben, Hirschman Lynette. Hiding in Plain Sight: Use of Realistic Surrogates to Reduce Exposure of Protected Health Information in Clinical Text. Journal of the American Medical Informatics Association: JAMIA. 2013;20(2):342–48. - PMC - PubMed