. 2017 Jun 13;19(11):2210-2219.
doi: 10.1016/j.celrep.2017.05.064.

Cytoplasmic Dynein Transports Axonal Microtubules in a Polarity-Sorting Manner

Affiliations

Cytoplasmic Dynein Transports Axonal Microtubules in a Polarity-Sorting Manner

Anand N Rao et al. Cell Rep. .

Abstract

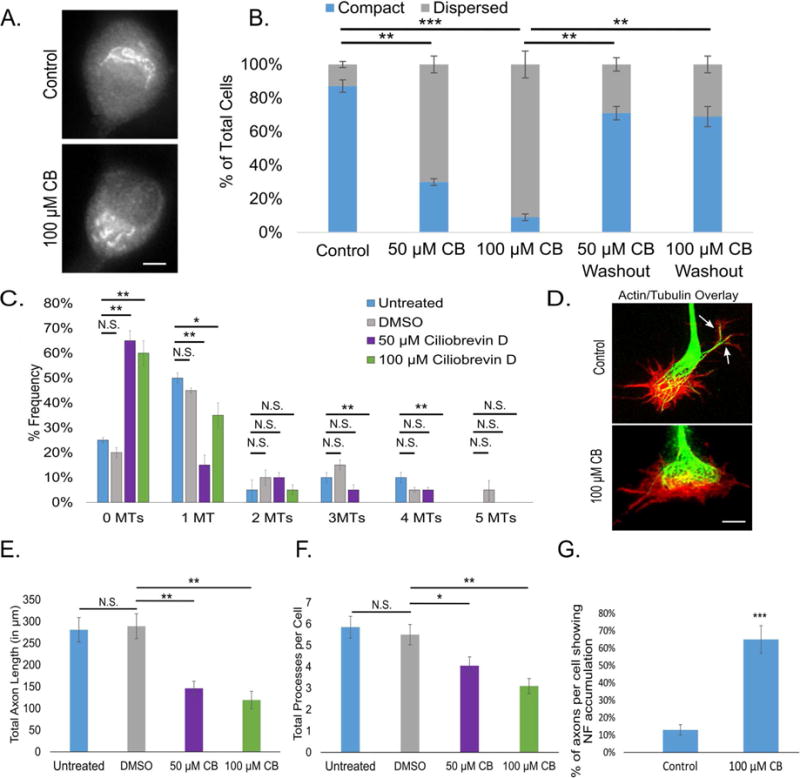
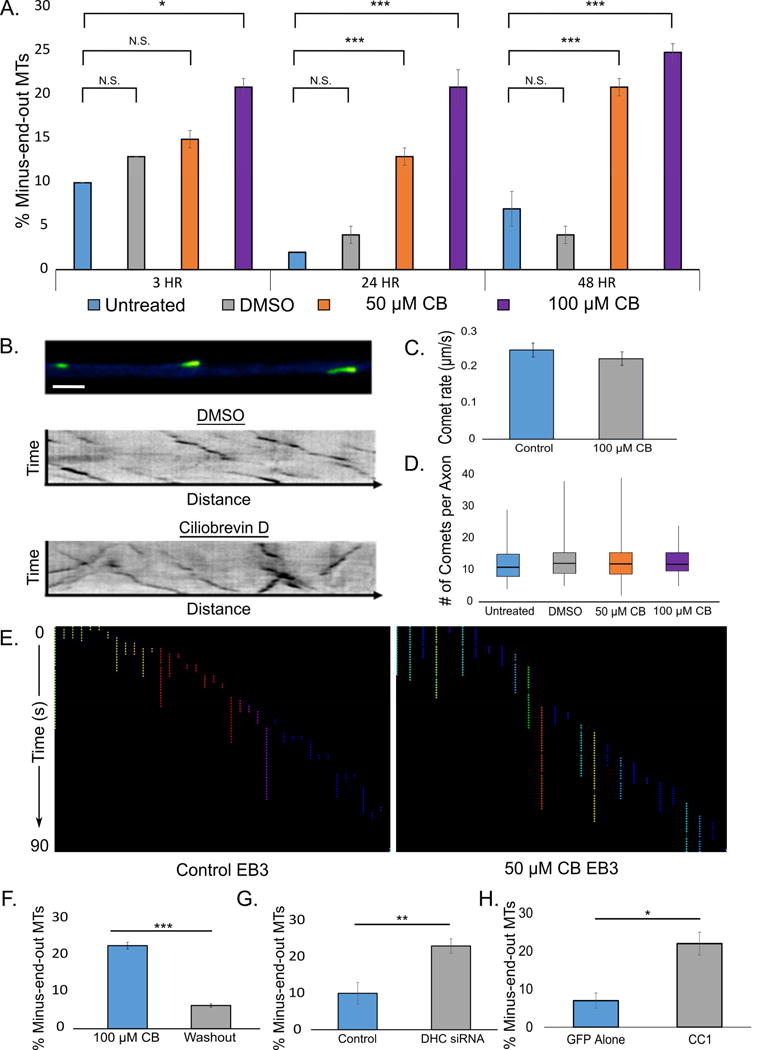
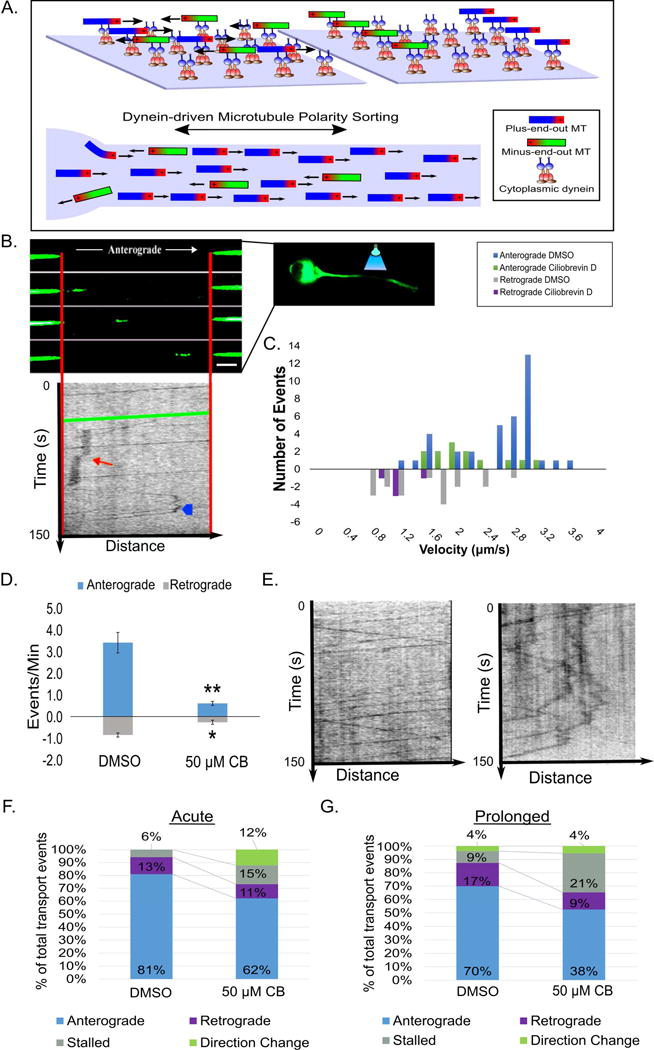
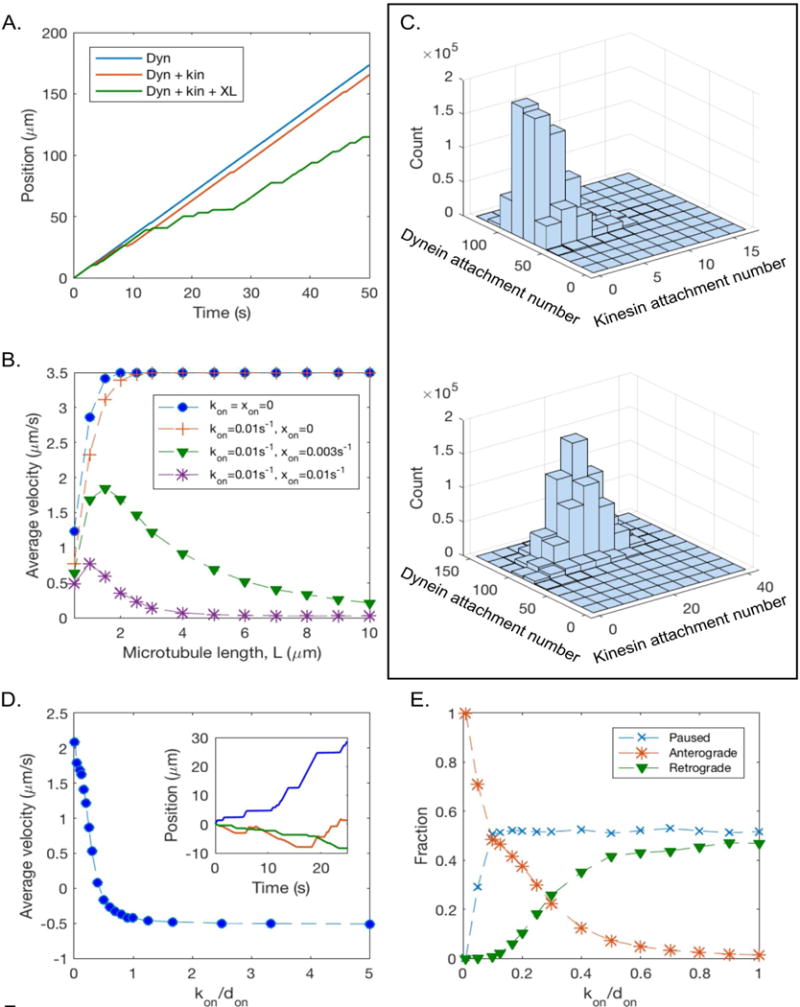
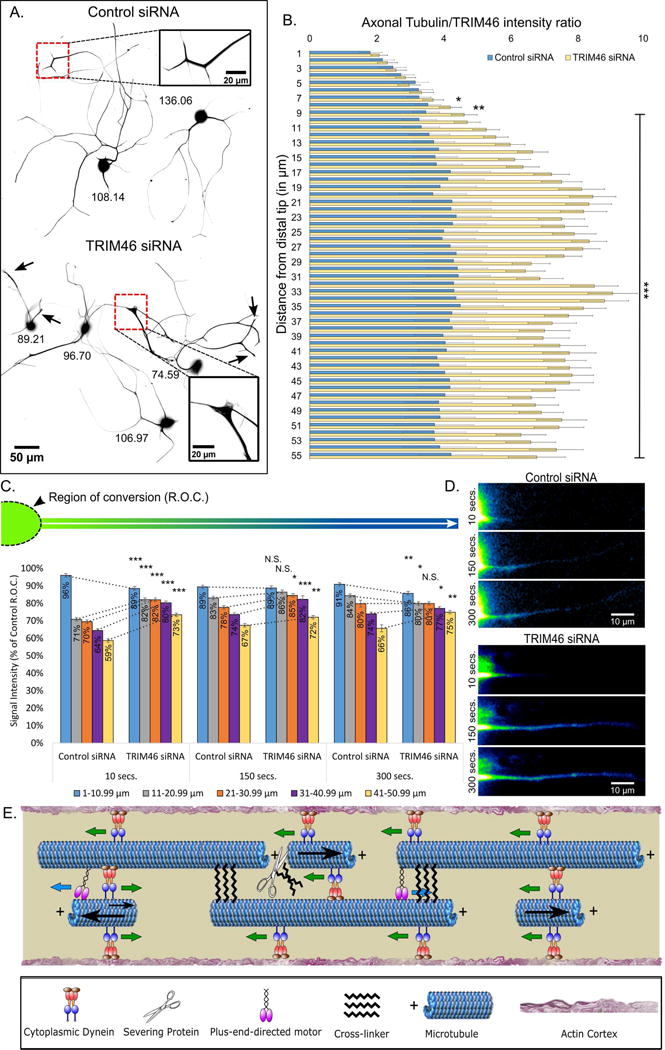
Axonal microtubules are predominantly organized into a plus-end-out pattern. Here, we tested both experimentally and with computational modeling whether a motor-based polarity-sorting mechanism can explain this microtubule pattern. The posited mechanism centers on cytoplasmic dynein transporting plus-end-out and minus-end-out microtubules into and out of the axon, respectively. When cytoplasmic dynein was acutely inhibited, the bi-directional transport of microtubules in the axon was disrupted in both directions, after which minus-end-out microtubules accumulated in the axon over time. Computational modeling revealed that dynein-mediated transport of microtubules can establish and preserve a predominantly plus-end-out microtubule pattern as per the details of the experimental findings, but only if a kinesin motor and a static cross-linker protein are also at play. Consistent with the predictions of the model, partial depletion of TRIM46, a protein that cross-links axonal microtubules in a manner that influences their polarity orientation, leads to an increase in microtubule transport.

Keywords: TRIM46; axon; cytoplasmic dynein; microtubule; microtubule polarity orientation; microtubule sliding; microtubule transport; neuron.


Figures

Figure 1
Figure 1. CB inhibits dynein specifically and reversibly in rat SCG neurons
A. Golgi immunostaining with CB or vehicle (scale bar, 5 μm). B. Bar graph showing the percent of cells with dispersed Golgi, with vehicle, CB and CB washout at two different concentrations. C. Frequency histogram of the number per growth cone of filopodia containing MTs after treatment with CB vs control. D. Actin and tubulin immunostaining of neuronal growth cones after treatment with CB or vehicle (scale bar, 2 μm). E. Bar graph depicting total axon length under varying conditions. F. Bar graph showing total processes per cell under varying conditions. G. Bar graph of the percent of axons per cell showing neurofilament accumulation with CB or vehicle. n=50 neurons per condition from 3 independent dissections. * - p<0.05; ** - p <0.01; *** p <0.001
Figure 2
Figure 2. CB leads to reversible increase in minus-end-out MTs in the axon
A. Bar graph showing the percent of MTs oriented with minus end out in axons after 3, 24, or 48 h of CB (at two different concentrations) or vehicle, as indicated by backward comets. B. (top) Micrograph of GFP-EB3 forward comets, indicating plus-end-out MTs (FIJI “Green Fire” LUT; Scale bar, 5 μm). Kymographs showing EB3 comets after DMSO (middle) or CB (bottom) treatment. C. and D. Quantification of comet rate and frequency, respectively, under control or CB conditions. No significant difference was observed. E. Comet track lengths quantified using FIJI tracking plugin. Each track represents a comet run, colors made different to increase contrast from run to run. No significant different in run length was observed between control and CB treatment. (Washout data in Fig. S2B). F. Bar graph showing the percent of MTs oriented with minus end out (indicated by backward comets) in axons 24 h after CB washout. G. Bar graph showing the percent of MTs oriented with minus end out (indicated by backward comets) in axons after treatment with DHC siRNA. H. Bar graph showing the percent of MTs oriented with minus end out (indicated by backward comets) in axons after CC1 expression. n=25 neurons per condition from 3 independent dissections. * - p<0.05; ** - p <0.01; *** p <0.001
Figure 3
Figure 3. CB disrupts MT transport
A. Schematic depicting how dynein’s MT polarity-sorting ability on glass coverslips (top) is proposed to sort MTs in the axon (bottom). B. A representative image of a MT moving through a bleached region of an axon of a neuron expressing tdEos-tubulin under control conditions (top; scale bar, 5 μm) with an affiliated kymograph (plots position over time [150 s]; middle). The green line represents the movement of the pictured MT. The red arrow shows a stall event and the blue arrowhead depicts a MT reversal. C. Frequency histogram showing anterograde and retrograde transport events under DMSO and CB conditions. D. Bar graph showing the MT transport events per min. after CB. E. Kymographs (left: control; right: CB) plotting MT transport events over time (150 s). F. and G. 100% stacked histogram of types of transport events after acute and prolonged inhibition. n=25 neurons per condition from 3 independent dissections. * - p<0.05; ** - p <0.01; *** p <0.001
Figure 4
Figure 4. Computational simulations of MT transport predict dynein-driven MT transport establishes the axonal MT polarity pattern
A. Position as a function of time for an individual MT of length L = 2 μm with plus end out, showing sample trajectories in the presence of dynein only (don = 0.1s−1, kon = xon = 0; blue line); dynein and kinesin activity (don = 0.1s−1, kon = 0.01s−1; red line); and dynein, kinesin, and static cross-linkers (don = 0.1s−1, kon = 0.01s−1, xon = 0.003s−1; green line). B. Time-averaged velocity (including pauses) of a MT with plus end out as a function of MT length, for several values of kinesin binding rate and static cross-linker binding rate. C. (top): Histogram of dynein and kinesin attachment numbers in the absence of static cross-linkers (L = 10 μm, don = 0.1s−1, kon/don = 0.1, and xon = 0). (bottom): Histogram of dynein and kinesin attachment numbers, in the presence of static cross-linkers (L = 10μm, don = 0.1s−1, kon/don = 0.1, and xon = 0.003s−1). D. Average velocity as a function of kon/don, for L = 2 μm, kon = 0.01s−1, xon = 0.003s−1. Inset: illustrative MT trajectories corresponding to kon/don = 0.1 (blue), kon/don = 0.5 (red), and kon/don = 1 (green). E. Fraction of time spent paused, moving anterogradely, and moving retrogradely as a function of kon/don. The dashed lines between data points in B, D, and E are included as a guide to the eye.
Figure 5
Figure 5. TRIM46 depletion results in redistribution of axonal MTs and an increase in MT transport
A. SCG neurons immunostained for beta-tubulin and TRIM46, with only the beta-tubulin staining shown. Image inverted to increase contrast. Upper: Neurons treated with control siRNA. Lower: Neurons treated with TRIM46 siRNA. Arrows indicate abnormally blunted tips of TRIM46-depleted axons; inset boxes show distal axons magnified. Numerals in black represent TRIM46 immunofluorescence gray value (for immunostain images of TRIM46, see Fig. S4A,B). B. Bar graph depicting the Tubulin:TRIM46 ratio in the distal region of the axon (26–28 h after TRIM46 depletion), indicating a change from (as a result of partial TRIM46 depletion) the predominantly proximal enrichment of TRIM46 to a relatively higher proportion of the remaining TRIM46 (relative to tubulin staining) in the distal region of the axon where MTs accumulate during TRIM46 depletion. C. Bar graph depicting the tdEos-tubulin signal intensity (red fluorescence after conversion from green to red) as percent of control across distances (5 groups of 10 microns; 1–10.99, 11–20.99, 21–30.99, 31–40.99, and 41–50.99) at 10 s, 150 s, and 300 s post-conversion. Relative to control, a greater amount of fluorescence recovery occurs in regions beyond the conversion zone in TRIM46-depleted axons, indicating greater levels of MT sliding (see Rao et al., 2016). D. Representative live-cell imaging frames of control and TRIM46 siRNA treated neurons expressing tdEos-tubulin, shown in FIJI “Green Fire” LUT. E. Schematic displays proposed dynein-based polarity-sorting mechanism for generating and preserving plus-end-out orientation of MTs in the axon. The proposed mechanism involves cytoplasmic dynein as the polarity-sorting motor, but also a plus-end-directed kinesin motor and a cross-linker protein. Blue arrows indicate direction of kinesin. Green arrows indicate direction of dynein. Black arrows indicate MT movement, with varying size representing directional force. n=15 neurons per condition from 3 independent dissections. * - p<0.05; ** - p<0.01; *** - p<0.001.

References

    1. AHMAD FJ, ECHEVERRI CJ, VALLEE RB, BAAS PW. Cytoplasmic dynein and dynactin are required for the transport of microtubules into the axon. J Cell Biol. 1998;140:391–401. - PMC - PubMed
    1. AHMAD FJ, HE Y, MYERS KA, HASAKA TP, FRANCIS F, BLACK MM, BAAS PW. Effects of dynactin disruption and dynein depletion on axonal microtubules. Traffic. 2006;7:524–37. - PubMed
    1. ARTHUR AL, YANG SZ, ABELLANEDA AM, WILDONGER J. Dendrite arborization requires the dynein cofactor NudE. J Cell Sci. 2015;128:2191–201. - PMC - PubMed
    1. BAAS PW, AHMAD FJ. The plus ends of stable microtubules are the exclusive nucleating structures for microtubules in the axon. J Cell Biol. 1992;116:1231–41. - PMC - PubMed
    1. BAAS PW, DEITCH JS, BLACK MM, BANKER GA. Polarity orientation of microtubules in hippocampal neurons: uniformity in the axon and nonuniformity in the dendrite. Proceedings of the National Academy of Sciences. 1988;85:8335–8339. - PMC - PubMed

Publication types

LinkOut - more resources