. 2017 Jun 13;19(11):2383-2395.
doi: 10.1016/j.celrep.2017.05.069.

Quantitative Analysis of the DNA Methylation Sensitivity of Transcription Factor Complexes

Affiliations

Quantitative Analysis of the DNA Methylation Sensitivity of Transcription Factor Complexes

Judith F Kribelbauer et al. Cell Rep. .

Abstract

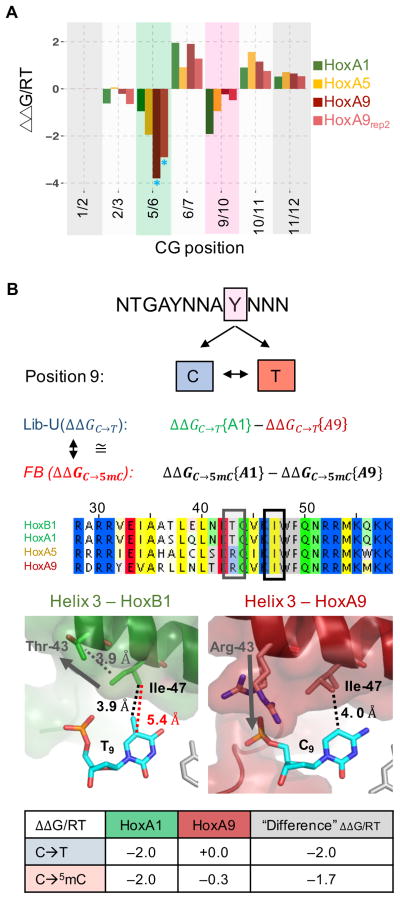
Although DNA modifications play an important role in gene regulation, the underlying mechanisms remain elusive. We developed EpiSELEX-seq to probe the sensitivity of transcription factor binding to DNA modification in vitro using massively parallel sequencing. Feature-based modeling quantifies the effect of cytosine methylation (5mC) on binding free energy in a position-specific manner. Application to the human bZIP proteins ATF4 and C/EBPβ and three different Pbx-Hox complexes shows that 5mCpG can both increase and decrease affinity, depending on where the modification occurs within the protein-DNA interface. The TF paralogs tested vary in their methylation sensitivity, for which we provide a structural rationale. We show that 5mCpG can also enhance in vitro p53 binding and provide evidence for increased in vivo p53 occupancy at methylated binding sites, correlating with primed enhancer histone marks. Our results establish a powerful strategy for dissecting the epigenomic modulation of protein-DNA interactions and their role in gene regulation.

Keywords: 5-methyl-cytosine; ChIP-seq data; SELEX-seq; bZIP; basic leucine zipper proteins; bisulfite sequencing; epigenetic DNA modification; epigenomics; high-throughput in vitro protein-DNA interaction profiling; human Hox protein complexes; integrative analysis; methylome; transcription factors; tumor suppressor protein p53.


Figures

Figure 1
Figure 1. Overview and validation of the EpiSELEX-seq design
(A) Library design. 4 bp barcodes distinguish unmodified (Lib-U) and modified (Lib-M) DNA ligands. All libraries share a random region, reverse-complement-symmetric flanks and a pair of 5′ and 3′ primer sites. (B) EpiSELEX-seq workflow. Lib-M is methylated and mixed with Lib-U. The mixed pool is incubated with a TF of interest and the bound fraction is separated by an EMSA, purified, split, and amplified using two sets of primers. Unique Illumina barcodes are added for multiplexing. (C) Validation of methylation protocol. Shown are dinucleotide frequencies in Lib-M after various combinations of optional methylation (M+/M−) and bisulfite treatment (BsT+/BsT−), determined by Illumina sequencing. The four CpN dinucleotides, for which the methylation status of the cytosine is unambiguous, are highlighted, as is TpG, which serves as a reference for CpN dinucleotides. (D) TpG-normalized recovery of the four CpN dinucletides. Only the CpGs protected by methylation are retained after bisulfite conversion.
Figure 2
Figure 2. Probing methylation sensitivity for ATF4 and C/EBPβ
(A, B) Crystal structure (PDBID: 1GTW) for the human bZIP homodimer C/EBPβ along with the symmetric consensus motifs for ATF4 (A) or for C/EBPβ (B) and the definition of ‘flank’ (green) and ‘center’ (pink) positions in the binding sites. (C) Enlargement of low affinity range comparing the relative enrichment of 10 bp oligonucleotides between Lib-M versus Lib-U for ATF4. Non-CpG sequences (blue) show similar enrichment in both libraries, while distinct subsets of the CpG-containing sequences (red) are either preferred in Lib-U (“center”) or in Lib-M (“flank”). (D) As in C but for C/EBPβ homodimers. Non-CpG and CpG-containing sequences show similar enrichments in both libraries across entire sequence range. Insets in C and D show the marginal distributions and the distribution of methylated/unmethylated ratio for all oligomers with a relative enrichment above 10−3. (E, F) Energy-Logo for ATF4 derived from Lib-U (E) and Lib-M (F). The central CpG is no longer the top choice in the methylated library. 5mCpGs at the equivalent positions −4/−3 and +3/+4 appear as a new sequence feature in Lib-M. (G) Relative affinities (each point represents a 10 bp oligomer) containing either an A (reference base) or a point mutation (C, T, or G) at position −5. The slope of the lines represents the value of ΔΔG associated with each point mutation as estimated from the Lib-U read counts using a feature-based model. (H) Lib-M versus Lib-U 10-mer relative affinity plots in logarithmic scale. Lines represent the ΔΔG coefficients for the position-dependent methylation effects derived from the feature-based model.
Figure 3
Figure 3. Deconvolving the methylation sensitivity for ATF4
(A) Decomposition of the position-specific DNA-protein binding free energy change associated with a C→T transition. The C→T change is the sum of C→5mC and 5mC→T, allowing an interpretation of methylation sensitivity in terms of “thymine mimicry.” (B) Change in binding free energy associated with C→T transition in each library as derived from an oligomer based PSAM. (C) Position-specific methylation effect on binding free energy, as estimated based on either the oligomer-enrichment-based approach (as in B; grey) or the feature-based-modeling approach (red). (D) The methylation effect as estimated using the feature-based model (red arrows) explains the differences in the C→T transition effect observed for Lib-U and Lib-M.
Figure 4
Figure 4. Methylation-sensitivity of human Pbx-Hox complexes
(A) Crystal structure (PDBID: 1PUF) of human Pbx-HoxA9 with Hox shown in blue and Pbx in green. The consensus sequence with position labels is shown as a reference. (B) Relative affinity comparison of Pbx1 plus HoxA1, HoxA5 or HoxA9 (green, orange, red). Each Hox prefers distinct sets of 12-mers. Preferred central spacers (position 6 and 7) are TG, TA and TT for HoxA1, HoxA5 and HoxA9, respectively. (C) Replicate agreement for EpiSELEX-seq of Pbx1-HoxA9. Methylated/unmethylated (M/U) ratios for 12-mers are shown for one replicate versus the other. Sequences with or without CpGs are red or dark blue respectively. Pearson correlation of 0.92. Staggered density plots show a narrow distribution of non-CpG 12-mers around 1, but a much broader and bimodal distribution for CpG 12-mers. (D) Oligomer-based energy logos for all three Pbx-Hox complexes for Lib-U and Lib-M. No obvious differences between the methylated and unmethylated libraries are observed. Central spacer is shaded in grey. (E) Lib-M versus Lib-U relative affinity plots for all three complexes. Points are colored based on the position of the CpG dinucleotide (dark blue for non-CpG sequences). The slopes of the lines represent the exponentiated free energy coefficient for the methylation effect in the feature-based (FB) model.
Figure 5
Figure 5. Collinearity of methylation sensitivity explained by structural differences
(A) Comparison of the methylation effect for all three Pbx-Hox complexes. The two A9 replicates are shown in different shades of red and have good agreement (blue asterisks indicate that coefficients were fit at sub-optimal affinity thresholds due to low counts). Position 9/10 shows large paralog-dependent differences, with HoxA1 having high, HoxA5 medium, and HoxA9 almost no methylation sensitivity; position 5/6 shows the opposite trend. (B) Comparing Hox-specific C or T read-out for position 9. HoxA1 prefers a T over a C, whereas HoxA9 has equal preference. The observed difference in binding free energy associated with a C→T transition should equal the methylation sensitivity difference between HoxA1 and HoxA9. Alignment of helix3 of several Hox TFs (B1, A1, A5, A9) reveals conservation of Ile47 for the Hox family, but polymorphism at residue 43. Ile47 interacts with the pyrimidine at position 9 in both the HoxB1 and the HoxA9 structures. The distance to the aromatic carbon 5 is 5.4 Å for HoxB1, but only 3.9Å for HoxA9. Addition of a methyl group in HoxB1 reduces the distance to 4.0 Å, allowing for the same VdW interaction as seen in HoxA9. Arg43 (A9) aids in bringing Ile47 closer to the DNA by interacting with the phosphate backbone at nucleotide C9, whereas Thr43 (B1/A1) does not interact with the backbone, but rather pulls Ile47 away from T9. The C→T energy difference between HoxA1 and HoxA9 is most likely driven by the methyl read-out. The table shows that the C→T free energy difference is comparable to the difference in methylation sensitivity (feature-based model) between the two paralogs.
Figure 6
Figure 6. p53 differentially binds methylated motifs in vivo in distinct chromatin modification states
A) EpiSELEX-seq 10-mer relative affinity plot showing the consensus motif (RRRCWWGYYY; blue) and 3 classes of CpG-containing motifs. CpG motifs are differentially bound upon methylation, with methylation of a) C4+G5+ (green) halfsites reducing binding about 20%, whereas methylation of b) C3+G4+ (cyan) and c) C1+G2+ (pink) sites increases binding ~1.5 and ~2–3 fold respectively. Non-CpG consensus sites, as expected, show no difference between Lib-U and Lib-M. The slope of the lines represents the value of ΔΔG associated with methylation at each of the identified CpG positions using the feature-based model; methylation effects related by reverse-complement symmetry, estimated independently, are shown as separate lines. (B) p53 structure (PDB-ID 3Q06) showing the DNA interface of a p53 dimer with the RRRCA|TGYYY core (labeled +/− relative to the motif center). The two arginines (R280) form hydrogen bonds with the respective G+2 bases of each pentamer half sites (2.5 and 3 Å; red) guided by the methyl groups of the pyrimidine carbon 5 of the T+1 base, which stack on top of the polar guanidinium plane (3.9 and 4 Å; blue) thus constraining the possible orientations of the positive charge in favor of forming hydrogen bonds with G+2. Methylation of a T+1→C+1 substitution would therefore result in stabilization due to regaining a methyl group at position +1. (C) Comparison of motif-centric analysis and MACS2 peak calling. Left panel: Distribution of induction levels (defined as the logarithm of the ratio of drug-induced and uninduced IP coverage) for all covered CATG or C1+G2+ sites (μ = mean and σ = standard deviation). Right panel: Fraction of decamer sites overlapping with MACS2 peak regions split by their log-transformed induction. For all three drugs and both the consensus CATG and the C1+G2+ motifs there is a highly significant trend between motif-centric induction levels and MACS2 peak calling (D) Feature model fits of drug-induced (5FU, Nutlin, RITA), in vivo P53 ChIP-seq data for MCF7 using Lib-U relative affinities, average methylation levels and CpG density within a 500 bp region as context-dependent predictors and three position-specific binary methylation indicator features. Datasets were sub-sampled to 50 sites for each possible methylation-motif combination (see Experimental Procedure for details). Upper panel shows the significance of the the methylation features with red signifying positive and blue negative effects on binding. Z-scores for C1+G2+ ranges from 3.0 (5Fu) to 6.3 (Nutlin). Lower panel shows the scores for the context dependent, confounding model predictors (highly significant across all drugs). (E) Methylation coefficients for the C1+G2+ sites were computed on the entire dataset using the feature-based model from (D) with increasing cutoffs on the sum of uninduced and drug-induced p53 IP coverage. Pink area shows the expected difference in binding free energy from EpiSELEX-seq results. (F) Overlap with peaks of histone modifications (<1 kb) for methylated and unmethylated C1+G2+ motifs (>2 sd above mean induction, dark shade). Equally sized, methylation-matched random control sets (light shade) show the expected overlap. Primed-enhancer (H3K4me1) and heterochromatin (H3K9me3) modifications but not marks of active transcription are significantly enriched in methylated C1+G2+ sites whereas unmethylated C1+G2+ sites show patterns of active transcription (H3K4me1; H3K4me3; H3K27ac), perhaps reflecting increased accessibility at active promoters. (G) Potential mechanism how aberrant methylation patterns might contribute to altered p53 binding and thus potentially contribute to changes in chromatin landscape and gene regulation.

References

    1. Ambrosi C, Manzo M, Baubec T. Dynamics and Context-Dependent Roles of DNA Methylation. J Mol Biol 2017 - PubMed
    1. Badis G, Berger MF, Philippakis AA, Talukder S, Gehrke AR, Jaeger SA, Chan ET, Metzler G, Vedenko A, Chen X, et al. Diversity and complexity in DNA recognition by transcription factors. Science. 2009;324:1720–1723. - PMC - PubMed
    1. Baylin SB, Jones PA. A decade of exploring the cancer epigenome - biological and translational implications. Nat Rev Cancer. 2011;11:726–734. - PMC - PubMed
    1. Calo E, Wysocka J. Modification of enhancer chromatin: what, how, and why? Mol Cell. 2013;49:825–837. - PMC - PubMed
    1. Consortium EP. An integrated encyclopedia of DNA elements in the human genome. Nature. 2012;489:57–74. - PMC - PubMed

Publication types

Substances