. 2017 Jun 15;2(12):e94005.
doi: 10.1172/jci.insight.94005.

Neuropeptide Y expression marks partially differentiated β cells in mice and humans

Affiliations

Neuropeptide Y expression marks partially differentiated β cells in mice and humans

Pope Rodnoi et al. JCI Insight. .

Abstract

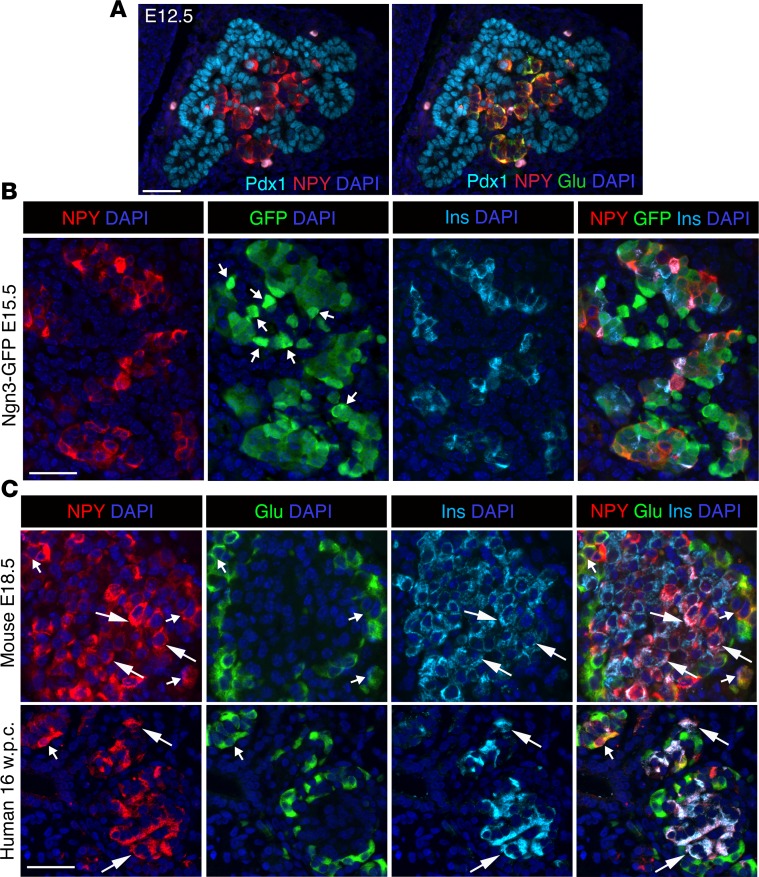
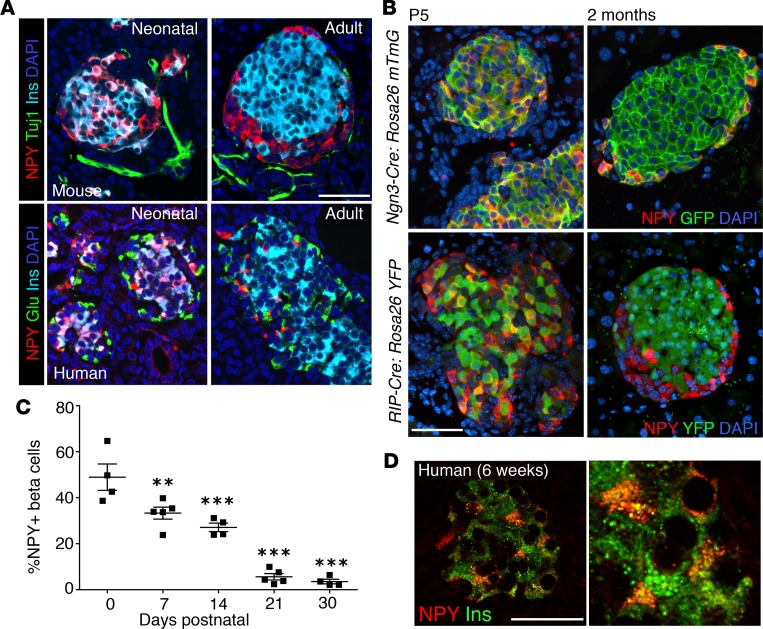
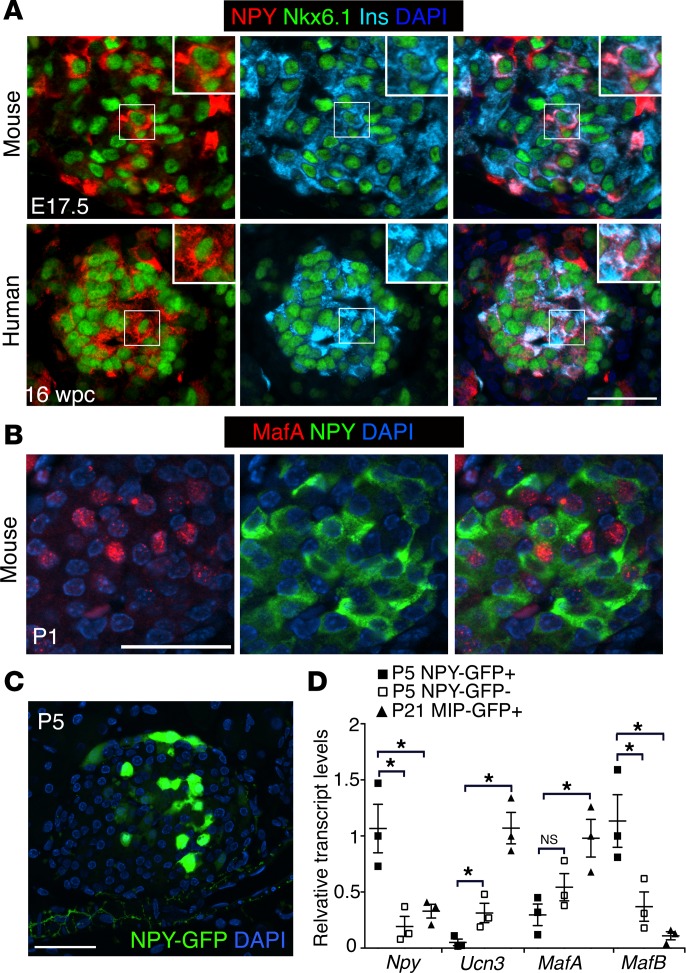
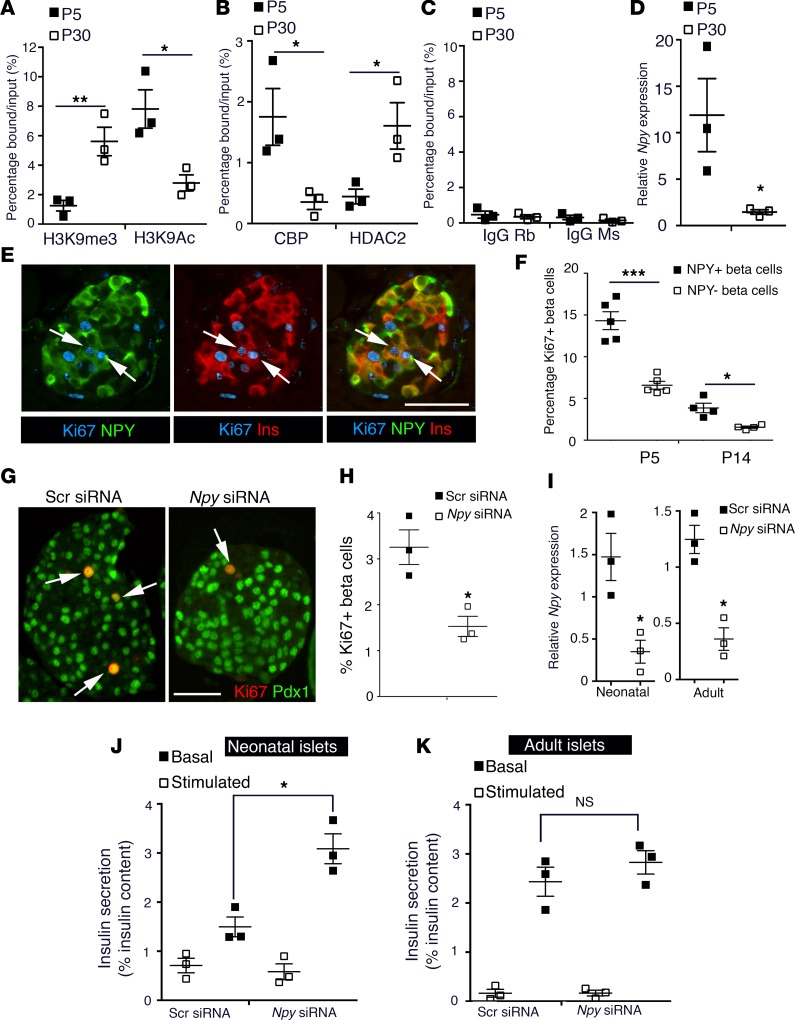
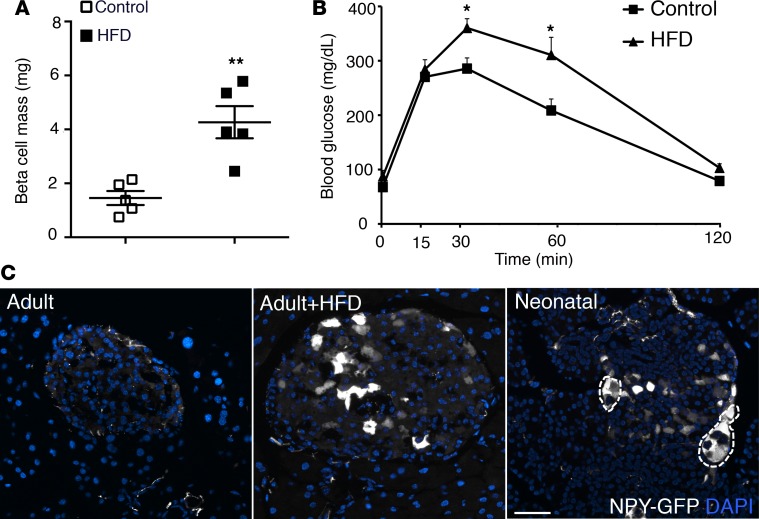
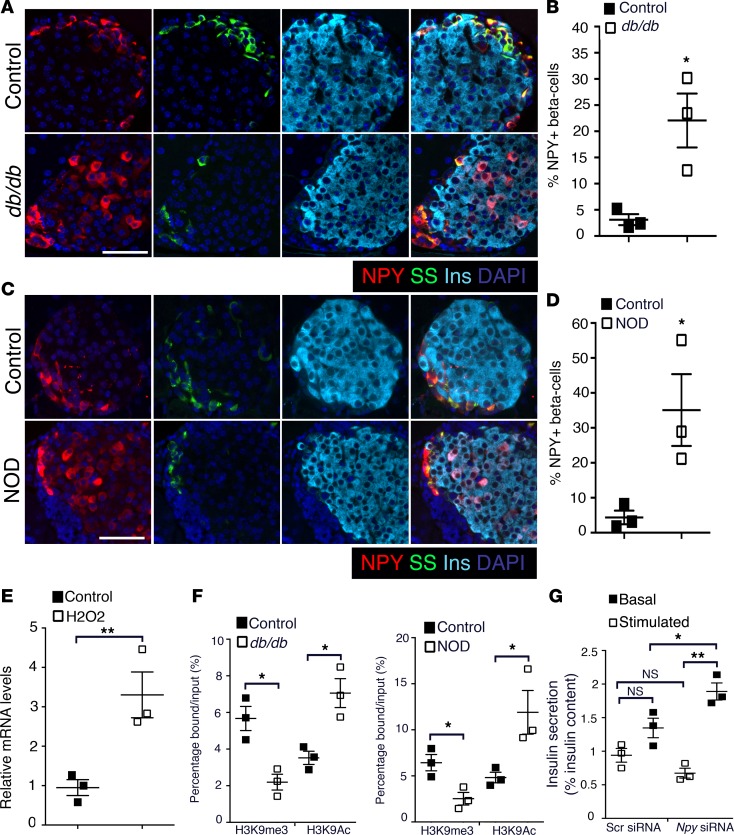
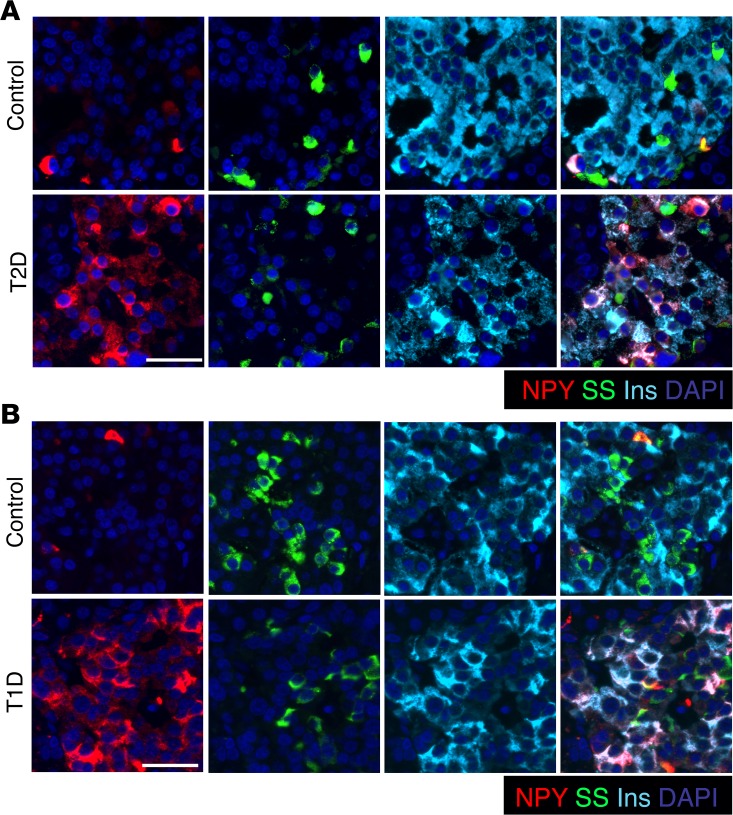
β Cells are formed in embryonic life by differentiation of endocrine progenitors and expand by replication during neonatal life, followed by transition into functional maturity. In this study, we addressed the potential contribution of neuropeptide Y (NPY) in pancreatic β cell development and maturation. We show that NPY expression is restricted from the progenitor populations during pancreatic development and marks functionally immature β cells in fetal and neonatal mice and humans. NPY expression is epigenetically downregulated in β cells upon maturation. Neonatal β cells that express NPY are more replicative, and knockdown of NPY expression in neonatal mouse islets reduces replication and enhances insulin secretion in response to high glucose. These data show that NPY expression likely promotes replication and contributes to impaired glucose responsiveness in neonatal β cells. We show that NPY expression reemerges in β cells in mice fed with high-fat diet as well as in diabetes in mice and humans, establishing a potential new mechanism to explain impaired β cell maturity in diabetes. Together, these studies highlight the contribution of NPY in the regulation of β cell differentiation and have potential applications for β cell supplementation for diabetes therapy.

Keywords: Development; Endocrinology.


Conflict of interest statement

Conflict of interest: The authors have declared that no conflict of interest exists.

Figures

Figure 1
Figure 1. NPY marks nascent β cells and is restricted from pancreatic and endocrine progenitors.
(A) Immunostaining of a representative pancreatic section from wild-type mouse embryos at E12.5 showing immunostaining for pancreatic progenitor marker Pdx1 and neuropeptide Y (NPY) or the same section overlaid with glucagon (Pdx1: cyan; NPY: red; glucagon: green), showing exclusion of NPY from pancreatic progenitors. (B) Immunostaining of representative pancreatic sections from Ngn3-EGFP (EGFP expression driven by Neurogenin3 promoter to mark endocrine progenitors) embryos at E15.5, showing NPY (red), GFP (green), insulin (Ins; cyan) and overlay with DAPI (to counterstain the nuclei; blue). Arrows indicate cells with high GFP expression defining endocrine progenitors. (C) Immunostaining for NPY (red), glucagon (Glu; green), and insulin (cyan), with DAPI (blue) in fetal mouse (E17.5) and human (16 weeks pc/gestation) pancreatic sections. Larger arrows mark overlap of NPY with insulin, while smaller arrows mark overlap of NPY with glucagon. Scale bar: 50 μm. For A and B and mouse data in C, n = 4 animals.
Figure 2
Figure 2. NPY expression declines in postnatal β cell maturation.
(A) Immunostaining of representative pancreatic sections from neonatal and adult mice (top) or humans (bottom) for NPY (red), Tuj1 or glucagon (Tuj1 or Glu; green), and insulin (Ins; cyan), with nuclei labeled by DAPI in blue. Neonatal mouse (P5), adult mouse (2 months), neonatal human (6 weeks; Mayo repository), adult human (6004, nPOD) samples are presented. (B) Representative pancreatic sections from Ngn3-Cre:Rosa26 mTmG (top) or RIP-Cre:Rosa26 YFP (bottom) mice at P5 (neonatal) and 2 months (adult) of age, stained for NPY (red) and YFP (green), overlaid with DAPI in blue. (C) Quantification of NPY expression in β cells shown as a percentage of β cells expressing NPY at different postnatal stages, namely P0, P7, P14, P21, and P30. P values shown mark the statistical significance of each sample compared with P0. (D) Immunostaining for insulin (green) and NPY (red) in neonatal human pancreatic section (6 weeks; Mayo repository), along with an image at higher magnification (original magnification, ×2.5). Scale bar: 50 μm. For A and B, n = 4 animals; for C, n = 5 animals. Error bars represent SEM of the mean. **P < 0.01, ***P < 0.005, 1-way ANOVA followed by Fisher’s LSD post-hoc test.
Figure 3
Figure 3. NPY+ β cells represent functionally immature cells.
(A) Immunostaining of representative pancreatic sections from embryonic mice (E17.5) and humans (16 weeks gestation sample: USC repository) for NPY (red), β cell transcription factor Nkx6.1 (green), and insulin (Ins; cyan). DAPI (blue) marks the nuclei. Scale bar: 50 μm. Insets show high-magnification images of the boxed regions (original magnification, ×2). (B) Immunostaining of a representative pancreatic section from wild-type neonatal mice at P1 showing NPY (green), β cell transcription factor MafA (red), and an overlay with DAPI (to counterstain the nuclei; blue). Scale bar: 40 μm. (C) A representative pancreatic section from a P5 NPY-GFP reporter mouse, showing humanized Renilla reniformis GFP (hrGFP) expression driven by the NPY promoter. hrGFP expression is shown in green, with DAPI in blue. Scale bar: 40 μm. (D) Transcript levels for indicated genes in the NPY-expressing, GFP+ (P5 NPY-GFP+) and NPY-non-expressing, GFP (P5 NPY-GFP) cell fractions sorted from neonatal (P5) NPY-GFP islets, in comparison with β cells sorted from P21 MIP-GFP+ mice. In the MIP-GFP mice GFP expression is driven by mouse insulin promoter (MIP) to label β cells. P values shown mark the statistical significance of each sample compared with neonatal NPY-expressing β cells (P5 NPY-GFP+). n = 4 animals. The error bars represent SEM of the mean. *P < 0.05, 1-way ANOVA followed by Bonferroni’s post-hoc test.
Figure 4
Figure 4. NPY expression is epigenetically regulated and modulates β cell maturation.
(AC) ChIP analysis showing the enrichment of histone modifications (A) H3K9me3 (histone H3-lysine 9 trimethylation; repressive) and H3K9Ac (histone H3 lysine 9 acetylation; activating), (B) histone acetyl transferase CBP (CREB-binding protein) and histone deacteylase HDAC2, (C) along with control rabbit and mouse IgGs, to the Npy promoter region in β cells sorted from MIP-GFP mice at P5 and P30. These data show the epigenetic repression of the Npy promoter as a function of maturation. (D) Npy mRNA expression levels, normalized to the housekeeping gene CyclophilinA in β cells sorted from MIP-GFP mice, in which GFP expression is driven by insulin promoter at P5 and P30, showing reduced expression as a function of maturation. (E) A representative pancreatic section from wild-type, neonatal (P5) mice showing immunostaining for NPY (green), insulin (Ins; red), and Ki67 (cyan). Arrows mark replicating NPY+ β cells. (F) Quantification of replication marker Ki67 in the NPY+ and NPY subpopulations of β cells in wild-type neonatal mice at P5 and P14. (G) Immunohistochemistry and (H) quantification for replication of β cells in islets isolated from neonatal (P5) mice treated with an siRNA targeting Npy or a control, scrambled siRNA. Immunostaining for replication marker Ki67 (red) and β cell marker Pdx1 (green) was used to measure β cell replication. Arrows mark Ki67 Pdx1 double-positive cells. (IK) Npy mRNA levels and static incubation glucose-stimulated insulin secretion (GSIS) assay in islets from (I) wild-type, (J) P5 pups, or (K) adult (2.5-month-old) mice, treated either with an siRNA targeting Npy or a scrambled (Scr) siRNA. Insulin secretion was measured at 2.8 mM glucose (basal) and 16.7 mM (stimulated) glucose and reported as a percentage of insulin content. Scale bar: 50 μm. For AD, average of n = 3 independent sorts; each sort had 6–8 pups at P5 and 4 mice at P30. For E and F, n = 4 animals. For GK, n = 3 independent experiments, with each replicate representing a pool of islets from 6–8 pups. The error bars represent SEM of the mean. *P < 0.05, **P < 0.01, ***P < 0.005. A 2-tailed Student’s t test was used for AD, H, and I to determine statistical significance. For F, J, and K (which involved repeat measures), statistical significance was determined by 1-way ANOVA followed by Bonferroni’s post-hoc test.
Figure 5
Figure 5. Dietary stress induces NPY expression in functionally mature β cells.
(A) β Cell mass and (B) intraperitoneal glucose tolerance test in adult (2-month-old) NPY-GFP mice on control and high-fat diets (HFDs), showing that HFD induces β cell expansion and glucose intolerance in these mice. (C) NPY promoter–driven hrGFP (humanized Renilla reniformis GFP; shown in gray) expression in pancreatic sections from NPY-GFP adult (2-month-old) mice fed with control diet (adult) or HFD (adult+HFD) or in P5 NPY-GFP mice, showing that HFD results in reexpression of NPY in adult β cells. DAPI is shown in blue. Regions marked with dotted line show pancreatic ganglia, which also express NPY. Scale bar: 50 μm. For AC, n = 5 animals. The error bars represent SEM of the mean. *P < 0.05, **P < 0.01, 1-way ANOVA followed by Fisher’s LSD post-hoc test.
Figure 6
Figure 6. NPY is reexpressed in the β cells preceding disease onset in mouse models of diabetes.
(AD) Immunostaining and quantification of NPY expression in pancreatic sections from db/db (age: 6 weeks; A and B) and NOD (age: 8 weeks; C and D) mice, with age-matched controls. Representative pancreatic sections stained for NPY (red), somatostatin (SS; green), and insulin (Ins; cyan) are shown, with DAPI marking nuclei in blue. (E) Transcript levels for Npy in islets from wild-type adult (2.5-month-old) mice treated with H2O2 or vehicle control. (F) ChIP analysis showing the levels of histone modifications H3K9me3 (histone H3-lysine 9 trimethylation; repressive) and H3K9Ac (histone H3 lysine 9 acetylation; activating) at the Npy promoter region in islets from db/db (age = 6 weeks; left) and NOD (age: 8 weeks; right) mice compared with age-matched controls, showing that the Npy promoter is active in these diabetic models. (G) Static incubation glucose-stimulated insulin secretion (GSIS) assay in islets from 6-week-old db/db mice, treated either with an siRNA targeting Npy or a control scrambled (Scr) siRNA. Insulin secretion was measured at 2.8 mM glucose (basal) and 16.7 mM (stimulated) glucose and is reported as a percentage of insulin content. These data show an improvement of GSIS in islets from prediabetic db/db mice upon treatment with Npy siRNA. Scale bar: 50 μm. For AD, n = 4 animals per group. For EG, n = 3 independent experiments, with each replicate representing a pool of islets from 3 mice. The error bars represent SEM of the mean. *P < 0.05, **P < 0.01. A 2-tailed Student’s t test was used to determine the statistical significance of the data in B, D, E, and F, while 1-way ANOVA followed by Bonferroni’s post-hoc test was used to determine statistical significance of the data in G. *P < 0.05, **P < 0.01, ***P < 0.005.
Figure 7
Figure 7. NPY expression reemerges in β cells in humans with type 1 and type 2 diabetes.
(A) Pancreatic sections were immunostained from a human donor subject with type 2 diabetes (T2D; LT2-11, Mayo; ~60% β cells positive for NPY) and an age- and BMI-matched control human subject (LND-20, Mayo; ~12% β cells positive for NPY) for NPY (red), somatostatin (SS; green), and insulin (Ins; cyan), along with nuclear counterstaining with DAPI (blue). (B) Immunostaining for NPY (red), somatostatin (green), and insulin (cyan), with DAPI in blue, in pancreatic sections from a donor subject with type 1 diabetes (T1D; 6051, nPOD; ~80% β cells positive for NPY) displaying residual β cells, and an age- and BMI-matched control donor human subject (6057, nPOD; ~14% β cells positive for NPY). Scale bar: 50 μm.

References

    1. Nair G, Hebrok M. Islet formation in mice and men: lessons for the generation of functional insulin-producing β-cells from human pluripotent stem cells. Curr Opin Genet Dev. 2015;32:171–180. doi: 10.1016/j.gde.2015.03.004. - DOI - PMC - PubMed
    1. Ahrén B. Autonomic regulation of islet hormone secretion--implications for health and disease. Diabetologia. 2000;43(4):393–410. doi: 10.1007/s001250051322. - DOI - PubMed
    1. Borden P, Houtz J, Leach SD, Kuruvilla R. Sympathetic innervation during development is necessary for pancreatic islet architecture and functional maturation. Cell Rep. 2013;4(2):287–301. doi: 10.1016/j.celrep.2013.06.019. - DOI - PMC - PubMed
    1. Arntfield ME, van der Kooy D. β-Cell evolution: How the pancreas borrowed from the brain: The shared toolbox of genes expressed by neural and pancreatic endocrine cells may reflect their evolutionary relationship. Bioessays. 2011;33(8):582–587. doi: 10.1002/bies.201100015. - DOI - PubMed
    1. Ohta Y, et al. Convergence of the insulin and serotonin programs in the pancreatic β-cell. Diabetes. 2011;60(12):3208–3216. doi: 10.2337/db10-1192. - DOI - PMC - PubMed