. 2017 Jun 15;2(12):e93411.
doi: 10.1172/jci.insight.93411.

Mitochondrial dysregulation and glycolytic insufficiency functionally impair CD8 T cells infiltrating human renal cell carcinoma

Affiliations

Mitochondrial dysregulation and glycolytic insufficiency functionally impair CD8 T cells infiltrating human renal cell carcinoma

Peter J Siska et al. JCI Insight. .

Abstract

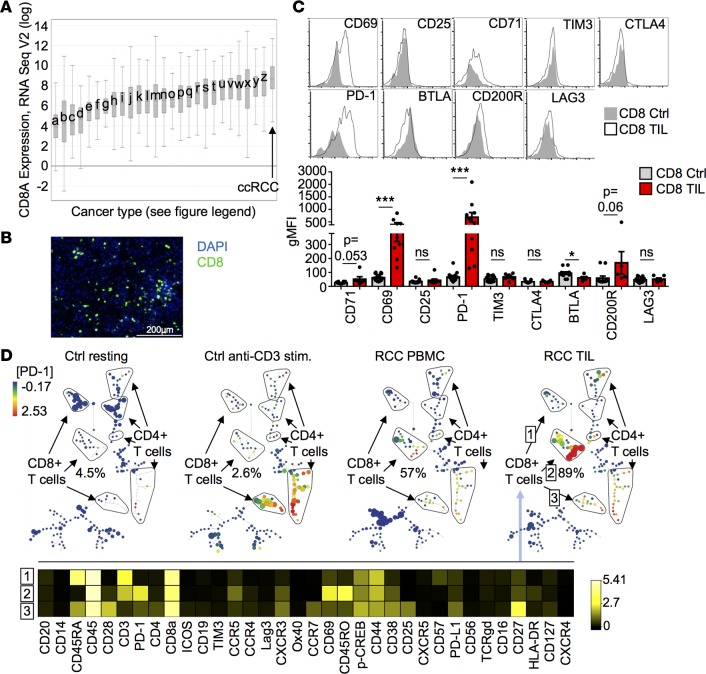
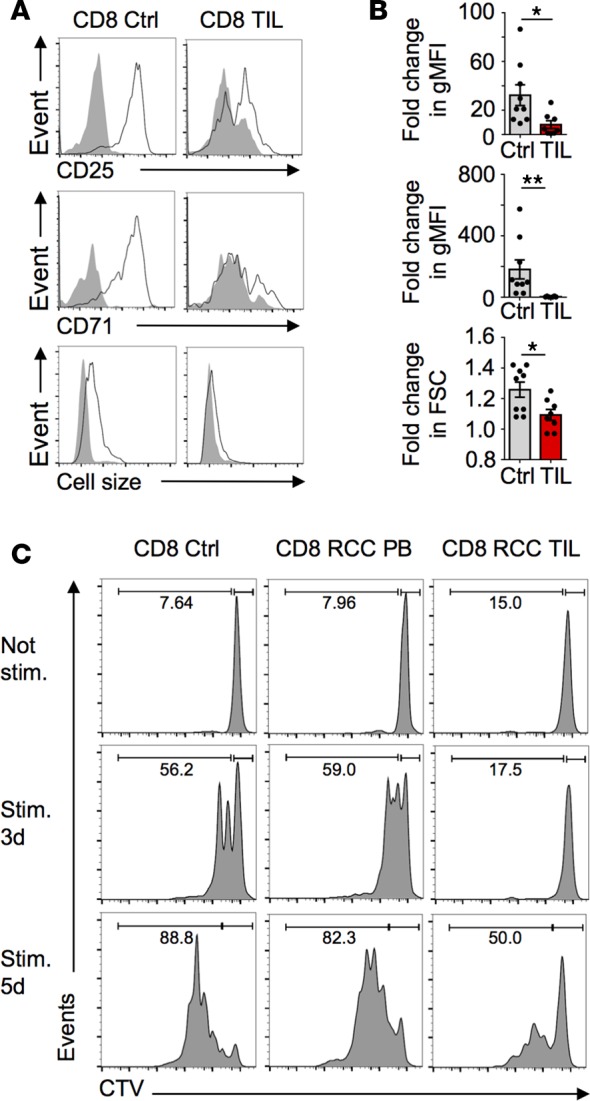
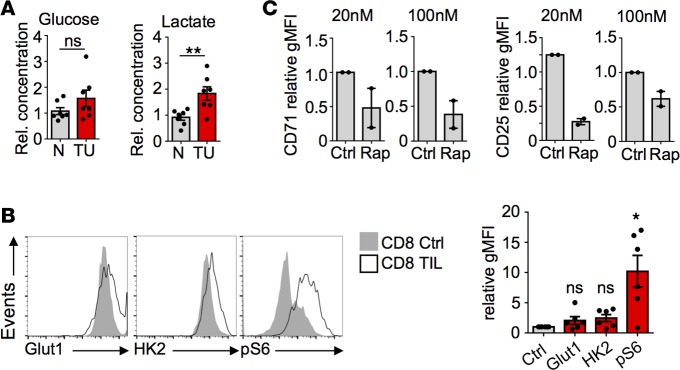
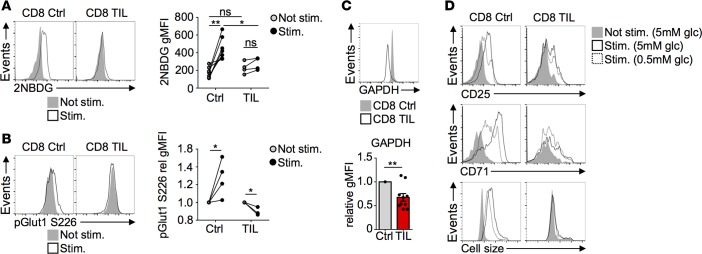
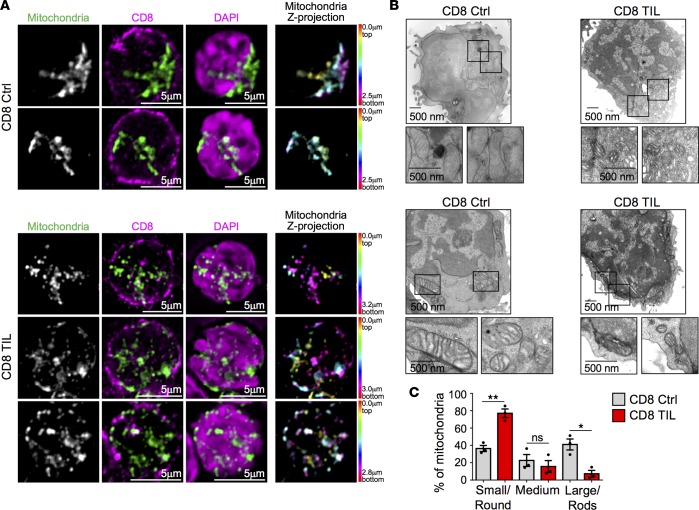
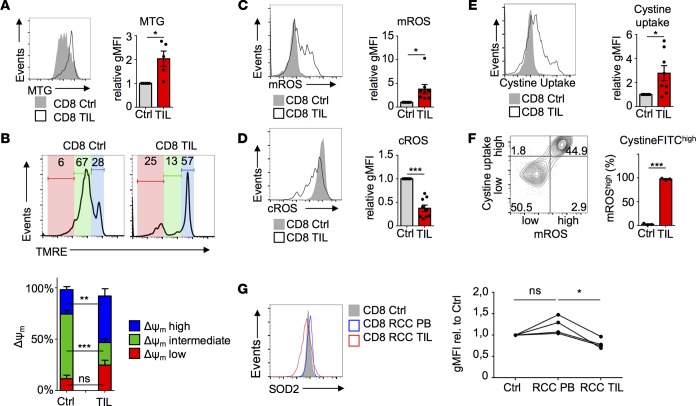
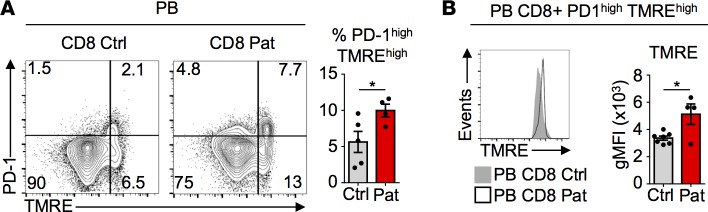
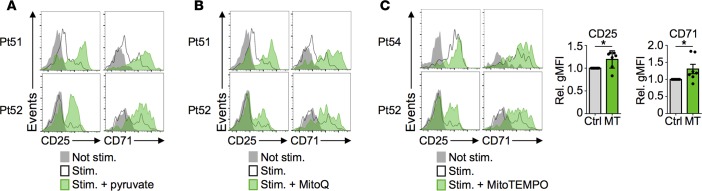
Cancer cells can inhibit effector T cells (Teff) through both immunomodulatory receptors and the impact of cancer metabolism on the tumor microenvironment. Indeed, Teff require high rates of glucose metabolism, and consumption of essential nutrients or generation of waste products by tumor cells may impede essential T cell metabolic pathways. Clear cell renal cell carcinoma (ccRCC) is characterized by loss of the tumor suppressor von Hippel-Lindau (VHL) and altered cancer cell metabolism. Here, we assessed how ccRCC influences the metabolism and activation of primary patient ccRCC tumor infiltrating lymphocytes (TIL). CD8 TIL were abundant in ccRCC, but they were phenotypically distinct and both functionally and metabolically impaired. ccRCC CD8 TIL were unable to efficiently uptake glucose or perform glycolysis and had small, fragmented mitochondria that were hyperpolarized and generated large amounts of ROS. Elevated ROS was associated with downregulated mitochondrial SOD2. CD8 T cells with hyperpolarized mitochondria were also visible in the blood of ccRCC patients. Importantly, provision of pyruvate to bypass glycolytic defects or scavengers to neutralize mitochondrial ROS could partially restore TIL activation. Thus, strategies to improve metabolic function of ccRCC CD8 TIL may promote the immune response to ccRCC.

Keywords: Immunology; Metabolism.


Conflict of interest statement

Conflict of interest: The authors have declared that no conflict of interest exists.

Figures

Figure 1
Figure 1. Dissecting the phenotype of ccRCC CD8 TIL.
(A) CD8 expression in nonlymphoid solid tumors queried in The Cancer Genome Atlas. a, glioma; b, uveal melanoma; c, adenoid cystic carcinoma (Ca); d, chromophobe renal cell carcinoma (cRCC); e, glioblastoma; f, pheochromocytoma and paraganglioma; g, uterine carcinosarcoma; h, liver Ca; i, colorectal Ca; j, bladder Ca; k, cholangiocarcinoma; l, papillary RCC; m, sarcoma; n, ovarian Ca; o, prostate Ca; p, uterine Ca; q, thyroid Ca; r, breast Ca; s, head and neck Ca; t, pancreas Ca; u, mesothelioma; v, lung sq Ca; w, cervical Ca; x, melanoma; y, lung adeno Ca; z, testicular tumors. (B) Representative IHC staining of 16 RCC patient sections for CD8 and DAPI. (C) Expression of selected markers on CD8 T cells from RCC patients (n = 5–10) or healthy donors (n = 12–17) measured with flow cytometry. Error bars represent ± SEM; *P < 0.05, **P < 0.01, and ***P < 0.001, unpaired Student’s t test. (D) Mass cytometric analysis of TIL and PMBC from RCC patients (n = 3) or resting and anti-CD3 stimulated PBMC from healthy donors (n = 2) using selected markers. Unsupervised clustering and SPADE diagram visualization was performed using Cytobank software. Heatmap shows relative expression of selected markers on 3 distinct CD8 T cell subpopulations from a representative RCC patient sample. Percentages indicate relative abundance of Group 2 in all CD8 T cells
Figure 2
Figure 2. Impaired activation and proliferation of ccRCC CD8 TIL.
(A and B) RCC samples (n = 6–8) and controls (n = 9) were in vitro anti-CD3–stimulated for 3 days, and expression of CD25 and CD71 and cell size of CD8 T cells were measured with flow cytometry. Data comparing relative increase in activation were analyzed using Wilcoxon rank sum test with continuity correction. *P < 0.05 and **P < 0.01. (C) Cells from healthy donors, RCC patient blood, or RCC patient tumors were stimulated as in A and B, and CD8 T cell proliferation was measured after 3 and 5 days using CellTrace Violet. Data are representative of 3 controls and 4 RCC patient samples.
Figure 3
Figure 3. ccRCC CD8 TIL express Glut1 and HK2 and show induction of mTORC1.
(A) Glucose and lactate concentrations were measured by NMR in interstitial fluid extracts from tumor tissue (TU) and surrounding normal kidney tissue (N) on 7 RCC patients. Concentrations were normalized to mean concentration of N. (B) Expression of Glut1 and HK2 and phosphorylation of S6 was measured on 6 RCC samples and 12 controls. (C) RCC samples (n = 2) were treated over-night with control or rapamycin in selected concentrations, and CD25 and CD71 expression was measured after drug wash-out followed by stimulation for 3 days. *P < 0.05, **P < 0.01 Student’s t test.
Figure 4
Figure 4. Decreased glucose uptake and metabolism of ccRCC CD8 TIL correlates with lower glucose dependency.
(A) 2NBDG uptake of CD8 Ctrl (n = 7) and CD8 TIL (n = 4) after 3 days of stimulation. (B) Cells were stimulated as in A, and Glut1 phosphorylation at S226 was measured with flow cytometry. (C) GAPDH expression measured on 10 RCC patient samples and 14 controls. Geometric mean fluorescence intensity (gMFI) values were normalized to controls for each separate experiment. (D) Cells were stimulated for 3 days in media containing indicated glucose concentrations, and expression of CD25 and CD71 and cell size was measured with flow cytometry. Data are representative of 4 independent experiments. Error bars represent ± SEM; *P < 0.05, **P < 0.01 and ***P < 0.001, paired Student’s t test.
Figure 5
Figure 5. Dysregulation of mitochondrial morphology in ccRCC CD8 TIL.
(A) Confocal microscopy of healthy control CD8 T cells (control, n = 2 donors, 52–105 cells per donor) or CD8 ccRCC TIL (TIL, n = 2 patients, 35–118 cells per patient), stained for mitochondria (Mitotracker), CD8, and DAPI. At right, mitochondria are color-coded based on z-position. Scale bars: 5 μm. (B and C) Electron microscopy was performed on RCC patient samples (n = 3) and healthy donors (n = 3). Shown are images of 2 patient samples and 2 controls. Mitochondrial morphology was assessed on 16–20 CD8 T cells from each sample. Scale bars: 500 nm. Error bars represent ± SEM; *P < 0.05, **P < 0.01, Student’s t test.
Figure 6
Figure 6. ccRCC CD8 TIL mitochondrial hyperpolarization and ROS accumulation correlate with increased uptake of cystine.
(A) Mitochondrial mass/mitochondrial membrane content was measured with MitoTracker Green, which is independent of membrane potential (n = 5 RCC patients and n = 8 healthy donors). (B) Mitochondrial membrane potential measurements were performed using TMRE on 4 RCC and 10 control samples. (C and D) Mitochondrial and cytosolic ROS were measured on RCC patient samples using MitoSOX (n = 8) and DCFDA (n = 9), respectively. (E) Uptake of cystine was performed using CystineFITC on CD8 T cells from RCC patients (n = 8) and controls (n = 12). (F) Mitochondrial ROS and cystine uptake was measured on CD8 T cells with flow cytometry. (G) Expression of SOD2 was measured on CD8 T cells from controls, RCC patient blood, and RCC patient TIL. Error bars represent ± SEM; *P < 0.05, **P < 0.01, and ***P < 0.001, Student’s t test.
Figure 7
Figure 7. CD8 T cells with signs of mitochondrial dysregulation can be detected in peripheral blood of ccRCC patients.
(A and B) Peripheral blood (PB) CD8 T cells from RCC patients (n = 4) and healthy controls (n = 5–7) were analyzed for PD-1 expression and TMRE accumulation using flow cytometry. Error bars represent ± SEM; *P < 0.05, Student’s t test.
Figure 8
Figure 8. Metabolic rescue increases RCC CD8 TIL activation.
(A) RCC patient samples (n = 6) were stimulated with or without additional pyruvate (5 mM) and activation was measured using CD25 and CD71 expression. Patients were stratified into low responders or high responders based on the activation in the absence of pyruvate supplementation. Data are representative of low-responder patient samples. (B and C) Cells were stimulated as in A and treated with 119 nM MitoQ or 100 nM MitoTEMPO. Expression of CD25 and CD71 was measured with flow cytometry on 6–7 RCC samples. Error bars represent ± SEM; *P < 0.05, Student’s t test.

References

    1. Melero I, et al. Therapeutic vaccines for cancer: an overview of clinical trials. Nat Rev Clin Oncol. 2014;11(9):509–524. doi: 10.1038/nrclinonc.2014.111. - DOI - PubMed
    1. Galon J, et al. Type, density, and location of immune cells within human colorectal tumors predict clinical outcome. Science. 2006;313(5795):1960–1964. doi: 10.1126/science.1129139. - DOI - PubMed
    1. Galon J, Angell HK, Bedognetti D, Marincola FM. The continuum of cancer immunosurveillance: prognostic, predictive, and mechanistic signatures. Immunity. 2013;39(1):11–26. doi: 10.1016/j.immuni.2013.07.008. - DOI - PubMed
    1. Sharma P, Allison JP. Immune checkpoint targeting in cancer therapy: toward combination strategies with curative potential. Cell. 2015;161(2):205–214. doi: 10.1016/j.cell.2015.03.030. - DOI - PMC - PubMed
    1. Topalian SL, Drake CG, Pardoll DM. Immune checkpoint blockade: a common denominator approach to cancer therapy. Cancer Cell. 2015;27(4):450–461. doi: 10.1016/j.ccell.2015.03.001. - DOI - PMC - PubMed