

PD-L1 promotes OCT4 and Nanog expression in breast cancer stem cells by sustaining PI3K/AKT pathway activation
- PMID: 28614911
- PMCID: PMC5575465
- DOI: 10.1002/ijc.30834
PD-L1 promotes OCT4 and Nanog expression in breast cancer stem cells by sustaining PI3K/AKT pathway activation
Abstract
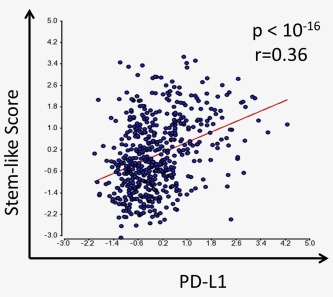
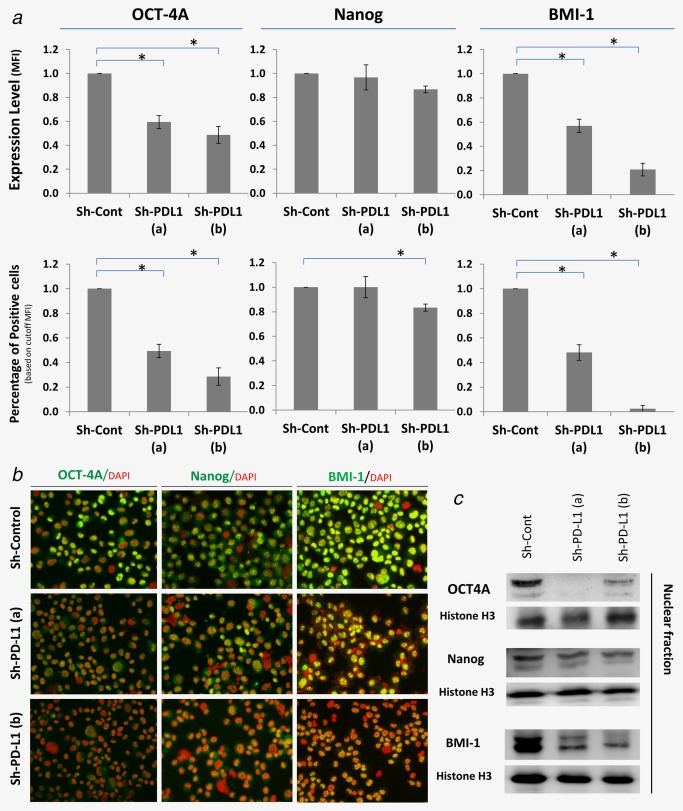
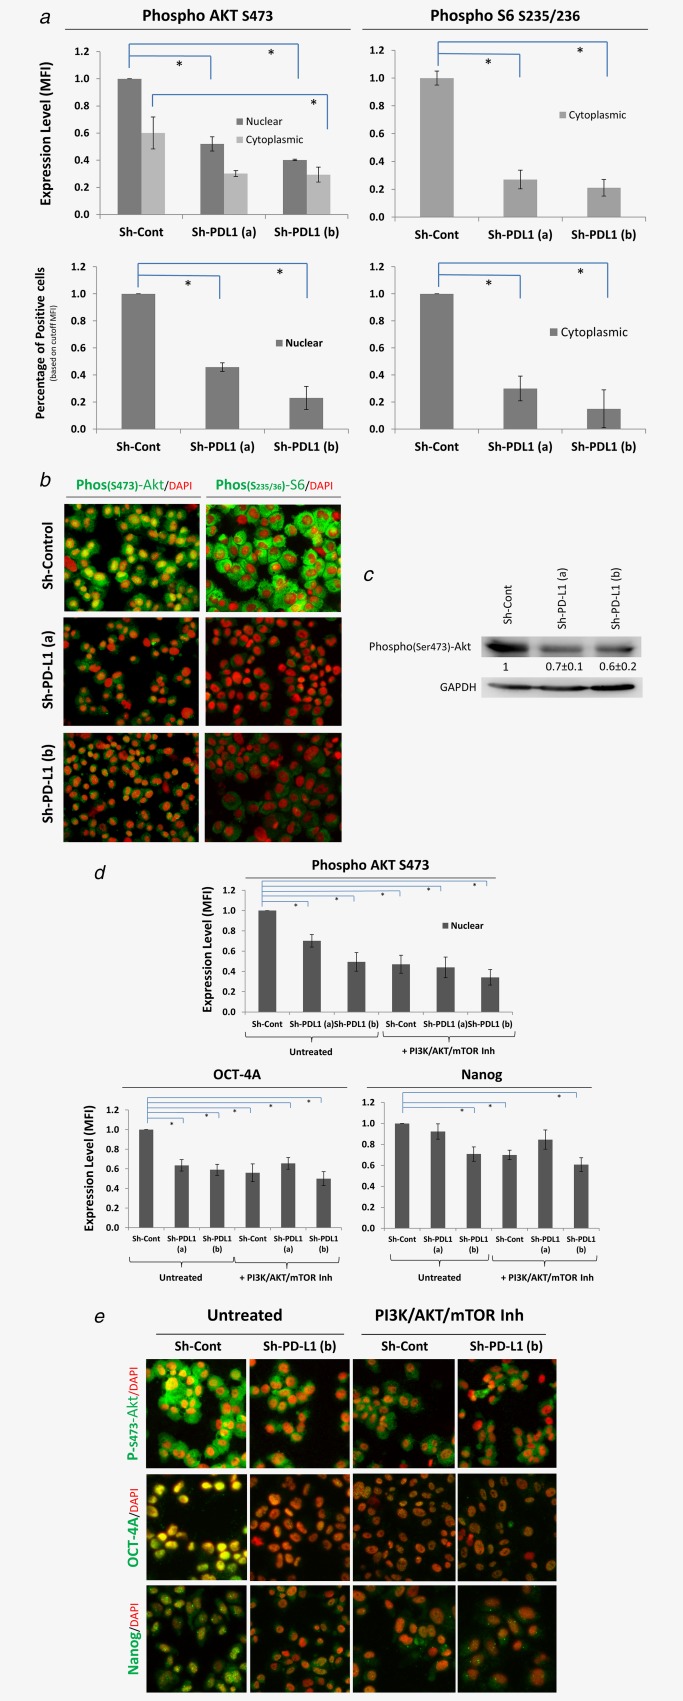
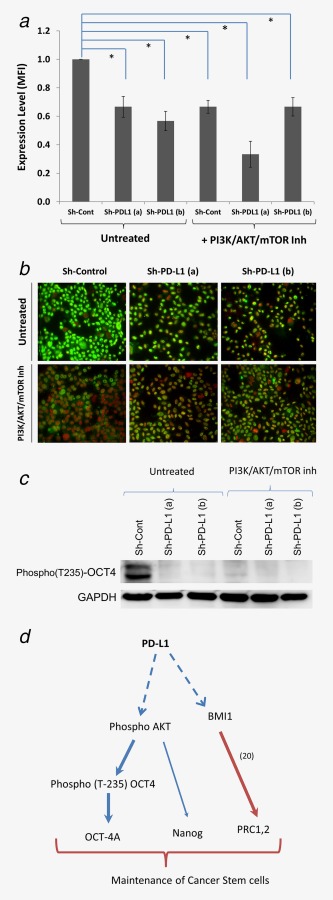
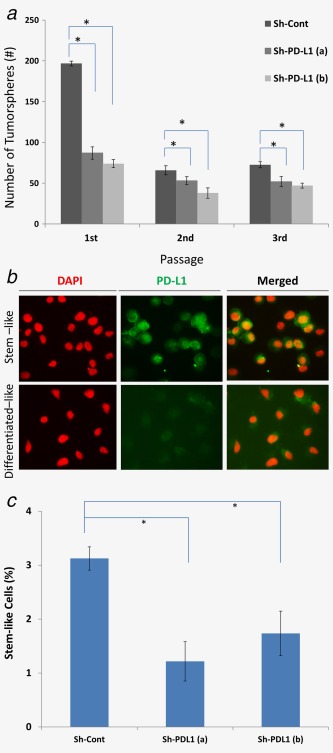
The expression of PD-L1 in breast cancer is associated with estrogen receptor negativity, chemoresistance and epithelial-to-mesenchymal transition (EMT), all of which are common features of a highly tumorigenic subpopulation of cancer cells termed cancer stem cells (CSCs). Hitherto, the expression and intrinsic role of PD-L1 in the dynamics of breast CSCs has not been investigated. To address this issue, we used transcriptomic datasets, proteomics and several in vitro and in vivo assays. Expression profiling of a large breast cancer dataset (530 patients) showed statistically significant correlation (p < 0.0001, r = 0.36) between PD-L1 expression and stemness score of breast cancer. Specific knockdown of PD-L1 using ShRNA revealed its critical role in the expression of the embryonic stem cell transcriptional factors: OCT-4A, Nanog and the stemness factor, BMI1. Conversely, these factors could be induced upon PD-L1 ectopic expression in cells that are normally PD-L1 negative. Global proteomic analysis hinted for the central role of AKT in the biology of PD-L1 expressing cells. Indeed, PD-L1 positive effect on OCT-4A and Nanog was dependent on AKT activation. Most importantly, downregulation of PD-L1 compromised the self-renewal capability of breast CSCs in vitro and in vivo as shown by tumorsphere formation assay and extreme limiting dilution assay, respectively. This study demonstrates a novel role for PD-L1 in sustaining stemness of breast cancer cells and identifies the subpopulation and its associated molecular pathways that would be targeted upon anti-PD-L1 therapy.
Keywords: AKT; Nanog; OCT4A; PD-L1; breast cancer; cancer stem cells; stemness.
© 2017 The Authors International Journal of Cancer published by John Wiley & Sons Ltd on behalf of UICC.
Figures
Similar articles
-
MiR-873/PD-L1 axis regulates the stemness of breast cancer cells.EBioMedicine. 2019 Mar;41:395-407. doi: 10.1016/j.ebiom.2019.02.034. Epub 2019 Feb 23. EBioMedicine. 2019. PMID: 30803931 Free PMC article.
-
Propofol Reduced Mammosphere Formation of Breast Cancer Stem Cells via PD-L1/Nanog In Vitro.Oxid Med Cell Longev. 2019 Feb 14;2019:9078209. doi: 10.1155/2019/9078209. eCollection 2019. Oxid Med Cell Longev. 2019. PMID: 30906504 Free PMC article.
-
Zoledronic acid inhibits the growth of cancer stem cell derived from cervical cancer cell by attenuating their stemness phenotype and inducing apoptosis and cell cycle arrest through the Erk1/2 and Akt pathways.J Exp Clin Cancer Res. 2019 Feb 21;38(1):93. doi: 10.1186/s13046-019-1109-z. J Exp Clin Cancer Res. 2019. PMID: 30791957 Free PMC article.
-
Yin Yang 1 is associated with cancer stem cell transcription factors (SOX2, OCT4, BMI1) and clinical implication.J Exp Clin Cancer Res. 2016 May 25;35:84. doi: 10.1186/s13046-016-0359-2. J Exp Clin Cancer Res. 2016. PMID: 27225481 Free PMC article. Review.
-
Cancer stem cells and epithelial-mesenchymal transition in urothelial carcinoma: Possible pathways and potential therapeutic approaches.Int J Urol. 2018 Jan;25(1):7-17. doi: 10.1111/iju.13404. Epub 2017 Jul 11. Int J Urol. 2018. PMID: 28697535 Review.
Cited by
-
Modulation of PD-L1 by Astragalus polysaccharide attenuates the induction of melanoma stem cell properties and overcomes immune evasion.BMC Cancer. 2024 Aug 21;24(1):1034. doi: 10.1186/s12885-024-12788-4. BMC Cancer. 2024. PMID: 39169294 Free PMC article.
-
Molecular Mechanism of Stem Cell Differentiation into Adipocytes and Adipocyte Differentiation of Malignant Tumor.Stem Cells Int. 2020 Aug 12;2020:8892300. doi: 10.1155/2020/8892300. eCollection 2020. Stem Cells Int. 2020. PMID: 32849880 Free PMC article. Review.
-
LncRNAs and microRNAs as Essential Regulators of Stemness in Breast Cancer Stem Cells.Biomolecules. 2021 Mar 3;11(3):380. doi: 10.3390/biom11030380. Biomolecules. 2021. PMID: 33802575 Free PMC article. Review.
-
Targeting Lipid Metabolism in Cancer Stem Cells for Anticancer Treatment.Int J Mol Sci. 2024 Oct 17;25(20):11185. doi: 10.3390/ijms252011185. Int J Mol Sci. 2024. PMID: 39456967 Free PMC article. Review.
-
Physical confinement during cancer cell migration triggers therapeutic resistance and cancer stem cell-like behavior.Cancer Lett. 2021 May 28;506:142-151. doi: 10.1016/j.canlet.2021.01.020. Epub 2021 Feb 25. Cancer Lett. 2021. PMID: 33639204 Free PMC article.
References
-
- Cancer facts and figures. American Cancer Society, 2016.
-
- Dieci MV, Arnedos M, Delaloge S, et al. Quantification of residual risk of relapse in breast cancer patients optimally treated. Breast 2013; 22 (Suppl 2):S92–5. - PubMed
-
- Robert C, Schachter J, Long GV, et al. Pembrolizumab versus ipilimumab in advanced melanoma. N Engl J Med 2015; 372:2521–32. - PubMed
Publication types
MeSH terms
Substances
LinkOut - more resources
Full Text Sources
Other Literature Sources
Medical
Molecular Biology Databases
Research Materials
