. 2017 Jun 14;10(1):120.
doi: 10.1186/s13045-017-0490-3.

Interleukin-21 promotes thymopoiesis recovery following hematopoietic stem cell transplantation

Affiliations

Interleukin-21 promotes thymopoiesis recovery following hematopoietic stem cell transplantation

Aurélie Tormo et al. J Hematol Oncol. .

Abstract

Background: Impaired T cell reconstitution remains a major deterrent in the field of bone marrow (BM) transplantation (BMT) due to pre-conditioning-induced damages inflicted to the thymi of recipient hosts. Given the previously reported thymo-stimulatory property of interleukin (IL)-21, we reasoned that its use post-BMT could have a profound effect on de novo T cell development.

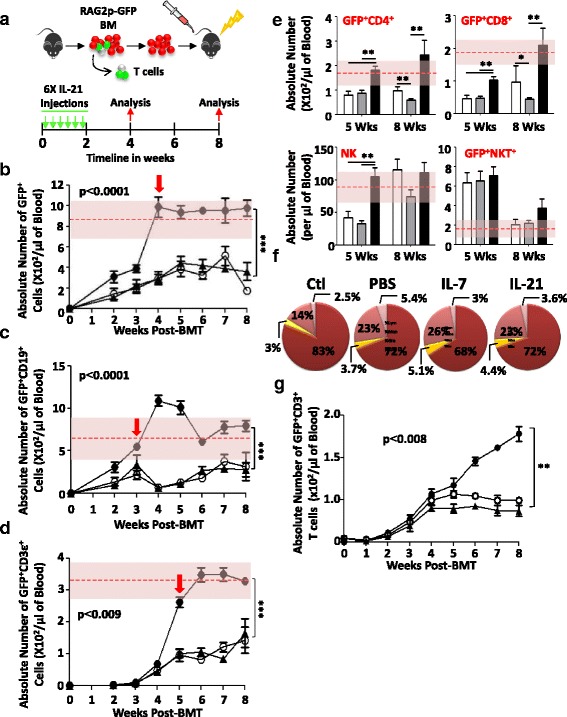
Methods: To evaluate the effect of IL-21 on de novo T cell development in vivo, BM derived from RAG2p-GFP mice was transplanted into LP/J mice. Lymphocyte reconstitution was first assessed using a hematological analyzer and a flow cytometer on collected blood samples. Detailed flow cytometry analysis was then performed on the BM, thymus, and spleen of transplanted animals. Finally, the effect of human IL-21 on thymopoiesis was validated in humanized mice.

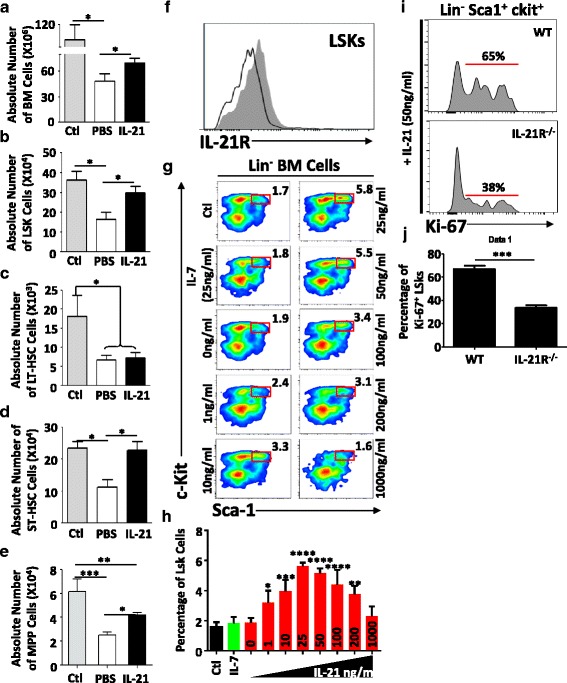
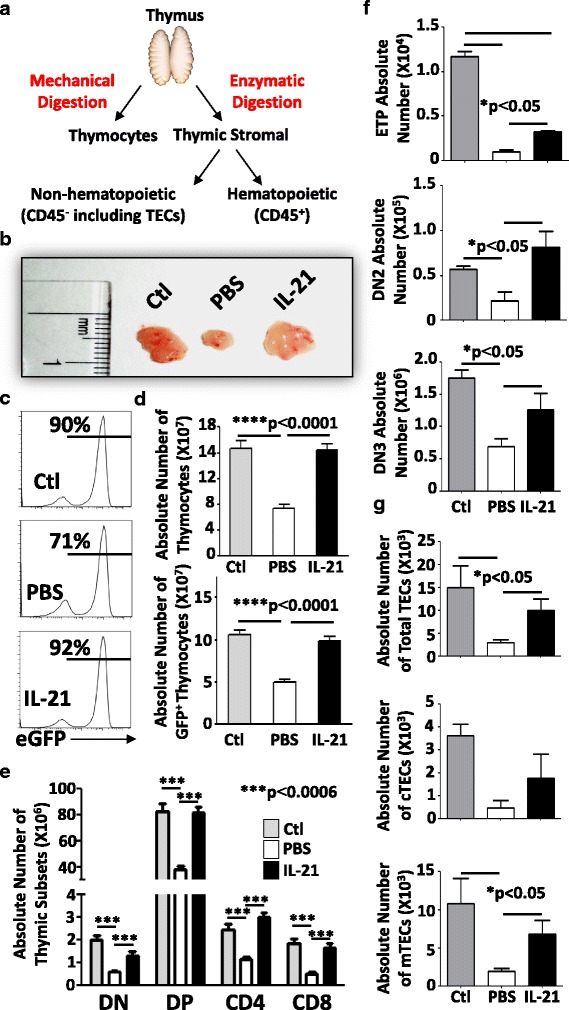
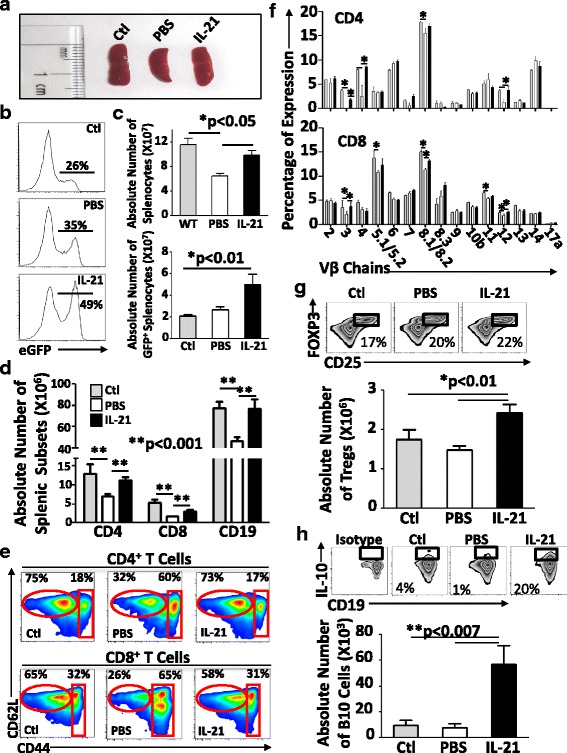
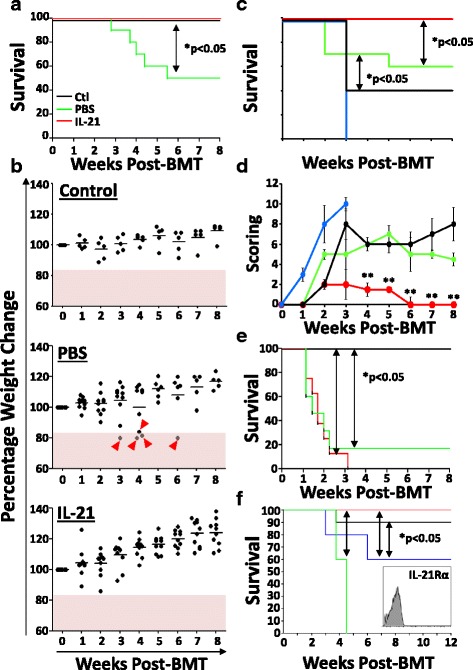
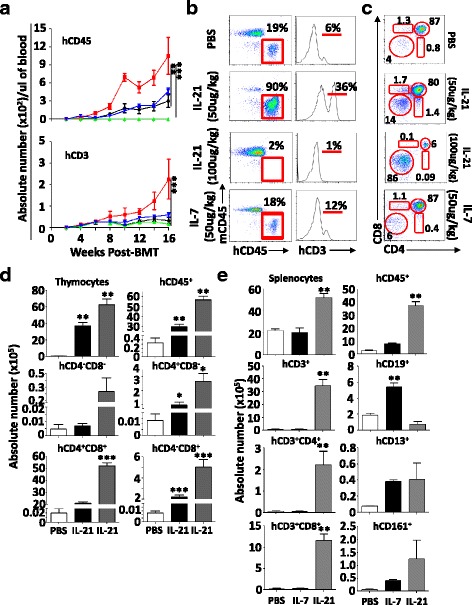
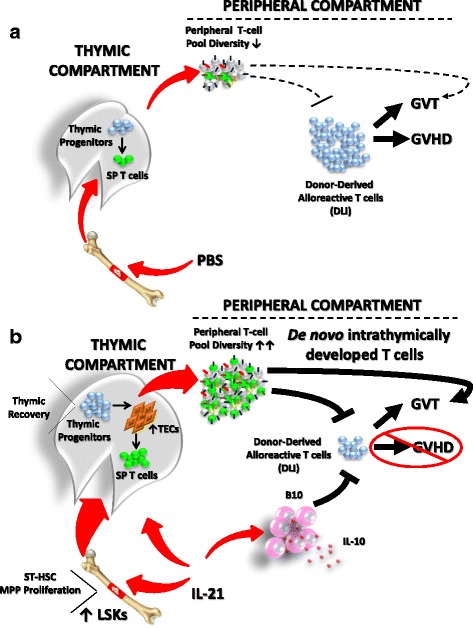
Results: Using a major histocompatibility complex (MHC)-matched allogeneic BMT model, we found that IL-21 administration improves immune reconstitution by triggering the proliferation of BM Lin-Sca1+c-kit+ (LSK) subsets. The pharmacological effect of IL-21 also culminates in the recovery of both hematopoietic (thymocytes) and non-hematopoietic (stromal) cells within the thymi of IL-21-treated recipient animals. Although T cells derived from all transplanted groups proliferate, secrete various cytokines, and express granzyme B similarly in response to T cell receptor (TCR) stimulation, full regeneration of peripheral naïve CD4+ and CD8+ T cells and normal TCRvβ distribution could only be detected in IL-21-treated recipient mice. Astonishingly, none of the recipient mice who underwent IL-21 treatment developed graft-versus-host disease (GVHD) in the MHC-matched allogeneic setting while the graft-versus-tumor (GVT) effect was strongly retained. Inhibition of GVHD onset could also be attributed to the enhanced generation of regulatory B cells (B10) observed in the IL-21, but not PBS, recipient mice. We also tested the thymopoiesis-stimulating property of human IL-21 in NSG mice transplanted with cord blood (CB) and found significant improvement in de novo human CD3+ T cell development.

Conclusions: In sum, our study indicates that IL-21 represents a new class of unforeseen thymopoietin capable of restoring thymic function following BMT.

Keywords: Graft-versus-host disease; Graft-versus-tumor; Hematopoietic stem cells; Humanized mice; IL-21; Regulatory B cells; Spleen; Thymopoiesis.


Figures

Fig. 1
Fig. 1
Peripheral T cell reconstitution. a Schematic cartoon summarizing the BMT protocol. Absolute counts of GFP+ (b), GFP+CD19+ (c), or GFP+CD3+ (d) T cells in peripheral blood of transplanted mice (n = 10/group). The red dashed line within the pink-shaded area represents the mean physiological level of the GFP+ population of interest being analyzed +1 standard deviation calculated using blood samples collected from 10 unirradiated RAG2p-GFP mice. The treatment groups are represented as follows: PBS (empty circle), IL-7 (filled triangle), and IL-21 (filled circle). e Absolute counts of GFP+CD4+, GFP+CD8+, NK+, or GFP+NKT+ cells at 5 and 8 weeks post-BMT (n = 10/group). The PBS group is represented by white bars, IL-7 by gray bars, and IL-21 by black bars. f Pie charts reflecting the percentages of all major blood-circulating immune populations. The represented groups are follows: lymphocytes in dark red (68–83%), granulocytes in pink (14–26%), monocytes in yellow (3–5.1%), and eosinophils in light pink (2.5–5.5%). Control mice (Ctl) represent unirradiated mice. g A representative BMT experiment conducted in IL-7−/− (on a C57BL/6 background) recipient mice (n = 10/group). The treatment groups are represented as follows: PBS for RAG2p-GFP-derived BM → IL-7−/− (empty circle), IL-21 (50 μg/kg) for RAG2p-GFP-derived BM → IL-7−/− (filled triangle), and a technical control consisting of PBS administration to RAG2p-GFP-derived BM → WT C57BL/6 setting (filled circle). All experiments were conducted at least three times with *P < 0.05, **P < 0.01, and ***P < 0.0001
Fig. 2
Fig. 2
BM engraftment. Absolute counts of a total BM cells, b LSKs, c LT-HSCs, d ST-HSCs, and e MPPs. Unirradiated mice were used as controls. f Representative flow cytometry analysis of IL-21R expression on the surface of LSKs. Isotype control is shown in black line whereas IL-21R staining is shown in filled gray histogram. g Representative flow cytometry experiment analyzing the frequency of LSKs in response to ascending doses of IL-21 (0–1000 ng/ml). Equivalent volume of PBS or IL-7 at 25 ng/ml was used as controls. h Quantification of LSK frequency derived from the experiment shown in g i Representative intracellular Ki-67 staining in WT versus IL-21R−/− LSK 48 h post-treatment with 50 ng/ml of IL-21. j Quantification of KI-67+ LSKs derived from the experiment shown in i. All experiments were conducted at least three times with *P < 0.05, **P < 0.01, ***P < 0.0001, and ****P < 0.00001
Fig. 3
Fig. 3
Analysis of thymic tissues. a Schematic diagram displaying the approach used for thymic analysis. b A representative photograph of thymi derived from treated mice. c Representative flow cytometry assessing the GFP frequency of treated vs. ctl mice. d Absolute numbers of total (top) or GFP+ (bottom) thymocytes. e Absolute counts of all thymic subsets. f Absolute counts of ETP (top panel), DN2 (middle panel), and DN3 (bottom panel) thymocytes. g Absolute counts of total (top panel), cortical (middle panel), and medullary (bottom panel) TECs. All shown experiments were conducted at least three times with *P < 0.05 and ***P < 0.0001 and n = 10/group
Fig. 4
Fig. 4
Spleen analysis. a A representative photograph of spleens derived from treated mice. b Representative flow cytometry of GFP expression profile in splenocytes. c Absolute counts of total (top panel) or GFP+ (bottom panel) splenocytes. d Absolute counts of all splenic subsets. e Representative flow cytometry analysis of naïve (CD62L+CD44) and effector/memory (CD62L+CD44+) CD4+ and CD8+ T cells. f TCRvβ distribution assessed by flow cytometry. g Analysis of the frequency (top panel) and absolute count of Tregs. h Analysis of the frequency (top panel) and absolute count of IL-10-producing regulatory CD1dhiCD5+ B cells. Isotype staining was used as a negative control for IL-10 detection in comparison to ctl (non-transplanted WT C57BL/6 mice), PBS-treated, or IL-21-treated LP/J mice. All shown experiments were conducted at least three times with *P < 0.05 and **P < 0.001 and n = 10/group
Fig. 5
Fig. 5
Effect of IL-21 on GVHD and GVT. a Survival curve following MHC-matched allogeneic BMT (C57BL/6 → LP/J) depicting control (syngeneic transplantation) in black, PBS-treated allogeneic BMT in green, and IL-21-treated allogeneic BMT in red. b Weight loss analysis of transplanted animals over 8 weeks post-BMT. Pink area represents a loss of ≥20%. Lost mice are indicated by red arrowheads. c Survival curve following MHC-matched allogeneic BMT depicting PBS-treated allogeneic BMT (WT C57BL/6 → LP/J) in green, IL-21-treated allogeneic BMT (WT C57BL/6 → LP/J) in red, PBS-treated allogeneic BMT (MμMT C57BL/6 → LP/J) in blue, and IL-21-treated allogeneic BMT (MμMT C57BL/6 → LP/J) in black. d Clinical score evaluation for the experiment shown in c. e Survival curve following complete MHC-mismatch allogeneic BMT (C57BL/6 → BALB/c). The color code for the groups is exactly the same one shown in a. f Survival curve for the GVT experiment conducted by challenging transplanted mice with P815 mastocytoma tumor cells. The color code for each group is as follows: green for BMT + PBS, black for BMT + IL-21, blue for BMT + DLI + PBS, and red for BMT + DLI + IL-21. e Representative flow cytometry analysis of IL-21Rα expression on the surface of the P815 tumor cell line. All shown experiments were conducted at least three times with *P < 0.05 and n = 10/group
Fig. 6
Fig. 6
Human T cell development in NSG mice. a Peripheral blood analysis for the development of CD45+ and CD3+ human cells in NSG mice transplanted with T cell-depleted CB. The PBS group is shown in black, the IL-7 group at 50 μg/kg is shown in blue, the IL-21 group at 50 μg/kg is shown in red, and the IL-21 group at 100 μg/kg is shown in green. b Representative flow cytometry assessment of murine vs. human CD45+ cells (left panels) or human CD3+ T cells (right panels) in peripheral blood of NSG mice 16 weeks post-transplantation. c Representative flow cytometry analysis of thymic populations in transplanted NSG mice. d Absolute counts of all thymic subsets derived from the NSG experiment. e Absolute counts of all spleen subsets derived from the NSG experiment. The PBS group is shown in white, the IL-7 group at 50 μg/kg is shown in black, and the IL-21 at 50 μg/kg dose is shown in gray. All shown in vivo experiments were conducted three times with *P < 0.05, **P < 0.01, and ***P < 0.0001 and n = 10/group
Fig. 7
Fig. 7
Graphical abstract. a BMT pre-conditioning damages the thymus, which results in poor thymopoiesis and the generation of a restricted peripheral TCR repertoire. Consequently, the GVT effect is limited along with the appearance of GVHD induced by DLI. b Following IL-21 administration to transplanted mice, ST-HSCs and MPPs expand most likely leading to an increase in the pool of thymus-seeding progenitors. In parallel, IL-21 triggers the proliferation of thymic progenitors, which positively affects TECs resulting in accelerated recovery of a naïve T cell pool with a diversified TCR repertoire. The newly generated thymus-derived T cells promote GVT, while GVHD is controlled by homeostatic pressure on allogeneic T cells and via the action of IL-21-induced B10 cells

References

    1. Wils EJ, Cornelissen JJ. Thymopoiesis following allogeneic stem cell transplantation: new possibilities for improvement. Blood Rev. 2005;19:89–98. doi: 10.1016/j.blre.2004.04.001. - DOI - PubMed
    1. Williams KM, Gress RE. Immune reconstitution and implications for immunotherapy following haematopoietic stem cell transplantation. Best Pract Res Clin Haematol. 2008;21:579–596. doi: 10.1016/j.beha.2008.06.003. - DOI - PMC - PubMed
    1. Porter DL, June CH. T-cell reconstitution and expansion after hematopoietic stem cell transplantation: ‘T’ it up! Bone Marrow Transplant. 2005;35:935–942. doi: 10.1038/sj.bmt.1704953. - DOI - PubMed
    1. Novitzky N, Davison GM. Immune reconstitution following hematopoietic stem-cell transplantation. Cytotherapy. 2001;3:211–220. doi: 10.1080/146532401753174043. - DOI - PubMed
    1. Geddes M, Storek J. Immune reconstitution following hematopoietic stem-cell transplantation. Best Pract Res Clin Haematol. 2007;20:329–348. doi: 10.1016/j.beha.2006.09.009. - DOI - PubMed

MeSH terms

LinkOut - more resources