

Synergistic effect of IL-12 and IL-18 induces TIM3 regulation of γδ T cell function and decreases the risk of clinical malaria in children living in Papua New Guinea
- PMID: 28615061
- PMCID: PMC5471992
- DOI: 10.1186/s12916-017-0883-8
Synergistic effect of IL-12 and IL-18 induces TIM3 regulation of γδ T cell function and decreases the risk of clinical malaria in children living in Papua New Guinea
Abstract
Background: γδ T cells are important for both protective immunity and immunopathogenesis during malaria infection. However, the immunological processes determining beneficial or detrimental effects on disease outcome remain elusive. The aim of this study was to examine expression and regulatory effect of the inhibitory receptor T-cell immunoglobulin domain and mucin domain 3 (TIM3) on γδ T cells. While TIM3 expression and function on conventional αβ T cells have been clearly defined, the equivalent characterization on γδ T cells and associations with disease outcomes is limited. This study investigated the functional capacity of TIM3+ γδ T cells and the underlying mechanisms contributing to TIM3 upregulation and established an association with malaria disease outcomes.
Methods: We analyzed TIM3 expression on γδ T cells in 132 children aged 5-10 years living in malaria endemic areas of Papua New Guinea. TIM3 upregulation and effector functions of TIM3+ γδ T cells were assessed following in vitro stimulation with parasite-infected erythrocytes, phosphoantigen and/or cytokines. Associations between the proportion of TIM3-expressing cells and the molecular force of infection were tested using negative binomial regression and in a Cox proportional hazards model for time to first clinical episode. Multivariable analyses to determine the association of TIM3 and IL-18 levels were conducted using general linear models. Malaria infection mouse models were utilized to experimentally investigate the relationship between repeated exposure and TIM3 upregulation.
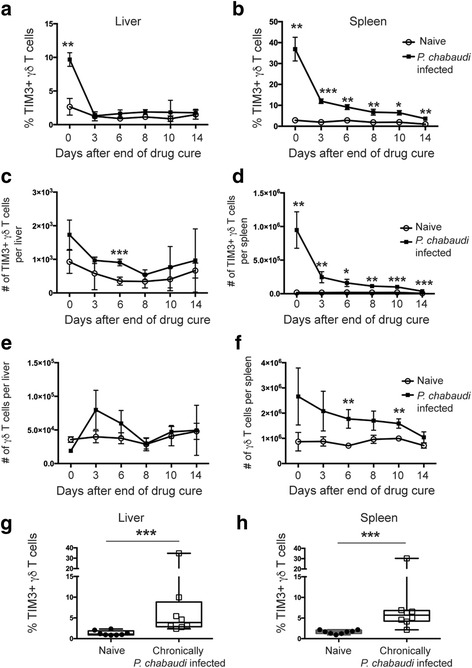
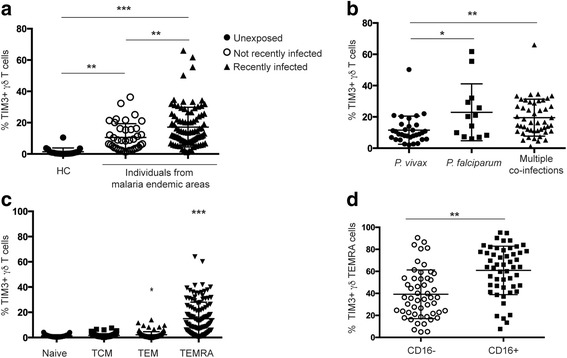
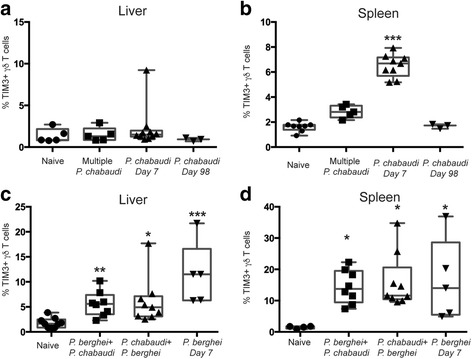
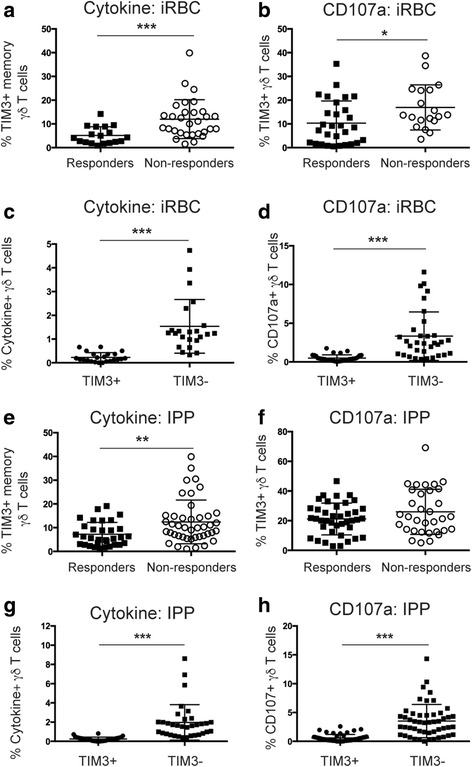
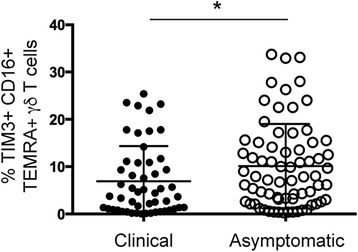
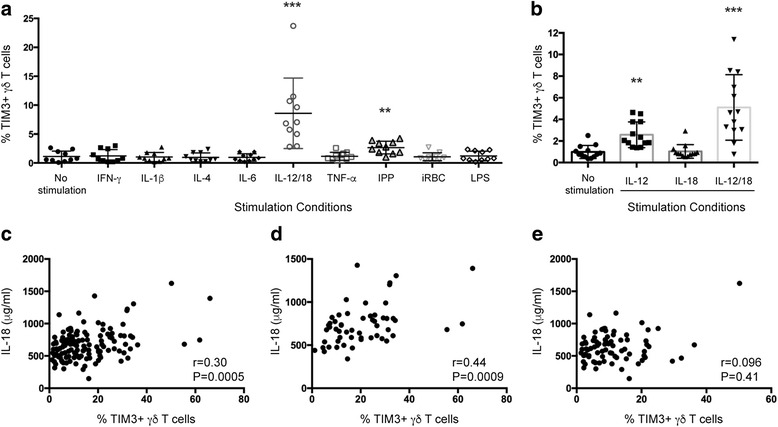
Results: This study demonstrates that even in the absence of an active malaria infection, children of malaria endemic areas have an atypical population of TIM3-expressing γδ T cells (mean frequency TIM3+ of total γδ T cells 15.2% ± 12). Crucial factors required for γδ T cell TIM3 upregulation include IL-12/IL-18, and plasma IL-18 was associated with TIM3 expression (P = 0.002). Additionally, we show a relationship between TIM3 expression and infection with distinct parasite clones during repeated exposure. TIM3+ γδ T cells were functionally impaired and were associated with asymptomatic malaria infection (hazard ratio 0.54, P = 0.032).
Conclusions: Collectively our data demonstrate a novel role for IL-12/IL-18 in shaping the innate immune response and provide fundamental insight into aspects of γδ T cell immunoregulation. Furthermore, we show that TIM3 represents an important γδ T cell regulatory component involved in minimizing malaria symptoms.
Keywords: IL-12; IL-18; Malaria; Plasmodium; TIM3; γδ T cells.
Figures
Similar articles
-
γδ T cells and CD14+ monocytes are predominant cellular sources of cytokines and chemokines associated with severe malaria.J Infect Dis. 2014 Jul 15;210(2):295-305. doi: 10.1093/infdis/jiu083. Epub 2014 Feb 12. J Infect Dis. 2014. PMID: 24523513
-
Chronic malaria exposure is associated with inhibitory markers on T cells that correlate with atypical memory and marginal zone-like B cells.Clin Exp Immunol. 2024 Apr 23;216(2):172-191. doi: 10.1093/cei/uxae015. Clin Exp Immunol. 2024. PMID: 38387476 Free PMC article.
-
Longitudinal study of changes in γδ T cells and CD4+ T cells upon asymptomatic malaria infection in Indonesian children.Sci Rep. 2017 Aug 18;7(1):8844. doi: 10.1038/s41598-017-09099-z. Sci Rep. 2017. PMID: 28821806 Free PMC article.
-
γδ T Cells in Antimalarial Immunity: New Insights Into Their Diverse Functions in Protection and Tolerance.Front Immunol. 2018 Oct 23;9:2445. doi: 10.3389/fimmu.2018.02445. eCollection 2018. Front Immunol. 2018. PMID: 30405634 Free PMC article. Review.
-
γδ T cells in malaria: a double-edged sword.FEBS J. 2021 Feb;288(4):1118-1129. doi: 10.1111/febs.15494. Epub 2020 Aug 14. FEBS J. 2021. PMID: 32710527 Free PMC article. Review.
Cited by
-
Gamma delta (γδ) T cells in the female reproductive tract: active participants or indifferent bystanders in reproductive success?Discov Immunol. 2024 Apr 26;3(1):kyae004. doi: 10.1093/discim/kyae004. eCollection 2024. Discov Immunol. 2024. PMID: 38863792 Free PMC article. Review.
-
Malawian children with uncomplicated and cerebral malaria have decreased activated Vγ9Vδ2 γδ T cells which increase in convalescence.PLoS One. 2019 Oct 10;14(10):e0223410. doi: 10.1371/journal.pone.0223410. eCollection 2019. PLoS One. 2019. PMID: 31600250 Free PMC article.
-
In Acute Dengue Infection, High TIM-3 Expression May Contribute to the Impairment of IFNγ Production by Circulating Vδ2 T Cells.Viruses. 2022 Jan 12;14(1):130. doi: 10.3390/v14010130. Viruses. 2022. PMID: 35062334 Free PMC article.
-
The impact of Plasmodium-driven immunoregulatory networks on immunity to malaria.Nat Rev Immunol. 2024 Sep;24(9):637-653. doi: 10.1038/s41577-024-01041-5. Epub 2024 Jun 11. Nat Rev Immunol. 2024. PMID: 38862638 Free PMC article. Review.
-
A Balanced Proinflammatory and Regulatory Cytokine Signature in Young African Children Is Associated With Lower Risk of Clinical Malaria.Clin Infect Dis. 2019 Aug 16;69(5):820-828. doi: 10.1093/cid/ciy934. Clin Infect Dis. 2019. PMID: 30380038 Free PMC article. Clinical Trial.
References
-
- Jones RB, Ndhlovu LC, Barbour JD, Sheth PM, Jha AR, Long BR, Wong JC, Satkunarajah M, Schweneker M, Chapman JM, et al. Tim-3 expression defines a novel population of dysfunctional T cells with highly elevated frequencies in progressive HIV-1 infection. J Exp Med. 2008;205(12):2763–2779. doi: 10.1084/jem.20081398. - DOI - PMC - PubMed
MeSH terms
Substances
Grants and funding
LinkOut - more resources
Full Text Sources
Other Literature Sources
Medical
Research Materials
Miscellaneous
