. 2017 Aug 10;91(17):e00725-17.
doi: 10.1128/JVI.00725-17. Print 2017 Sep 1.

Conserved Vδ1 Binding Geometry in a Setting of Locus-Disparate pHLA Recognition by δ/αβ T Cell Receptors (TCRs): Insight into Recognition of HIV Peptides by TCRs

Affiliations

Conserved Vδ1 Binding Geometry in a Setting of Locus-Disparate pHLA Recognition by δ/αβ T Cell Receptors (TCRs): Insight into Recognition of HIV Peptides by TCRs

Yi Shi et al. J Virol. .

Abstract

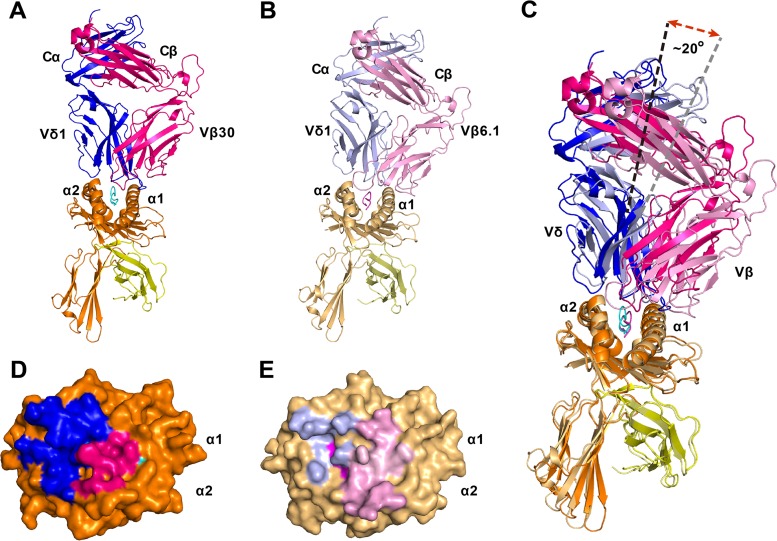
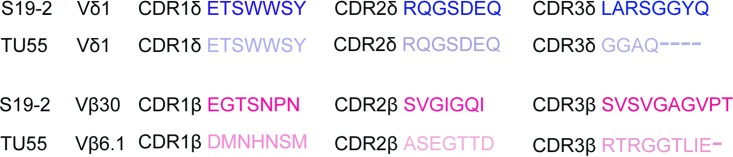
Given the limited set of T cell receptor (TCR) V genes that are used to create TCRs that are reactive to different ligands, such as major histocompatibility complex (MHC) class I, MHC class II, and MHC-like proteins (for example, MIC molecules and CD1 molecules), the Vδ1 segment can be rearranged with Dδ-Jδ-Cδ or Jα-Cα segments to form classical γδTCRs or uncommon αβTCRs using a Vδ1 segment (δ/αβTCR). Here we have determined two complex structures of the δ/αβTCRs (S19-2 and TU55) bound to different locus-disparate MHC class I molecules with HIV peptides (HLA-A*2402-Nef138-10 and HLA-B*3501-Pol448-9). The overall binding modes resemble those of classical αβTCRs but display a strong tilt binding geometry of the Vδ1 domain toward the HLA α1 helix, due to a conserved extensive interaction between the CDR1δ loop and the N-terminal region of the α1 helix (mainly in position 62). The aromatic amino acids of the CDR1δ loop exploit different conformations ("aromatic ladder" or "aromatic hairpin") to accommodate distinct MHC helical scaffolds. This tolerance helps to explain how a particular TCR V region can similarly dock onto multiple MHC molecules and thus may potentially explain the nature of TCR cross-reactivity. In addition, the length of the CDR3δ loop could affect the extent of tilt binding of the Vδ1 domain, and adaptively, the pairing Vβ domains adjust their mass centers to generate differential MHC contacts, hence probably ensuring TCR specificity for a certain peptide-MHC class I (pMHC-I). Our data have provided further structural insights into the TCR recognition of classical pMHC-I molecules, unifying cross-reactivity and specificity.IMPORTANCE The specificity of αβ T cell recognition is determined by the CDR loops of the αβTCR, and the general mode of binding of αβTCRs to pMHC has been established over the last decade. Due to the intrinsic genomic structure of the TCR α/δ chain locus, some Vδ segments can rearrange with the Cα segment, forming a hybrid VδCαVβCβ TCR, the δ/αβTCR. However, the basis for the molecular recognition of such TCRs of their ligands is elusive. Here an αβTCR using the Vδ1 segment, S19-2, was isolated from an HIV-infected patient in an HLA-A*24:02-restricted manner. We then solved the crystal structures of the S19-2 TCR and another δ/αβTCR, TU55, bound to their respective ligands, revealing a conserved Vδ1 binding feature. Further binding kinetics analysis revealed that the S19-2 and TU55 TCRs bind pHLA very tightly and in a long-lasting manner. Our results illustrate the mode of binding of a TCR using the Vδ1 segment to its ligand, virus-derived pHLA.

Keywords: HIV; coevolution; human immunodeficiency virus; pHLA; recognition; δ/αβTCR.


Figures

FIG 1
FIG 1
Functional and biophysical analyses of S19-2 and TU55. (A) Tetramer staining of the S19-2 CTL clone with the Nef138-10/A24 and Nef138-8/A24 tetramers showing specific binding to HLA-A*2402-Nef138-10. Dot plots are gated on CD8+ T cells. (B) Specific cytotoxicity of HLA-A*2402-matched target cells pulsed with 10-fold dilutions of the Nef138-10 and Nef138-8 peptides at an E:T ratio of 5:1 by the S19-2 CTL clone, showing that it is a functional clone that is specific for the Nef138-10 peptide. (C) High-affinity and slow-kinetic interaction between HLA-A*2402-Nef138-10 and the S19-2 TCR measured by SPR. A series of concentrations of the TCR (from 0.0625 to 8 μM) was used to measure binding kinetics, showing a strong interaction. KD, dissociation constant. (D) Equilibrium saturation plot for binding of S19-2 to HLA-A*24:02/Nef138-10. (E) High-affinity and slow-kinetic interaction between HLA-B*3501-Pol448-9 and the TU55 TCR measured by SPR. A series of concentrations of the TCR (from 0.125 to 8 μM) was used to measure binding kinetics, showing a strong interaction. (F) Equilibrium saturation plot for binding of TU55 to HLA-B*35:01/Pol448-9.
FIG 2
FIG 2
Overall structures of S19-2/TU55 in complex with the ligands and their footprints. (A) Ribbon diagram showing the overall backbone structure of the S19-2/HLA-A*2402-Nef138-10 complex. The S19-2 TCR is shown in blue (hybrid chain VδJαCα) and hot pink (β chain), and HLA-A*2402-Nef138-10 is shown in orange (heavy chain), in yellow (β2M), and in cyan (the peptide). (B) Ribbon diagram showing the overall backbone structure of the TU55/HLA-B*3501-Pol448-9 complex. The TU55 TCR is shown in light blue (hybrid chain VδJαCα) and pink (β chain), and HLA-B*3501-Pol448-9 is shown in light orange (heavy chain), in olive (β2M), and in magenta (the peptide). (C) Superimposition of the S19-2/HLA-A*2402-Nef138-10 and TU55/HLA-B*3501-Pol448-9 complex structures. There is an ∼20° deviation in the binding orientations of the S19-2 and TU55 TCRs. (D and E) TCR footprints on the specific peptide-HLA complex. In the S19-2/HLA-A*2402-Nef138-10 complex, the interaction is dramatically Vδ centric (774.4 Å2 versus 289.1 Å2), while in the TU55/HLA-B*3501-Pol448-9 complex, the interaction is moderately Vβ centric (517.6 Å2 versus 574.1 Å2).
FIG 3
FIG 3
Comparison of CDR loop footprints of S19-2 and TU55. (A) Top view of CDR loop footprints of S19-2 and TU55. (B) Side view of CDR loop footprints of S19-2 and TU55. (C) Interaction between S19-2 and its ligand. Four CDR loops (CDR1δ, CDR2δ, CDR3δ, and CDR3β) of S19-2 participate in binding. CDR1δ contributes the most to the interaction. The values in parentheses represent the numbers of hydrogen bonds. (D) Interaction between TU55 and its ligand. Five CDR loops (CDR1δ, CDR2δ, CDR3δ, CDR2β, and CDR3β) of TU55 participate in binding. The CDR1δ loop contributes the most to the interaction. The values in parentheses represent the numbers of hydrogen bonds.
FIG 4
FIG 4
Conserved CDR1δ signature in δ/αβTCRs. (A) Interaction between the CDR1δ loop of the S19-2 TCR and the HLA-A*2402 molecule. The CDR1δ loop displays an extended “ladder” conformation. (B) Interaction between the CDR1δ loop of the TU55 TCR and the HLA-B*3501 molecule. The CDR1δ loop displays a folded “hairpin” conformation. (C) Interaction between the CDR1δ loop of the clone 12 TCR and the HLA-B*3501 molecule. The CDR1δ loop displays an extended ladder conformation. The hydrogen bonds are shown as green dashed lines. Aromatic residue W29 contributes to the majority of the interactions in all three TCRs.
FIG 5
FIG 5
Sequence alignment of CDR loops of the S19-2 TCR and TU55 TCR.
FIG 6
FIG 6
Contact residues between the CDR loops and pHLAs. The hydrogen bonds are shown as green dashed lines. (A) Interaction residues between the CDR3δ loop and pHLA in the S19-2/HLA-A*2402-Nef138-10 complex structure. (B) Interaction residues between the CDR2δ loop and pHLA in the S19-2/HLA-A*2402-Nef138-10 complex structure. (C) Interaction residues between the CDR3β loop and pHLA in the S19-2/HLA-A*2402-Nef138-10 complex structure. (D) Interaction residues between the CDR3δ loop and pHLA in the TU55/HLA-B*3501-Pol448-9 complex structure. (E) Interaction residues between the CDR2δ loop and pHLA in the TU55/HLA-B*3501-Pol448-9 complex structure. (F) Interaction residues between the CDR2β loop and pHLA in the TU55/HLA-B*3501-Pol448-9 complex structure. (G) Interaction residues between the CDR3β loop and pHLA in the TU55/HLA-B*3501-Pol448-9 complex structure. (H and L) Comparison of binding geometry of S19-2 and TU55 in a side view (H) and top view (L). The mass centers of the Vδ and Vβ domains are shown as spheres.
FIG 7
FIG 7
Peptide recognitions and conformational changes of pHLA upon binding. The hydrogen bonds are shown as green dashed lines. (A) Contact residues between the peptide and the CDR1δ, CDR3δ, and CDR3β loops in the S19-2/HLA-A*2402-Nef138-10 complex structure. (B) Contact residues between the peptide and the CDR1δ, CDR3δ, and CDR3β loops in the TU55/HLA-B*3501-Pol448-9 complex structure. (C) Comparison of free (yellow) and bound (cyan) HLA-A*2402 molecules. The α1 helices of both the free and bound molecules were superimposed. (D) Comparison of free (green) and bound (magenta) HLA-B*3501 molecules. The α1 helices of both the free and bound molecules were superimposed. (E) Comparison of free (yellow) and bound (cyan) Nef138-10 peptides. (F) Comparison of free (green) and bound (magenta) Pol448-9 molecules.
FIG 8
FIG 8
Omit electron density maps of peptides. The panels show 2FoFc electron density maps for different peptides, Nef138-10 in HLA-A24:02-Nef138-10 (A), Nef138-10 in S19-2/HLA-A24:02-Nef138-10 (B), Pol448-9 in HLA-B*35:01-Pol448-9 (C), and Pol448-9 in TU55/HLA-B35:01-Pol448-9 (D), contoured at 1.0 σ. The 2FoFc maps were generated by using the FFT program in CCP4 software, and the figures were drawn by using PyMOL software.

Similar articles

Cited by

References

    1. Rossjohn J, Gras S, Miles JJ, Turner SJ, Godfrey DI, McCluskey J. 2015. T cell antigen receptor recognition of antigen-presenting molecules. Annu Rev Immunol 33:169–200. doi:10.1146/annurev-immunol-032414-112334. - DOI - PubMed
    1. Turner SJ, Doherty PC, McCluskey J, Rossjohn J. 2006. Structural determinants of T-cell receptor bias in immunity. Nat Rev Immunol 6:883–894. doi:10.1038/nri1977. - DOI - PubMed
    1. Garboczi DN, Ghosh P, Utz U, Fan QR, Biddison WE, Wiley DC. 1996. Structure of the complex between human T-cell receptor, viral peptide and HLA-A2. Nature 384:134–141. doi:10.1038/384134a0. - DOI - PubMed
    1. Garcia KC, Degano M, Stanfield RL, Brunmark A, Jackson MR, Peterson PA, Teyton L, Wilson IA. 1996. An alphabeta T cell receptor structure at 2.5 A and its orientation in the TCR-MHC complex. Science 274:209–219. doi:10.1126/science.274.5285.209. - DOI - PubMed
    1. O'Brien RL, Roark CL, Jin N, Aydintug MK, French JD, Chain JL, Wands JM, Johnston M, Born WK. 2007. Gammadelta T-cell receptors: functional correlations. Immunol Rev 215:77–88. doi:10.1111/j.1600-065X.2006.00477.x. - DOI - PubMed

LinkOut - more resources