. 2017 Oct;16(10):2267-2280.
doi: 10.1158/1535-7163.MCT-17-0157. Epub 2017 Jun 14.

Ormeloxifene Suppresses Prostate Tumor Growth and Metastatic Phenotypes via Inhibition of Oncogenic β-catenin Signaling and EMT Progression

Affiliations

Ormeloxifene Suppresses Prostate Tumor Growth and Metastatic Phenotypes via Inhibition of Oncogenic β-catenin Signaling and EMT Progression

Bilal Bin Hafeez et al. Mol Cancer Ther. 2017 Oct.

Abstract

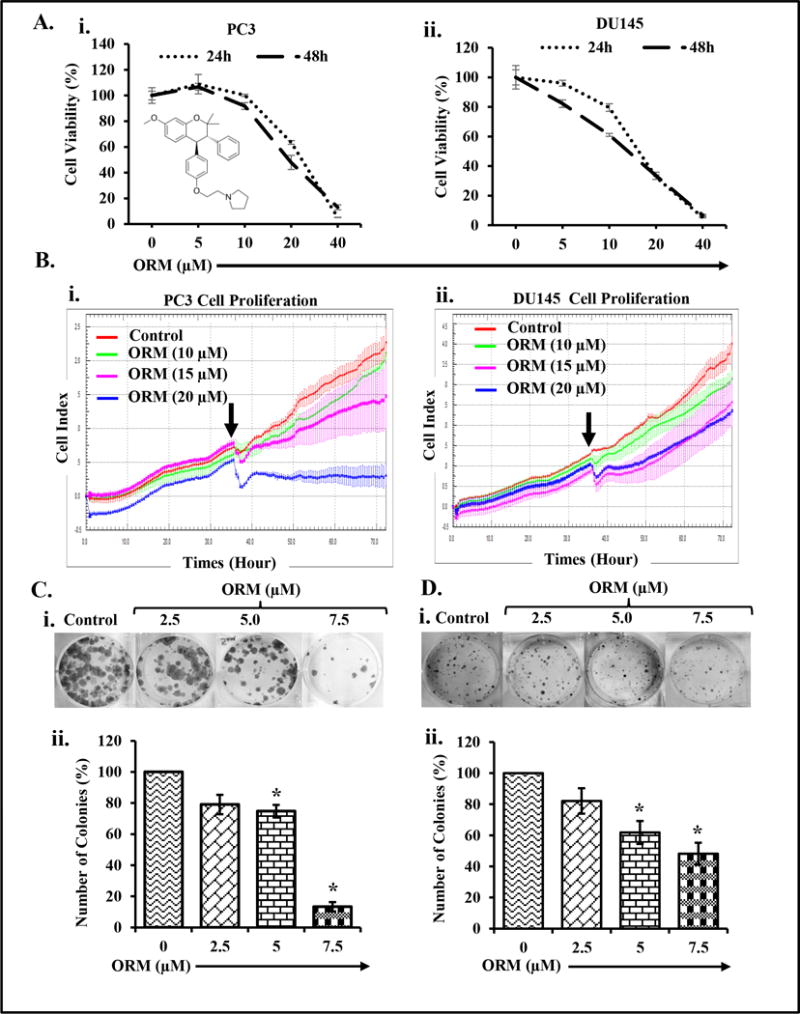
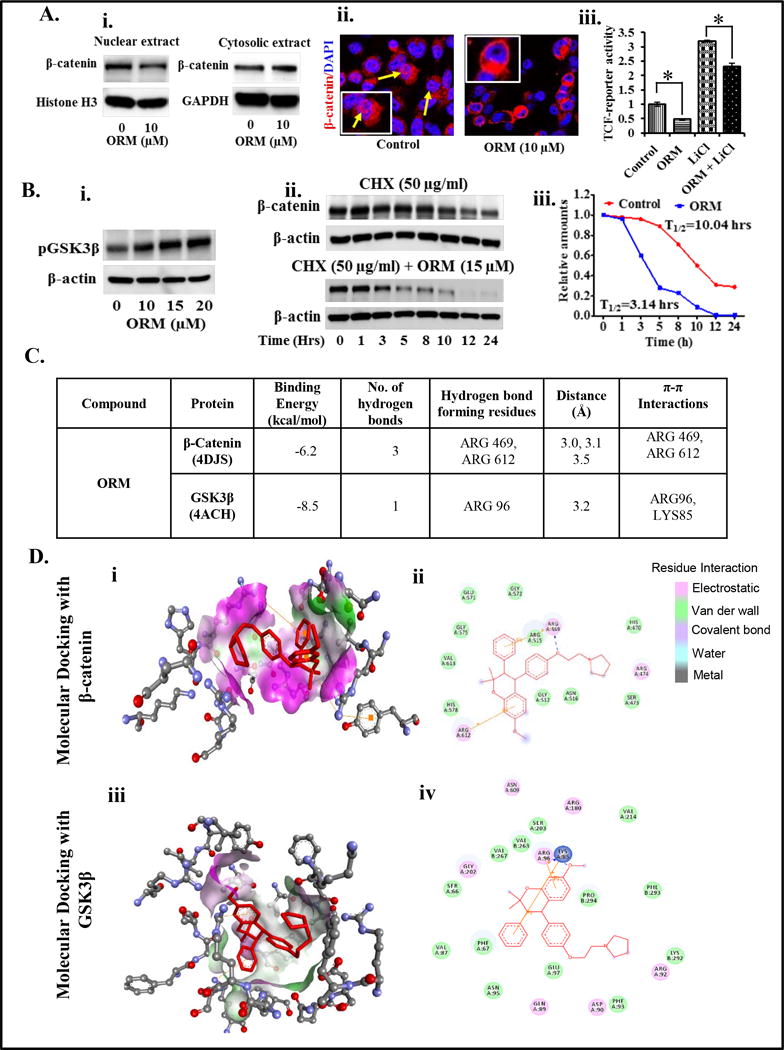
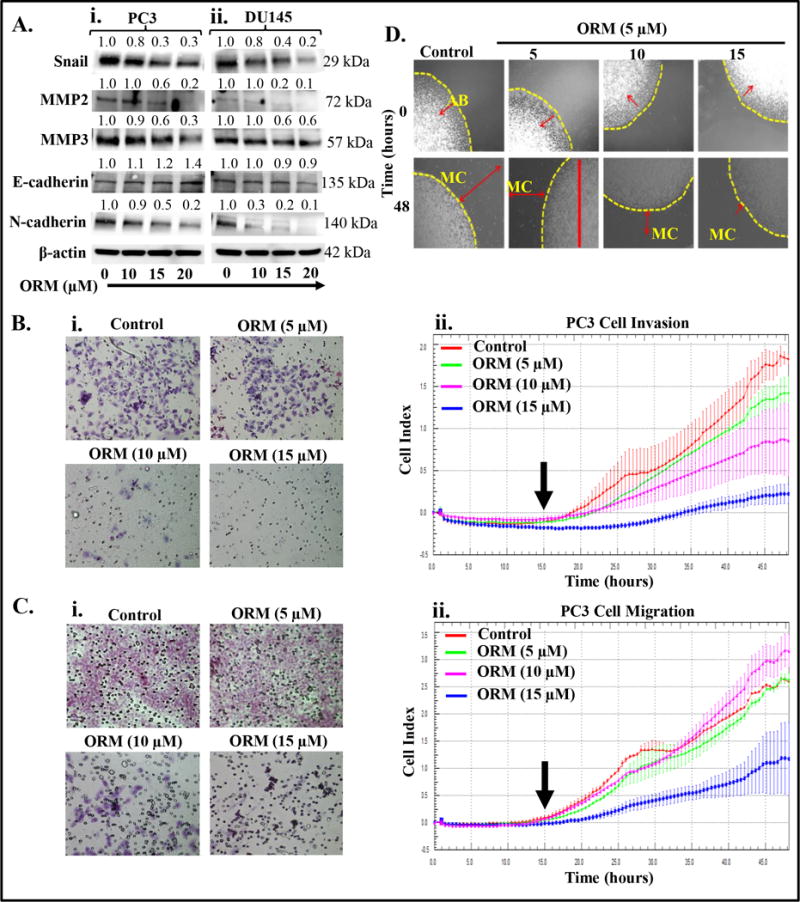
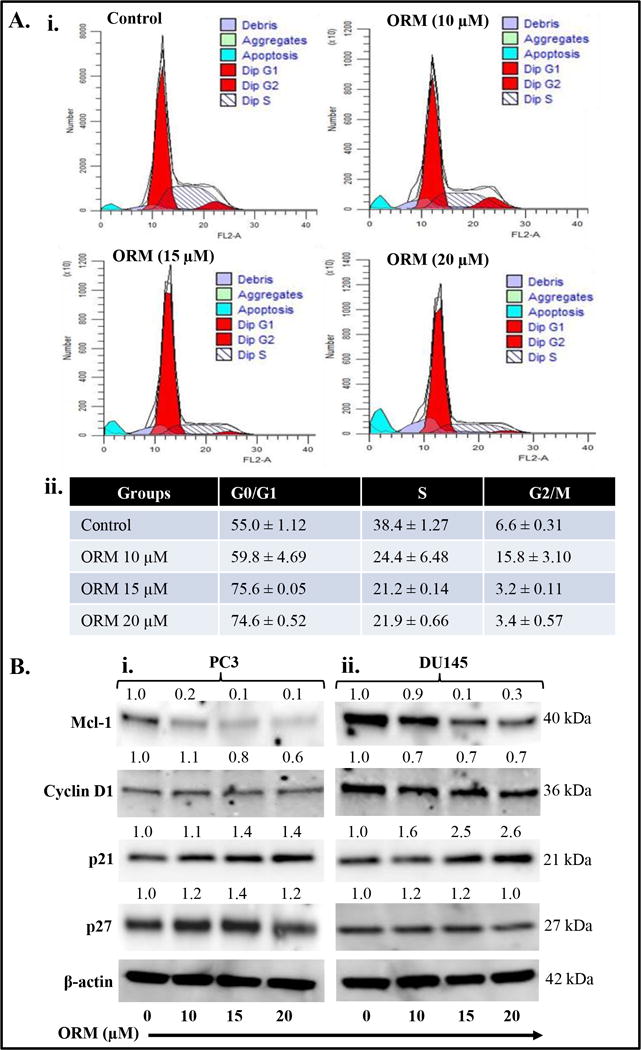
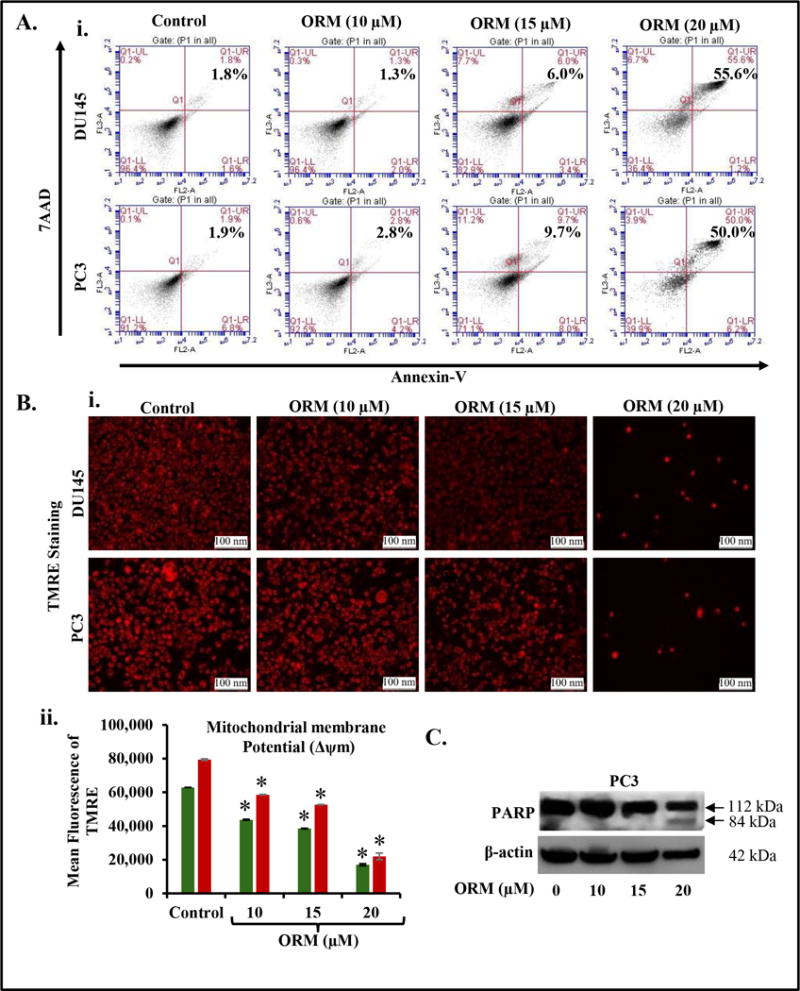
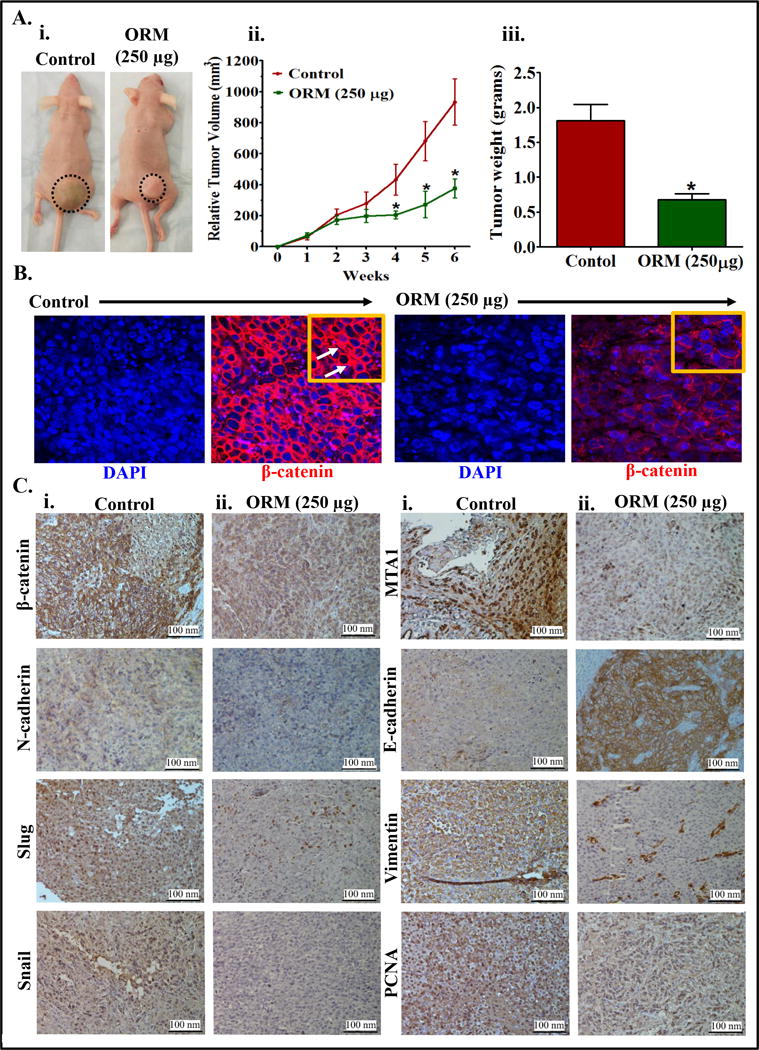
Ormeloxifene is a clinically approved selective estrogen receptor modulator, which has also shown excellent anticancer activity, thus it can be an ideal repurposing pharmacophore. Herein, we report therapeutic effects of ormeloxifene on prostate cancer and elucidate a novel molecular mechanism of its anticancer activity. Ormeloxifene treatment inhibited epithelial-to-mesenchymal transition (EMT) process as evident by repression of N-cadherin, Slug, Snail, vimentin, MMPs (MMP2 and MMP3), β-catenin/TCF-4 transcriptional activity, and induced the expression of pGSK3β. In molecular docking analysis, ormeloxifene showed proficient docking with β-catenin and GSK3β. In addition, ormeloxifene induced apoptosis, inhibited growth and metastatic potential of prostate cancer cells and arrested cell cycle in G0-G1 phase via modulation of cell-cycle regulatory proteins (inhibition of Mcl-1, cyclin D1, and CDK4 and induction of p21 and p27). In functional assays, ormeloxifene remarkably reduced tumorigenic, migratory, and invasive potential of prostate cancer cells. In addition, ormeloxifene treatment significantly (P < 0.01) regressed the prostate tumor growth in the xenograft mouse model while administered through intraperitoneal route (250 μg/mouse, three times a week). These molecular effects of ormeloxifene were also observed in excised tumor tissues as shown by immunohistochemistry analysis. Our results, for the first time, demonstrate repurposing potential of ormeloxifene as an anticancer drug for the treatment of advanced stage metastatic prostate cancer through a novel molecular mechanism involving β-catenin and EMT pathway. Mol Cancer Ther; 16(10); 2267-80. ©2017 AACR.


Conflict of interest statement

Conflict of interest: No potential conflicts of interest were disclosed

Figures

Figure 1
Figure 1. ORM inhibits the growth of hormone refractory PrCa cells
A. Effect of ORM on cell viability of PC3 (i) and DU145 (ii) cells. Briefly, cells (2,500) were seeded in each well of 96-well plate and after overnight incubation, cells were treated with the indicated concentrations of ORM for 24 and 48 hrs. Cell viability was assessed by MTS assay. The line graph represents the percent viable cells compared to the vehicle-treated group cells. Each concentration value is the mean±SE of triplicate wells of each group. B. Effect of ORM on PrCa cells proliferation. Briefly, PrCa cells (5,000 cells/well) were seeded in E-plate (xCELLigence) following the xCELLigence Real Time Cell Analyzer (RTCA) DP instrument manual as provided by the manufacturer. After 38 hrs, ORM or the vehicle control was added and the experiment was allowed to run for 80 hrs. Average baseline cell index for ORM-treated PC3 (Bi) and DU145 (Bii) cells was compared to vehicle treated group. C–D. Effect of ORM on clonogenic potential of PrCa cells. Representative colony images of control and ORM treated PC3 (Ci) and DU145 (Di) cells. Bar graphs indicating quantification of colony formation in PC3 (Cii) and DU145 (Dii) cells. Asterisk (*) denotes the significant value p<0.05.
Figure 2
Figure 2. Effect of ORM on β-catenin signaling pathway and molecular docking of ORM with β-catenin and GSK3β
A. Effect of ORM on β-catenin distribution in cytoplasm and nucleus of DU145 cells. Briefly, cells were treated with indicated concentrations of ORM for 24 hrs, nuclear extracts were prepared and subjected for Western blot analysis to detect the protein levels of β-catenin. Results demonstrating decreased expression of nuclear β-catenin and increased expression of β-catenin in the cytoplasm (Ai) of DU145 cells. Blots were re-probed with Histone H3 and GAPDH antibodies as an internal control. Effect of ORM on β-catenin localization in PC3 cells as determined by confocal microscopy (Aii). Yellow arrows indicate localization of β-catenin in control and ORM treated cells after 24 hrs treatment (Original magnification 40×) (Aii). Effect of ORM on TCF-4 promoter activity (Aiii). Cells were transiently co-transfected with TCF-firefly luciferase reporter constructs (pTOP-FLASH) (1 μg) and Renilla luciferase (200 ng) or (pFOP-FLASH) (1 μg) and Renilla luciferase (200 ng). After 24 hrs, cells were treated with LiCl (50 μM) alone or in combination with ORM (10 μM). Cell lysates were prepared 6 hrs post-treatment and firefly and Renilla luciferase activity was analyzed by using Dual luciferase kit (Promega). The β-catenin/TCF transcription activity was determined by normalizing the firefly luciferase activity to that of Renilla luciferase activity and calculating the ratio of TOP-FLASH signal to FOP-FLASH signal. Values in bar graph indicates mean±SE of three wells reading in each group. Asterisk (*) denotes the significant value p<0.01. B. Effects of ORM on protein levels of phospho GSK3β in DU145 as determined by Western blot analysis (Bi). Effect of ORM on β-catenin degradation as analyzed by pulse chase experiment. Briefly, DU145 cells were treated with CHX (50 μg) alone or in combination with ORM (15 μM) at indicated time points. Protein lysates were prepared and subjected for Western blot analysis to analyze the protein levels of β-catenin. Results indicates protein levels of β-catenin in alone CHX-treated (upper blot) and in CHX and ORM-treated (Lower blot) (Bii). Line graph showing quantification of Western blots of Figure Bii. T1/2 denotes time point for 50% β-catenin degradation. C–D. Molecular docking studies of ORM with β-catenin and GSK3β. C. Table showing docking score of ORM with β-catenin and GSK3β. D. Stereo view of ORM binding with β-catenin (Di) and GSK3β (Diii) showing hydrogen bond donor and acceptor residues around component. Schematic diagram of ORM docking with β-catenin (Dii) and GSK3β (Div) showing residues involved in hydrogen-bonding, Pi interactions, charge or polar interactions, Van der Waals interactions which are represented by respective colors.
Figure 3
Figure 3
Effect of ORM on cell invasion, migration and EMT markers. Briefly, 70% confluent PrCa cells were treated with ORM (10–20 μM) for 24 hrs. Cell lysates were prepared and subjected for Western blot analysis for EMT markers and MMPs analysis. A. Effect of ORM on EMT markers (E-cadherin, N-Cadherin and Snail) and MMPs (MMP2 and MMP3) in PC3 (i) and DU145 (ii) cells. Values shown above the blots are the densitometry analysis of each protein band normalized with respective β-actin value. B. Effect of ORM on invasion of PC3 cells as determined by Boyden chamber and xCELLigence assays. Representative photographs (20× original magnification) of invaded cells of control and ORM treated PC3 cells as determined by Boyden chamber kit (i). Effect of ORM on real time cell invasion (ii). Briefly, PC3 cells (7×10⁴) were seeded in invasion plate and invasion potential of these cells was determined by xCELLigence instrument as described in material and methods. Results indicate dose-dependent decrease in Cell Index, which correlates inhibition of real time cell invasion by ORM treatment (ii). C. Effect of ORM on cell migration of PC3 cells as determined by Boyden chamber and xCELLigence assays. Representative images (20× original magnification) showing inhibition of PC3 cells migration by Boyden chamber assay (i). Effect of ORM on real time cell migration as determined by xCELLigence assay (ii). Briefly, PC3 cells (7×10⁴) were seeded in migration plate and ORM treatment (5–15 μM) was given after 15 hrs and allowed the plate at 37 °C and 5% CO2 for real time migration assay up to 48 hrs. Results indicate significant decrease in migratory potential of ORM treated PC3 cells compared to control. D. Effect of ORM on motility potential of PC3 cells as determined by agarose bead assay. Representative images of migratory cells (MC) in control and ORM-treated groups at 0 and 48 hrs. AB denotes agarose beads. Images were captured at 20× magnification.
Figure 4
Figure 4. Effect of ORM on cell cycle progression of prostate cancer cells
ORM arrests PC3 cell cycle in G0/G1 phase as determined by flow cytometry. A. Histogram (i) and table (ii) represent the cell cycle distribution in PC3 cells. B. Effect of ORM on protein levels of cell cycle regulatory proteins (Cyclin D1, Mcl-1, p21 and p27) in both PC3 (Bi) and DU145 (Bii) cells. Briefly, cells were treated with indicated concentrations of ORM for 24 hrs, total cell lysates were prepared and subjected for Western blot analysis. Equal loading of protein in each lane was determined by probing the blots with β-actin antibody. Values shown above the blots are the densitometry analysis of each protein band normalized with respective β-actin value.
Figure 5
Figure 5. ORM treatment induces apoptosis in PrCa cells
PC3 and DU145 cells were treated with indicated concentration of ORM for 24 hrs and processed for apoptosis analysis using Annexin V-7AAD apoptosis kit. A. Representative FL3-A and FL2-A plots showing dose-dependent increase of apoptosis in DU145 (i) and PC3 cells (ii). B. Effect of ORM on mitochondrial membrane potential (Δѱm) as determined by TMRE staining. Representative Fluorescence images showing dose-dependent effect of ORM on TMRE staining in PC3 and DU145 cells (i). Bar graph indicating dose-dependent inhibition of mitochondrial membrane potential (Δѱm) in ORM-treated PC3 and DU145 cells as determined by flow cytometry. Asterisk (*) denotes the significant value p<0.01. C. Effect of ORM on PARP cleavage. Briefly, 70% confluent PrCa cells were treated with ORM (10–20 μM) for 24 hrs. Whole cell lysates was prepared and subjected for Western blot analysis for full and cleaved PARP.
Figure 6
Figure 6. ORM inhibits prostate tumor growth in xenograft mouse model
A. Effect of ORM on PC3 cells derived xenograft tumors in athymic nude mice. In brief, a total of 12 mice were used in this experiment and were divided into two groups. 2×10⁶ PC3 cells were injected subcutaneously on dorsal flank of each mouse. ORM (250 μg) was administered (intra-peritoneal; 250 μg/mouse) thrice/week till 6 weeks and control group mice received 0.2% Ethanol in PBS as vehicle control. Mice of both the groups were sacrificed when control mice reached a targeted tumor volume of 1000 mm3. Representative mouse picture of control and ORM treated tumor bearing mouse (i). Average tumor volume of each group mice at different weeks (ii). Bar graph representing tumor weight of each group mice (iii). Value in graph represents mean±SE of 6 mice in each group. Asterisk (*) denotes the significant value p<0.01. B. Effect of ORM on β-catenin expression in xenograft tumors of control and ORM treated mice as determined by immunofluorescence (IF) analysis. White arrows indicate β-catenin accumulation in nucleus of the xenograft tissues. C. Effect of ORM on the expressions of β-catenin, N-cadherin, MTA1, Slug, Snail, Vimentin, and E-cadherin and PCNA in excised tumors of control (i) and ORM (ii) treated mice as determined by immunohistochemistry (IHC) analysis. All images of IF and IHC analyses was captured at 20× magnification.

Similar articles

Cited by

References

    1. Siegel RL, Miller KD, Jemal A. Cancer Statistics, 2017. CA: a cancer journal for clinicians. 2017;67(1):7–30. doi: 10.3322/caac.21387. - DOI - PubMed
    1. Silvestris N, Leone B, Numico G, Lorusso V, De Lena M. Present status and perspectives in the treatment of hormone-refractory prostate cancer. Oncology. 2005;69(4):273–82. doi: 10.1159/000089676. - DOI - PubMed
    1. Chen G, Shukeir N, Potti A, Sircar K, Aprikian A, Goltzman D, et al. Up-regulation of Wnt-1 and beta-catenin production in patients with advanced metastatic prostate carcinoma: potential pathogenetic and prognostic implications. Cancer. 2004;101(6):1345–56. doi: 10.1002/cncr.20518. - DOI - PubMed
    1. Jaggi M, Nazemi T, Abrahams NA, Baker JJ, Galich A, Smith LM, et al. N-cadherin switching occurs in high Gleason grade prostate cancer. The Prostate. 2006;66(2):193–9. doi: 10.1002/pros.20334. - DOI - PubMed
    1. Jaggi M, Johansson SL, Baker JJ, Smith LM, Galich A, Balaji KC. Aberrant expression of E-cadherin and beta-catenin in human prostate cancer. Urologic oncology. 2005;23(6):402–6. doi: 10.1016/j.urolonc.2005.03.024. - DOI - PubMed

Publication types

MeSH terms