. 2017 Oct 1;118(4):2059-2069.
doi: 10.1152/jn.00680.2016. Epub 2017 Jun 14.

Prevention and reversal of latent sensitization of dorsal horn neurons by glial blockers in a model of low back pain in male rats

Affiliations

Prevention and reversal of latent sensitization of dorsal horn neurons by glial blockers in a model of low back pain in male rats

Juanjuan Zhang et al. J Neurophysiol. .

Abstract

In an animal model of nonspecific low back pain, recordings from dorsal horn neurons were made to investigate the influence of glial cells in the central sensitization process. To induce a latent sensitization of the neurons, nerve growth factor (NGF) was injected into the multifidus muscle; the manifest sensitization to a second NGF injection 5 days later was used as a read-out. The sensitization manifested in increased resting activity and in an increased proportion of neurons responding to stimulation of deep somatic tissues. To block microglial activation, minocycline was continuously administered intrathecally starting 1 day before or 2 days after the first NGF injection. The glia inhibitor fluorocitrate that also blocks astrocyte activation was administrated 2 days after the first injection. Minocycline applied before the first NGF injection reduced the manifest sensitization after the second NGF injection to control values. The proportion of neurons responsive to stimulation of deep tissues was reduced from 50% to 17.7% (P < 0.01). No significant changes occurred when minocycline was applied after the first injection. In contrast, fluorocitrate administrated after the first NGF injection reduced significantly the proportion of neurons with deep input (15.8%, P < 0.01). A block of glia activation had no significant effect on the increased resting activity. The data suggest that blocking microglial activation prevented the NGF-induced latent spinal sensitization, whereas blocking astrocyte activation reversed it. The induction of spinal neuronal sensitization in this pain model appears to depend on microglia activation, whereas its maintenance is regulated by activated astrocytes.NEW & NOTEWORTHY Activated microglia and astrocytes mediate the latent sensitization induced by nerve growth factor in dorsal horn neurons that receive input from deep tissues of the low back. These processes may contribute to nonspecific low back pain.

Keywords: electrophysiology; glial cell activation; latent sensitization; nerve growth factor; nonspecific low back pain.


Figures

Fig. 1.
Fig. 1.
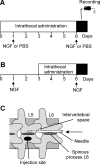
Intrathecal administration. A: schedule of intrathecal administration starting 1 day before the first nerve growth factor (NGF) or PBS injection. B: intrathecal administration starting 2 days after the first NGF injection. Open bars indicate intrathecal administration via the osmotic pump. The duration of intrathecal treatment differs between prevention [mino-pre group (A)] and reversal protocols [mino-post group and fluoro-post group (B)]. In A the intrathecal administration started before the first NGF injection that induced the neuronal latent sensitization, whereas in B the blockers were given during the state of latent sensitization, which was caused by the first NGF injection. Upward arrows indicate time of NGF or PBS injection. Solid bars represent recording period of 4 h, starting immediately after the second NGF or PBS injection. C: location of the lumbar puncture (needle) between the vertebrae L5 and L6. The catheter was inserted through the needle (arrow) on the right of the spinous processes and pushed craniad. The site of NGF or PBS injection into the multifidus muscle (marked in black) was located on the left side of spinous process L5. Recordings were made at the level of vertebra T12 in spinal segment L2.
Fig. 2.
Fig. 2.
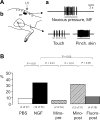
Proportion of dorsal horn neurons with deep or cutaneous input. A: neurons with input from deep tissues (e.g., muscle, fascia). B: neurons with skin input. There were two control groups, PBS (open bar, group 1), two PBS (vehicle) injections into the multifidus muscle; NGF (solid bar, group 2), two injections of NGF into the muscle. The injections were given at 5-day intervals. In both control groups artificial cerebrospinal fluid was administered intrathecally. Test groups with intrathecal administration of minocycline or fluorocitrate included the following: mino-pre (hatched bar, group 3) (2 NGF injections and minocycline administration starting before the first NGF injection), mino-post (hatched bar, group 4) (2 NGF injections and minocycline administration after the first NGF injection), and fluoro-post (gray bar, group 5) (2 NGF injections and fluorocitrate administration after the first NGF injection). The numbers underneath the bars are those of the neurons from which the bars were constructed. The P value indicates statistically significant differences between the treatment groups (Fisher’s exact probability test). The insert illustrates the protocol of searching for receptive fields in a fixed order (Hoheisel et al. 2015). 1, toes; 2, metatarsus; 3, heels; 4, lower leg; 5, knee; 6, thigh; 7, base of tail; 8, low back; 9, lateral abdomen.
Fig. 3.
Fig. 3.
Receptive fields located in deep somatic tissues. A: outlines of the rat body showing the approximate location and size of deep receptive fields. Open areas are deep receptive fields located in the low back (multifidus muscle, thoracolumbar fascia); hatched areas are deep receptive fields located outside the low back. B: proportion of neurons with receptive fields in the multifidus muscle and/or the thoracolumbar fascia (open areas in A). C: proportion of neurons with receptive fields in deep tissues outside the low back (hip, entire hind limb; hatched areas in A). B and C are subpopulations of the neurons shown in Fig. 2A. Experimental groups and numbers are in parentheses as in Fig. 2.
Fig. 4.
Fig. 4.
Responsiveness to noxious and innocuous stimulation of deep tissues. A: proportion of neurons that responded to noxious but not to innocuous mechanical stimulation of deep tissues. HTM, high-threshold mechanosensitive. B: neurons that responded to moderate, innocuous pressure applied to deep somatic structures. LTM, low-threshold mechanosensitive. Experimental groups and numbers are in parentheses as in Fig. 2.
Fig. 5.
Fig. 5.
Dorsal horn neurons with convergent input (neurons with input from >1 type of tissue). A: recording from a single neuron (NGF group). a: Responses of the neuron to noxious stimulation applied to the multifidus (MF) muscle (noxious pressure) and to touching or pinching the skin (touch, pinch, skin). Open bars underneath the registrations indicate time and duration of stimulation. b: Outline of the rat body showing the approximate location and size of the receptive fields. Black area shows receptive field in the MF muscle; white area shows receptive field in the skin. B: proportion of neurons with convergent input in the 5 treatment groups. Experimental groups and numbers are in parentheses as in Fig. 2.
Fig. 6.
Fig. 6.
Resting activity of dorsal horn neurons. A: original registrations from 2 active neurons (marked in B). a: Neuron with low resting activity. b: Neuron with high resting activity. B: discharge frequency of all neurons (with and without resting activity). Open arrows indicate the median in each group (see also Table 1). C: proportion of neurons having resting activity. Experimental groups and numbers are in parentheses as in Fig. 2. The P value indicates statistically significant differences between the treatment groups (B: Mann-Whitney U-test; C: Fisher’s exact probability test).
Fig. 7.
Fig. 7.
Time point of measuring the resting activity for active and silent neurons during the 4 h of the recording session. Solid circles, active neurons having receptive fields (RF) in deep tissues of the low back close to the injection site excluding the hip and the thigh; shaded circles, active neurons having RF in tissues other than the low back; open circles, silent neurons (no resting activity). Experimental groups are as in Fig. 2.
Fig. 8.
Fig. 8.
Images of microglial cells, astrocytes, and quantitative analysis. A: microglial cells visualized by ionized calcium-binding adapter molecule 1 (Iba-1) immunoreactivity. a: 1 day after the second PBS injection (see Fig. 1, control). b: 1 day after the second NGF injection. c and d: Quantitative analysis (same region as shown in Aa and Ab). c: Circularity of microglial cells (circularity increases when microglial cells become less ramified). d: Mean number of intersections (Sholl analysis: quantitative study of the radial distribution of the arborization pattern). Open bars are PBS injection; solid bars are NGF injection. Fifteen sections from 5 animals were evaluated, using image analysis software ImageJ (NIH, Bethesda, MD). B: astrocytes visualized by glial fibrillary acidic protein immunoreactivity (a, PBS injections; b, NGF injections). Circularity is as follows: PBS, 0.82 ± 0.013; NGF, 0.83 ± 0.0094, not significant; Sholl analysis: not tested, too much overlap of cells. Scale bars = 30 µm, thickness of the tissue sections = 20 µm. Spinal segment L2, neck of the dorsal horn. Microglial cells showed a plumper form (increased circularity) and lesser ramification (decreased number of intersections) after 2 NGF injections compared with the PBS control group. Changes in astrocyte immunohistochemistry did not reach significant values.

References

    1. Ali I, Chugh D, Ekdahl CT. Role of fractalkine-CX3CR1 pathway in seizure-induced microglial activation, neurodegeneration, and neuroblast production in the adult rat brain. Neurobiol Dis 74: 194–203, 2015. doi:10.1016/j.nbd.2014.11.009. - DOI - PubMed
    1. Balagué F, Mannion AF, Pellisé F, Cedraschi C. Nonspecific low back pain. Lancet 379: 482–491, 2012. doi:10.1016/S0140-6736(11)60610-7. - DOI - PubMed
    1. Cao J, Li Z, Zhang Z, Ren X, Zhao Q, Shao J, Li M, Wang J, Huang P, Zang W. Intrathecal injection of fluorocitric acid inhibits the activation of glial cells causing reduced mirror pain in rats. BMC Anesthesiol 14: 119, 2014. doi:10.1186/1471-2253-14-119. - DOI - PMC - PubMed
    1. Chacur M, Lambertz D, Hoheisel U, Mense S. Role of spinal microglia in myositis-induced central sensitisation: an immunohistochemical and behavioural study in rats. Eur J Pain 13: 915–923, 2009. doi:10.1016/j.ejpain.2008.11.008. - DOI - PubMed
    1. Clark AK, Gentry C, Bradbury EJ, McMahon SB, Malcangio M. Role of spinal microglia in rat models of peripheral nerve injury and inflammation. Eur J Pain 11: 223–230, 2007. doi:10.1016/j.ejpain.2006.02.003. - DOI - PubMed

Publication types

MeSH terms

LinkOut - more resources