. 2017 Jun 14;9(394):eaah6144.
doi: 10.1126/scitranslmed.aah6144.

Drugging the catalytically inactive state of RET kinase in RET-rearranged tumors

Affiliations

Drugging the catalytically inactive state of RET kinase in RET-rearranged tumors

Dennis Plenker et al. Sci Transl Med. .

Abstract

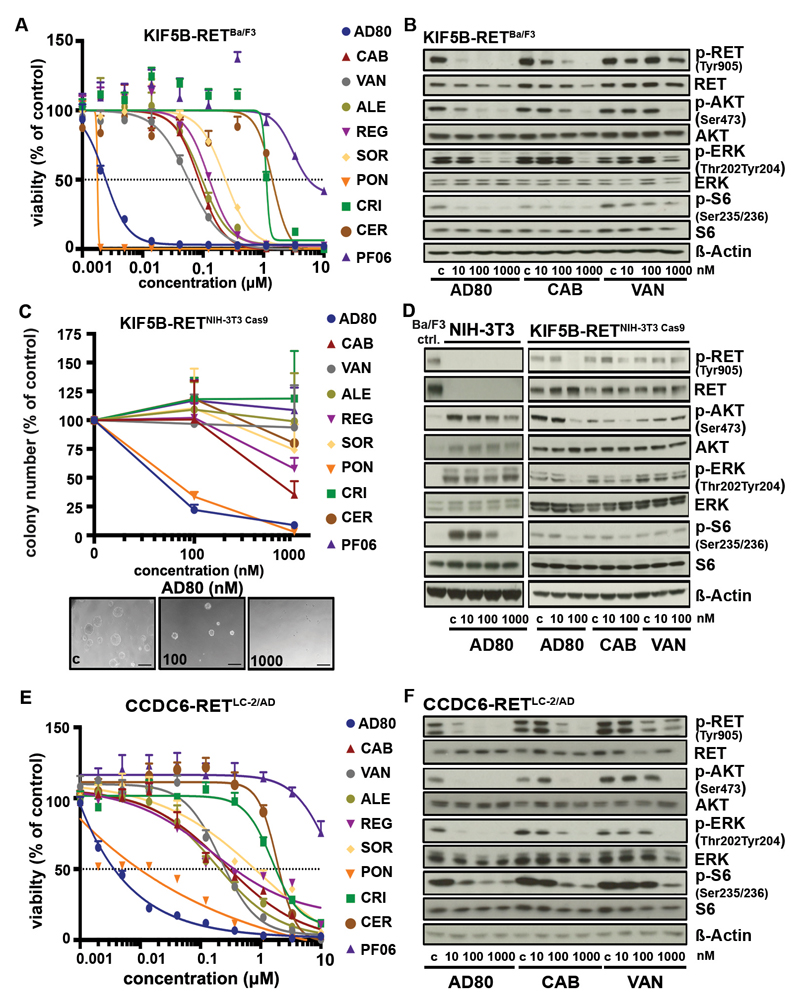
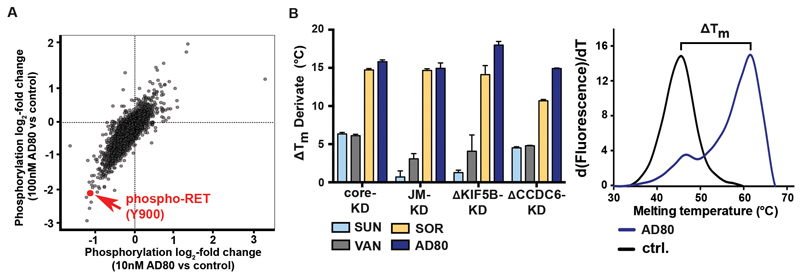
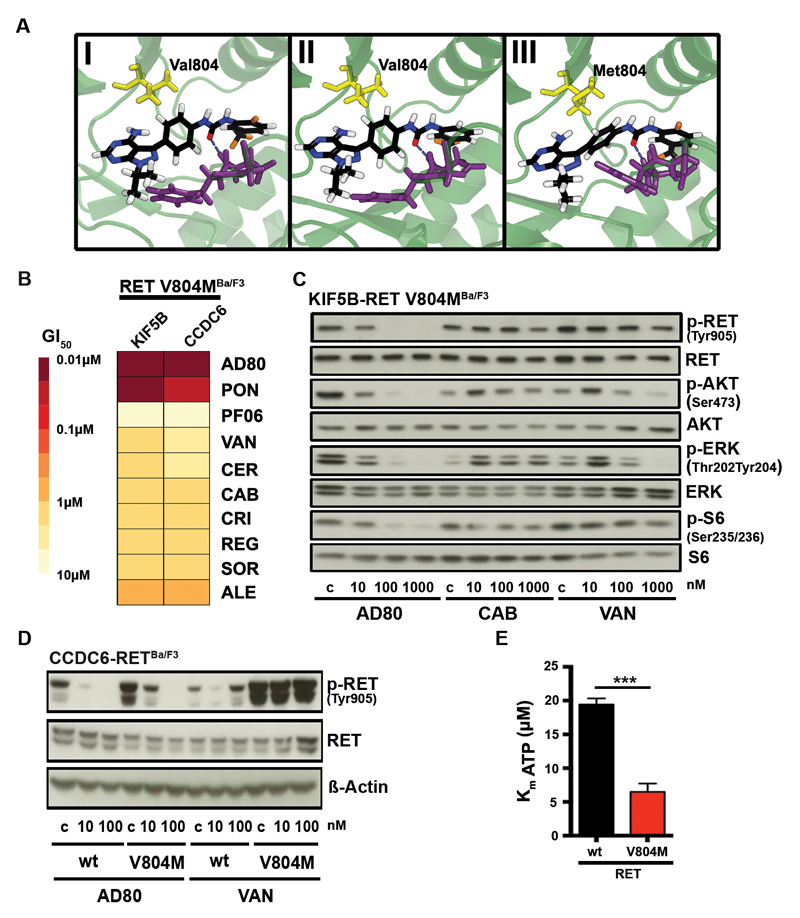
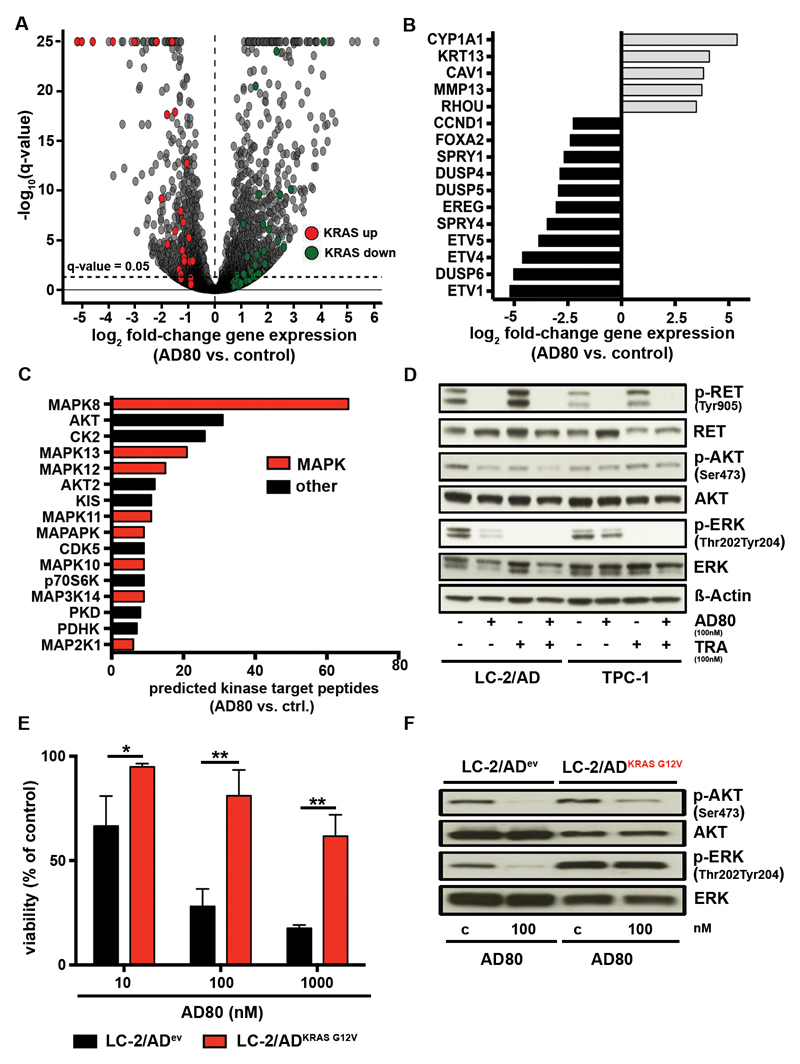
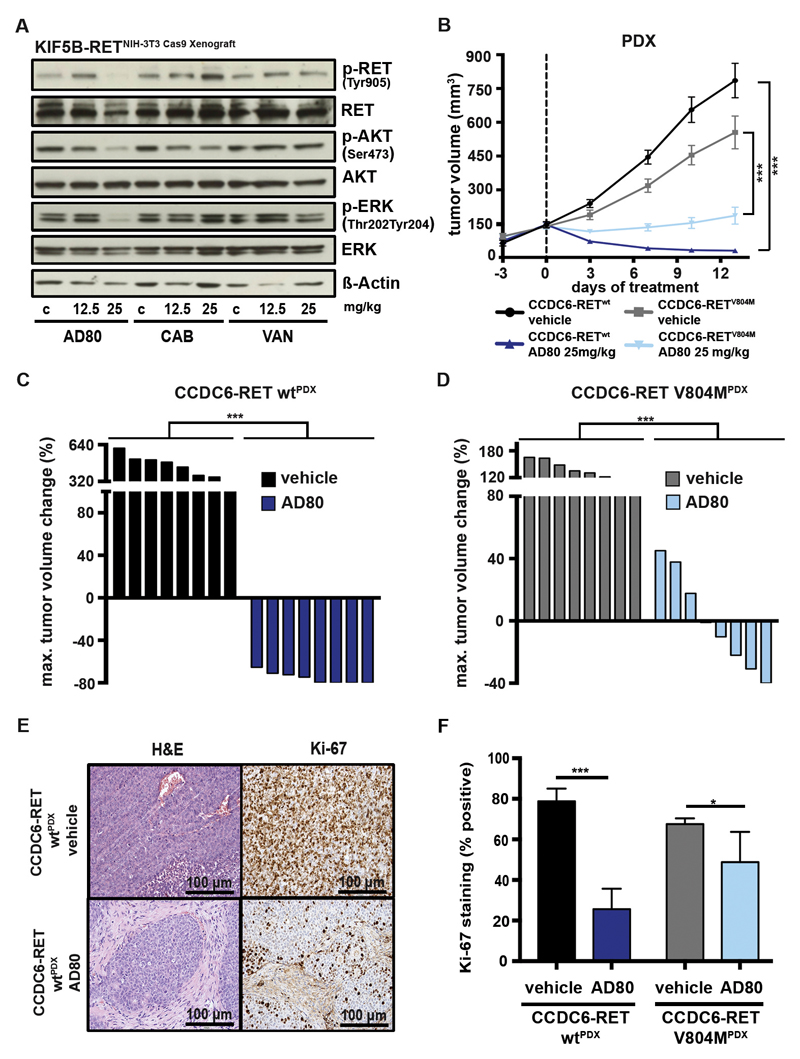
Oncogenic fusion events have been identified in a broad range of tumors. Among them, RET rearrangements represent distinct and potentially druggable targets that are recurrently found in lung adenocarcinomas. We provide further evidence that current anti-RET drugs may not be potent enough to induce durable responses in such tumors. We report that potent inhibitors, such as AD80 or ponatinib, that stably bind in the DFG-out conformation of RET may overcome these limitations and selectively kill RET-rearranged tumors. Using chemical genomics in conjunction with phosphoproteomic analyses in RET-rearranged cells, we identify the CCDC6-RETI788N mutation and drug-induced mitogen-activated protein kinase pathway reactivation as possible mechanisms by which tumors may escape the activity of RET inhibitors. Our data provide mechanistic insight into the druggability of RET kinase fusions that may be of help for the development of effective therapies targeting such tumors.


Conflict of interest statement

Competing interest: R.K.T. is a founder and consultant of NEO New Oncology GmbH, received commercial research grants from AstraZeneca, EOS and Merck KgaA and honoraria from AstraZeneca, Bayer, NEO New Oncology AG, Boehringer Ingelheim, Clovis Oncology, Daiichi-Sankyo, Eli Lilly, Johnson & Johnson, Merck KgaA, MSD, Puma, Roche and Sanofi. F.L. and J.M.H. are employee of NEO New Oncology GmbH. M.L.S received commercial research grants from Novartis. K.M.S and M.L.S. are both patent holders for the compound AD80.

Figures

Figure 1
Figure 1
A) Dose-response curves (72h) as assessed for AD80, cabozantinib (CAB), vandetanib (VAN), alectinib (ALE), regorafenib (REG), sorafenib (SOR), ponatinib (PON), crizotinib (CRI), ceritinib (CER) or PF06463922 (PF06) in KIF5B-RET expressing Ba/F3 cells. B) Immunoblotting results of KIF5B-RET rearranged Ba/F3 cells after treatment are displayed (4h). C) Relative mean colony number of NIH-3T3 cells engineered with KIF5B-RET fusion via CRISPR/Cas9 was assessed in soft agar assays after 7 days under treatment. Representative pictures of colonies under AD80 treatment are depicted in the lower panel. Black bar is equal to 100µm. D) Immunoblotting of treated CRISPR/Cas9 engineered KIF5B-RET-rearranged NIH-3T3 cells with AD80, cabozantinib or vandetanib (4h). KIF5B-RET expressing Ba/F3 cells (Ba/F3 ctrl.) serve as control for RET signaling. E) Dose-response curves (72h) as assessed for different inhibitors in LC-2/AD cells are shown. F) Immunoblotting was performed in LC-2/AD cells treated with AD80, cabozantinib or vandetanib (4h).
Figure 2
Figure 2
A) Scatter plot of log2-fold phosphorylation change for LC-2/AD cells treated (4h) with either 10nM or 100nM AD80. Each dot represents a single phospho-site; phospho-RET (Y900) is highlighted in red. B) Difference in melting temperatures after AD80, sorafenib (SOR), vandetanib (VAN) or sunitinib (SUN) addition (ΔTm) and the respective standard errors of the mean (SEM) are shown for each construct. Thermal shift experiments were performed using independent preparations of each protein and were carried out in triplicates (left panel). Representative thermal melting curves for ΔKIF5B-KD incubated with either AD80 (1μM) or the equivalent volume of DMSO (ctrl.) are shown (right panel).
Figure 3
Figure 3
A) Optimized structures after extensive MD refinement followed by ALPB optimization. (I) RET-wt/AD80 after 102 ns, (II) RET-wt/AD57 after 202 ns (92 ns from RET-wt/AD80 simulation followed by 110 ns TI-MD), (III) RET-V804M/AD80 after 107 ns (side view). The DFG motif is shown in violet. Distances from central phenyl’s center: 4.77 Å to Val804-C(wt), 3.90 Å to Ile788-C(wt) and 4.29 Å to Met804-S(V804M). Dashed lines indicate the marked H-bond between the bound ligands and aspartate of the DFG motif. B) Heatmap of mean GI50-values (from n≥3) of Ba/F3 cells expressing CCDC6-RETV804M or KIF5B-RETV804M after 72h of treatment as assessed for various inhibitors is shown. C) Immunoblotting of AD80, cabozantinib or vandetanib treated (4h) KIF5B-RETV804M Ba/F3 cells is displayed. D) Immunoblotting of Ba/F3 cells expressing CCDC6-RET-RETwt or CCDC6-RETV804M under AD80 or vandetanib treatment (4h). E) Calculated Km values of ATP binding to RETwt or RETV804M-mutant from three independent experiments are displayed. ***, p<0.001.
Figure 4
Figure 4
A) Dose-response curves as assessed for AD80 against Ba/F3 cells expressing KIF5B-RETwt (black) or KIF5B-RETI788N (red) and CCDC6-RETwt (black dashed) or CCDC6-RETI788N (red dashed). B) Column chart of mean GI50-values + SD (from n=3) of KIF5B-RETwt or KIF5B-RETI788N Ba/F3 cells treated (72h) with AD80, cabozantinib (CAB), vandetanib (VAN) or ponatinib (PON). p-values are given as ”*”. C) Immunoblotting of KIF5B-RETwt (left panel) or KIF5B-RETI788N (right panel) and CCDC6-RETwt or CCDC6-RETI788N (lower panel) Ba/F3 treated (4h) with AD80 are displayed (4h). D) Immunoblotting of KIF5B-RETwt, KIF5B-RETV804M or KIF5B-RETI788N Ba/F3 cells treated (4h) with ponatinib are shown. HSP90 is used as loading control. E) Optimized structure after extensive MD refinement followed by ALPB optimization. RET-wt/AD80 after 102 ns (side view). Distance from central phenyl’s center: 4.61 Å to Ile788-C(V804M).
Figure 5
Figure 5
A) RNA-Seq results of LC-2/AD cells treated (48h) with 100nM AD80 are shown. Genes contained within the core enrichments following GSEA against the hallmark gene sets with genes upregulated (KRAS up) or downregulated (KRAS down) by active KRAS are highlighted by red and green, respectively. The dashed line represents FDR-adjusted q-value= 0.05. B) Relevant genes from the top-50 genes with strongest and significant change in RNAseq after AD80 treatment (100nM/48h) are shown. C) The predicted number of down regulated phosphorylation sites for each kinase is shown. All kinases with ≥6 down regulated phosphorylation sites are shown in hierarchical order. Kinases associated with MAPK pathway signaling are highlighted in red. D) In immunoblotting assays RET signaling was monitored in LC-2/AD and TPC-1 cells, treated (48h) with either AD80 (0.1µM), trametinib (TRA) (0.1µM) or a combination of both inhibitors (combo). E) LC-2/ADev or LC-2/ADKRAS G12V cells were treated (72h) with AD80. Results are shown as mean + SD (n=3). p-values given as ”*” are displayed. F) Immunoblotting of LC-2/ADev or LC-2/ADKRAS G12V cells under AD80 treatment (100nM/4h) is shown.
Figure 6
Figure 6
A) Immunoblotting of tumor tissue from CRISPR/Cas9 induced NIH-3T3KIF5B-RET Xenografts was performed. Mice were treated (4h) with vehicle control, 12.5 or 25 mg/kg AD80, CAB or VAN and sacrificed. B) Median tumor volume was assessed using consecutive measurements of patient-derived xenograft (PDX) tumors driven by CCDC6-RETwt or CCDC6-RETV804M rearrangements under treatment with either 25 mg/kg AD80 (14d) or vehicle-control (14d). Treatment starts at day 0. C) Waterfall plot for each CCDC6-RETwt fusion positive PDX depicting best response (14d) under AD80 or vehicle-control treatment is displayed. ***, p<0.001. D) Waterfall plot for each CCDC6-RETV804M positive PDX depicting best response (7d) under AD80 or vehicle-control treatment is displayed. ***, p<0.001. E) Representative IHC stainings for H&E and Ki-67 of AD80 or vehicle control treated CCDC6-RETwt derived PDX. Scale bar represents 100 µm. F) Ki-67 IHC staining and the plotted values are shown. ***, p<0.001.

References

    1. Lipson D, Capelletti M, Yelensky R, Otto G, Parker A, Jarosz M, Curran JA, Balasubramanian S, Bloom T, Brennan KW, Donahue A, et al. Identification of new ALK and RET gene fusions from colorectal and lung cancer biopsies. Nat Med. 2012;18:382–384. - PMC - PubMed
    1. Takeuchi K, Soda M, Togashi Y, Suzuki R, Sakata S, Hatano S, Asaka R, Hamanaka W, Ninomiya H, Uehara H, Lim Choi Y, et al. RET, ROS1 and ALK fusions in lung cancer. Nat Med. 2012;18:378–381. - PubMed
    1. Kohno T, Ichikawa H, Totoki Y, Yasuda K, Hiramoto M, Nammo T, Sakamoto H, Tsuta K, Furuta K, Shimada Y, Iwakawa R, et al. KIF5B-RET fusions in lung adenocarcinoma. Nat Med. 2012;18:375–377. - PMC - PubMed
    1. Kodama T, Tsukaguchi T, Satoh Y, Yoshida M, Watanabe Y, Kondoh O, Sakamoto H. Alectinib shows potent antitumor activity against RET-rearranged non-small cell lung cancer. Molecular Cancer Therapeutics. 2014;13:2910–2918. - PubMed
    1. Kurzrock R, Sherman SI, Ball DW, Forastiere AA, Cohen RB, Mehra R, Pfister DG, Cohen EEW, Janisch L, Nauling F, Hong DS, et al. Activity of XL184 (Cabozantinib), an oral tyrosine kinase inhibitor, in patients with medullary thyroid cancer. J Clin Oncol. 2011;29:2660–2666. - PMC - PubMed